by Gary Alexander
September 19, 2023
Something more dramatic than the loss of 3,000 American lives happened on September 11, 2001. We seem to have lost our nerve and taken leave of our financial senses. We launched a series of costly wars in Afghanistan and Iraq (with incursions elsewhere) and passed freedom restrictions disguised as Patriot Acts, and added costly laws and safety cushions that swelled our national debt 10-fold in just 22 years.
Bin Laden is dead, but did he win after all by killing our spirit of enterprise, risk-taking and freedom?
We took a four-year balanced-budget winning streak (1998 to 2001) and turned it into a 22-year losing streak, including trillion-dollar deficits in each of President Obama’s first four years, and now all four of the COVID and post-COVID 2020s fiscal years. Next week, we mark a sad first – the first rising deficit in a time of rising GDP with no American overseas wars – assuming you don’t count Ukraine as a U.S. war. (President Biden famously yanked America troops out of our 20-year Afghanistan engagement in 2021).
From 1998 to 2001, Presidents Clinton, Bush and the Republican Congress paid down the national debt by $560 billion with four consecutive surpluses: $69.3 billion (1998), $126.6 billion (1999), $236.2 billion (2000) and $128.4 billion (2001), but the first post-9/11 budget (2002) delivered a $157.4 billion deficit with barrels of red ink to follow. The total national debt on September 30, 2001, was $3.3 trillion. Today, it is $33 trillion, 10-fold higher. Measured by debt-to-GDP it was 35% in 2007 but 100%+ now.

Graphs are for illustrative and discussion purposes only. Please read important disclosures at the end of this commentary.
At the end of next week, September 30, the 2023 federal fiscal year wraps up, and the Biden team and Congress have driven the deficit over $2 trillion from last year’s $1.38 trillion. We’ll soon know the end result, but the nonpartisan Committee for a Responsible Federal Budget (CRFB) projected $2 trillion.
What caused the increase? Let’s ask White House Press Secretary, Karine Jean-Pierre. On Tuesday, September 5, a Time reporter asked her, “Why is the deficit increasing?” She responded, “It can be year to year—it can be very volatile.” He followed up; she repeated: “I just laid it out, it can be very volatile. … That’s the way it is, from year to year, it can be variable.” Then, a reporter from The NY Post interjected, “Why?” She shot back, “Talk to an economist, and they’ll tell you specifically.” (NY Post, Sept. 5)
I guess it’s hard to find good help these days, but it’s pretty easy to explain a rising deficit. It doesn’t take an economist. Ask any corporate officer, or a savvy shopper – it’s lower receipts, higher expenditures, or some of both. You can’t explain it in 2023 by wars or recessions (none this year). You can’t explain it by emergency COVID benefits (no longer applicable). It’s big new spending programs, funding for Ukraine (billions disappearing into corrupt hands), lots of folks retiring early, plus rising Social Security benefits.
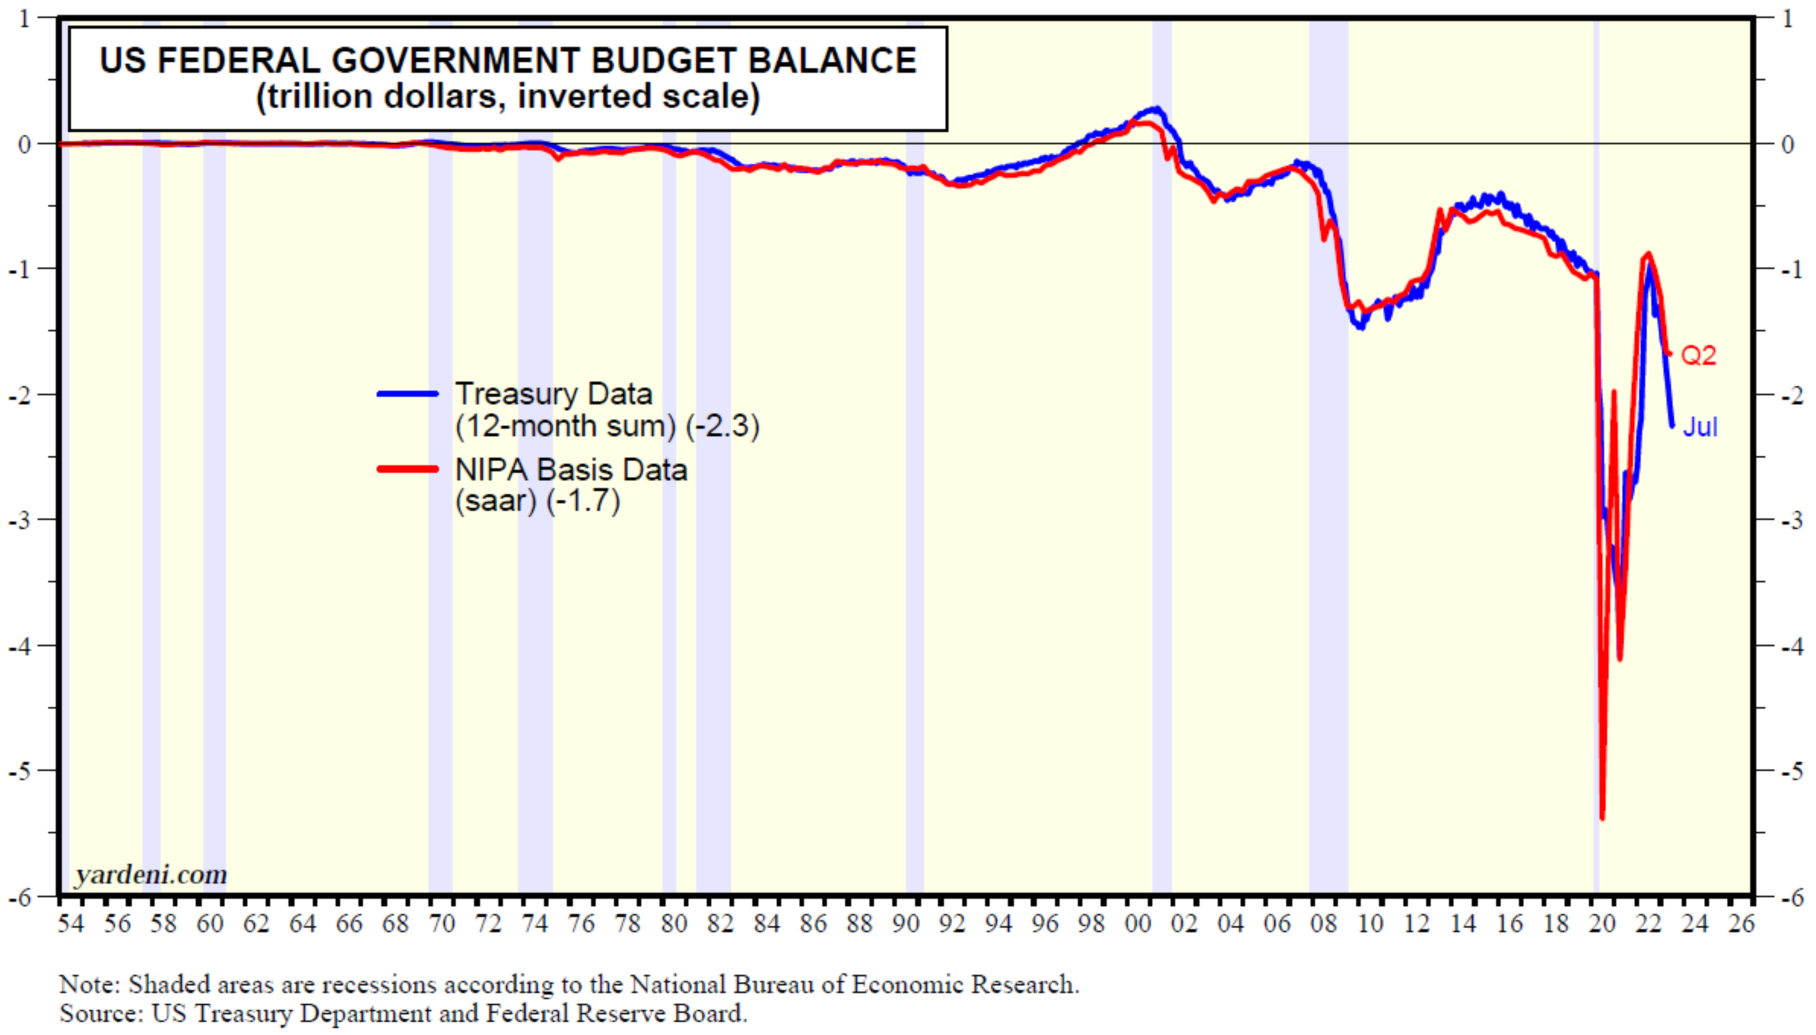
As a result, the 12-month (year-over-year) deficit has more than doubled from a low of $1.0 trillion as of July 2022 to a current $2.3 trillion through July 2023 (see chart, below), according to U.S. Treasury data.
Graphs are for illustrative and discussion purposes only. Please read important disclosures at the end of this commentary.
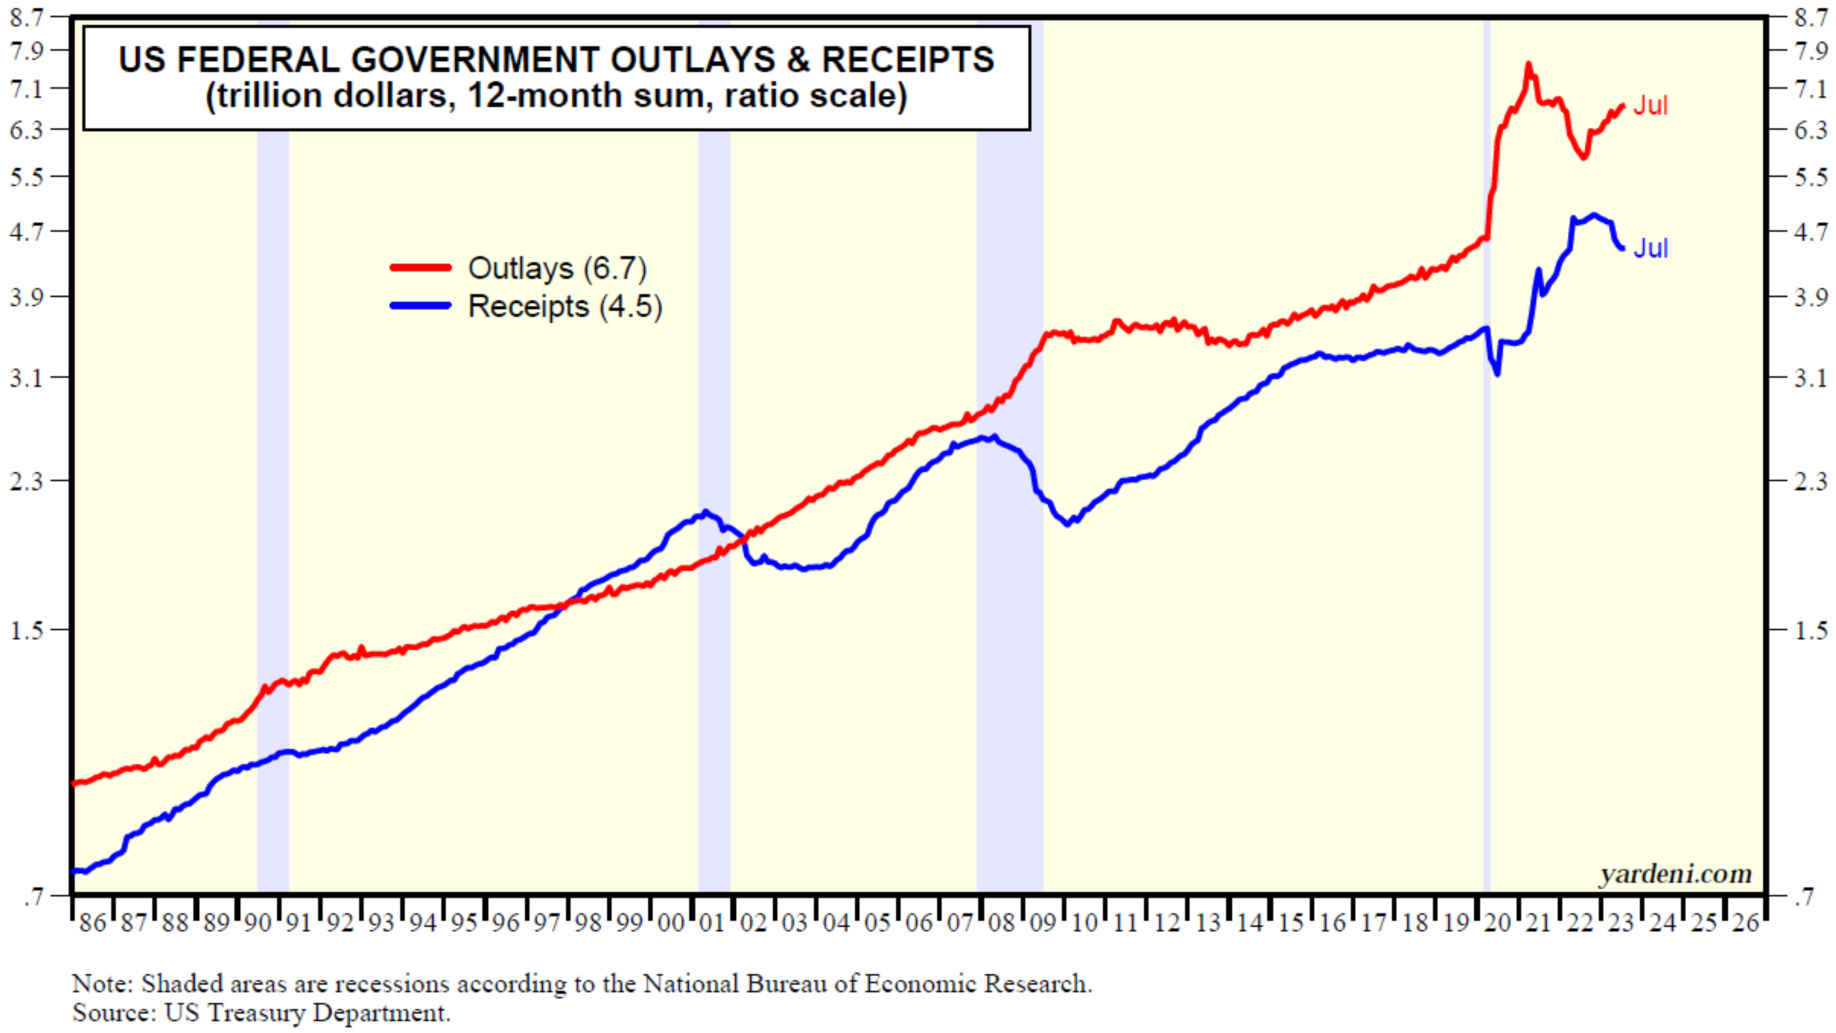
If the President’s press secretary called the boss’s Treasury Department, she would know that there was a half-trillion decrease in income tax receipts, from a record high $2.7 trillion, over the 12 months through last April, to $2.2 trillion over the 12 months through this July, due mostly to last year’s surge in capital gains revenues, as many cashed in for retirement in 2021 or early 2022, vs. staying invested since 2022.
Graphs are for illustrative and discussion purposes only. Please read important disclosures at the end of this commentary.
Next, we must address rising interest rates, engineered by the rapid 5% ratcheting up of the Fed Funds rate since April 2022. Servicing the $33 trillion national debt will now be much more expensive. Long-term rates are also up, as investors have not been so enthusiastic about bidding up 5-to-30-year Treasury bonds, sending yields over 4.3%, near multi-year high (4% is not historically high, since the “old normal” is around 4%, but the “new normal” has been near zero, since shortly after the Financial Crisis of 2008.)
As covered here recently, Fitch Ratings downgraded U.S. government debt from AAA to AA+ on August 1, and there was no immediate reaction of consequence, but the long-term consequence will be a return to the “old normal,” pushing annual interest rate service costs above $1 trillion on our rising federal debt.
Due to the huge spending appetite of the current President and Congress, the Treasury will be selling or auctioning off lots of new notes and bonds throughout the fourth quarter and next election year, all while the Fed’s new quantitative tightening (QT) program continues to shrink the Fed’s holdings of Treasuries by about $60 billion per month. Additionally, the recent banking crisis is causing many commercial banks to let their portfolios of Treasury securities mature, to divest themselves of long-bond maturity risks.
This means the U.S. must rely on the kindness of strangers (overseas investors, for the most part) to keep Treasury yields “low” (at 5% or less), or else rates and the deficit will balloon even higher, faster. Such a faith in China or Europe is a weak reed to lean on, considering the weakness of those economies now.
Whatever Happened in Y2K, Something Changed in 2001
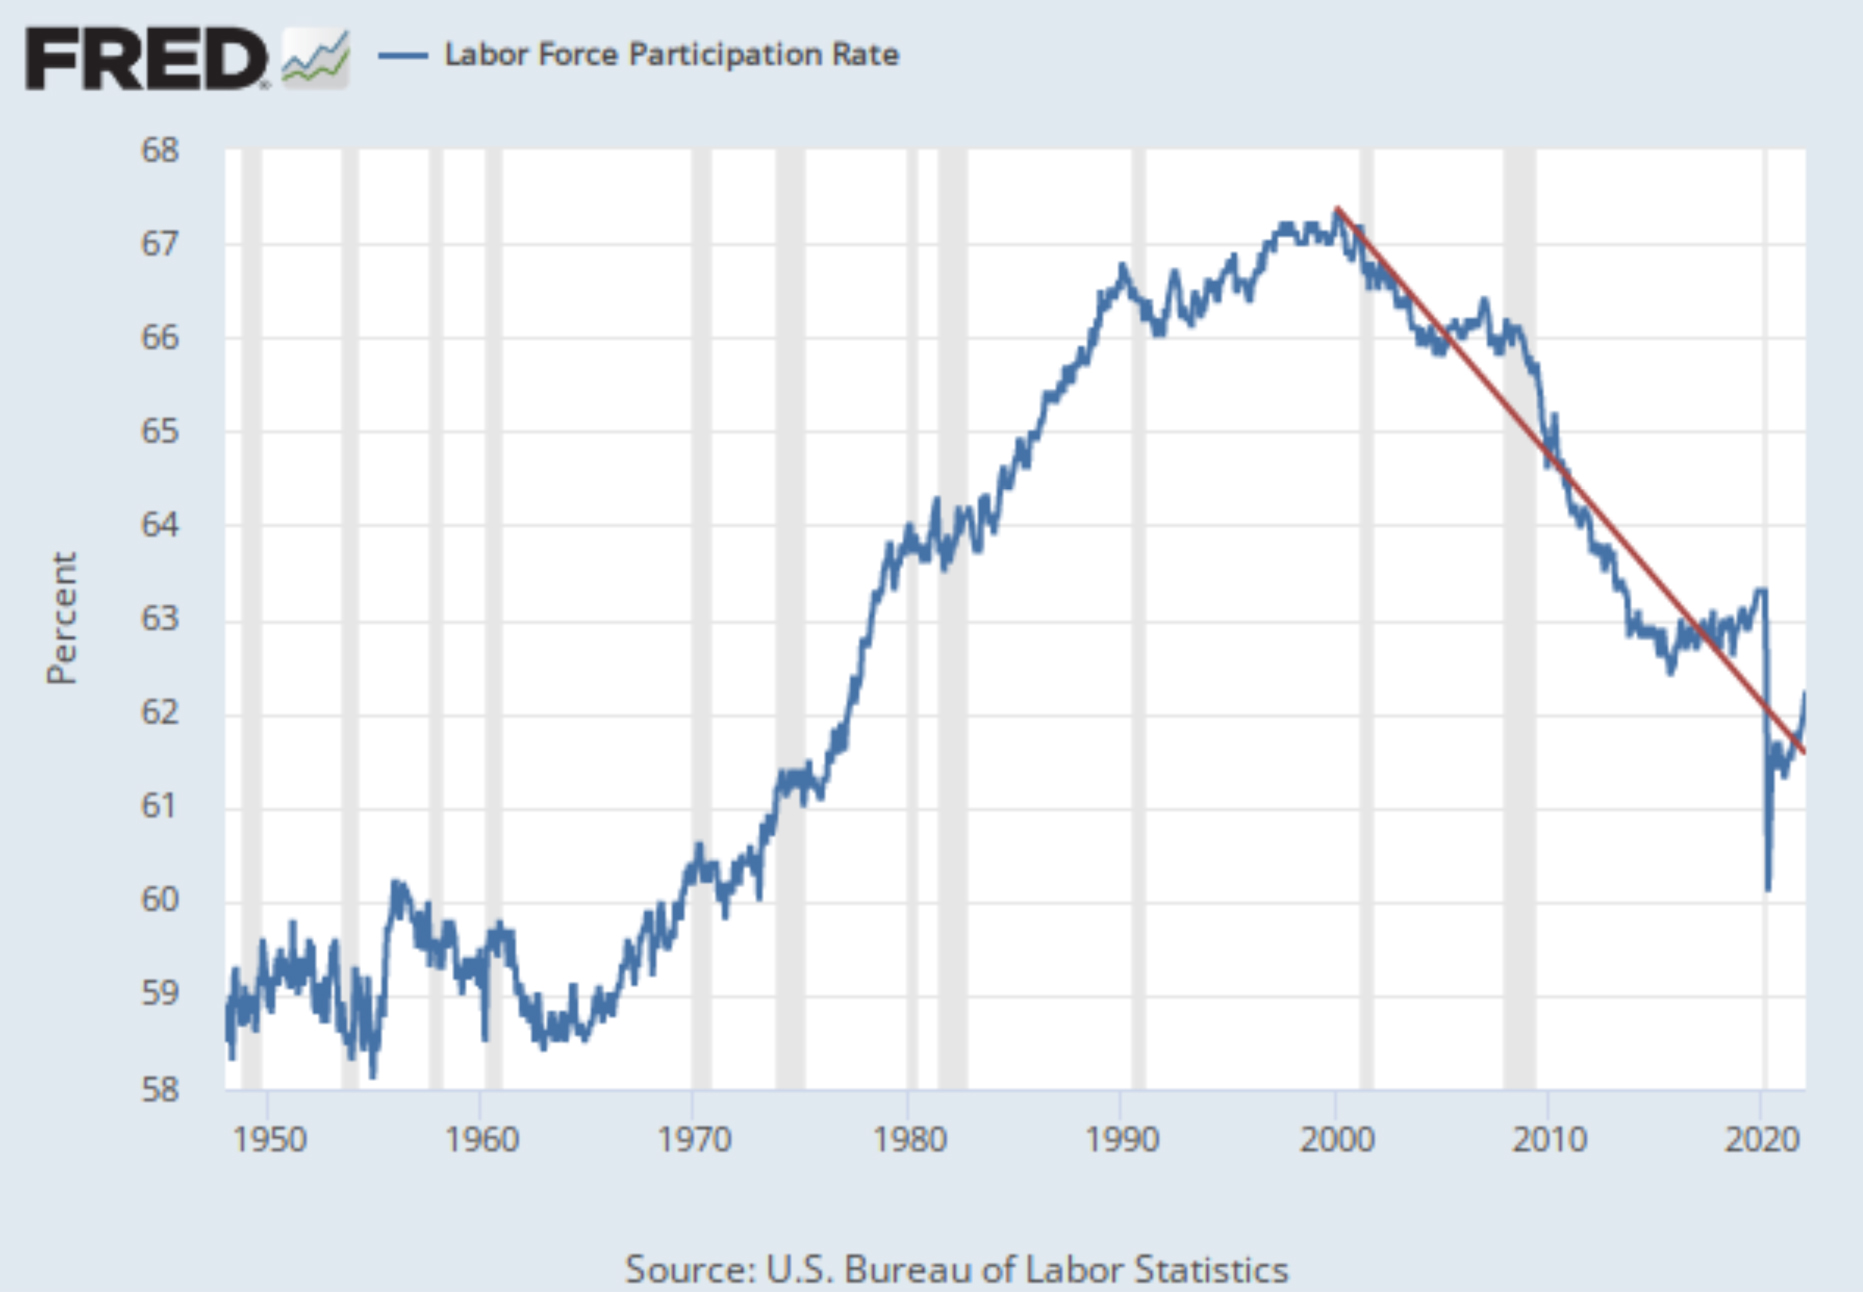
We can’t lay everything at the feet of Obama bin Laden and his terrorist ilk, but something turned America around in 2001: We turned from surpluses to debt, high growth to slow growth, and we went on strike:
Graphs are for illustrative and discussion purposes only. Please read important disclosures at the end of this commentary.
OK, we didn’t exactly go on strike, but the percentage of healthy adults of working age participating in the labor force peaked in 2000 and has been going down ever since, particularly since COVID struck.
GDP growth has also been cut in half, on a per-capita basis. After half a century of 3.6% average annual growth, and 2.4% real annual per capita growth, 1950 to 1999, per capita growth was then cut in half:
| Years | GDP per Year | Per Capita |
| 1950-1999 | +3.6% | +2.4% |
| 2000-2022 | +2.0% | +1.2% |
| Crestmont Research (Economy-GDP-R-By-Decade.pdf (crestmontresearch.com) | ||
(Also see: 5-2-23: A Tale of Two Centuries: Growth (1950-99) vs. Debt (2000-23) – Navellier)
We also seem to care less about debts. So far in the 2020s, deficits exceed $9 trillion: $3.132 trillion in fiscal year 2020, $2.776 trillion in 2021, $1.375 trillion in 2022, and approximately $2 trillion in 2023.
This 21st Century experiment in Modern Monetary Theory (MMT) has backfired, as it always does, but big-time, since we are so big. Maybe we could learn some old-time economic religion if somebody could send a copy of Henry Hazlitt’s “Economics in One Lesson” (1946) to the Biden White House, with a second copy to his Press Secretary….and heck, why not 535 more copies to each member of Congress?!

All content above represents the opinion of Gary Alexander of Navellier & Associates, Inc.
Also In This Issue
A Look Ahead by Louis Navellier
Inflation is Rapidly Receding – Except for Energy Prices
Income Mail by Bryan Perry
America Desperately Needs Lower Rates to Pay its Rising Bills
Growth Mail by Gary Alexander
Rising Debt, Fewer Workers and Slower Growth Since 2001 – Why?
Global Mail by Ivan Martchev
Bonds and the Dollar Suggest a Further Correction in Equities
Sector Spotlight by Jason Bodner
The Market Often Surges or Sinks on Misinterpreted Words
View Full Archive
Read Past Issues Here
About The Author

Gary Alexander
SENIOR EDITOR
Gary Alexander has been Senior Writer at Navellier since 2009. He edits Navellier’s weekly Marketmail and writes a weekly Growth Mail column, in which he uses market history to support the case for growth stocks. For the previous 20 years before joining Navellier, he was Senior Executive Editor at InvestorPlace Media (formerly Phillips Publishing), where he worked with several leading investment analysts, including Louis Navellier (since 1997), helping launch Louis Navellier’s Blue Chip Growth and Global Growth newsletters.
Prior to that, Gary edited Wealth Magazine and Gold Newsletter and wrote various investment research reports for Jefferson Financial in New Orleans in the 1980s. He began his financial newsletter career with KCI Communications in 1980, where he served as consulting editor for Personal Finance newsletter while serving as general manager of KCI’s Alexandria House book division. Before that, he covered the economics beat for news magazines. All content of “Growth Mail” represents the opinion of Gary Alexander
Important Disclosures:
Although information in these reports has been obtained from and is based upon sources that Navellier believes to be reliable, Navellier does not guarantee its accuracy and it may be incomplete or condensed. All opinions and estimates constitute Navellier’s judgment as of the date the report was created and are subject to change without notice. These reports are for informational purposes only and are not a solicitation for the purchase or sale of a security. Any decision to purchase securities mentioned in these reports must take into account existing public information on such securities or any registered prospectus.To the extent permitted by law, neither Navellier & Associates, Inc., nor any of its affiliates, agents, or service providers assumes any liability or responsibility nor owes any duty of care for any consequences of any person acting or refraining to act in reliance on the information contained in this communication or for any decision based on it.
Past performance is no indication of future results. Investment in securities involves significant risk and has the potential for partial or complete loss of funds invested. It should not be assumed that any securities recommendations made by Navellier. in the future will be profitable or equal the performance of securities made in this report. Dividend payments are not guaranteed. The amount of a dividend payment, if any, can vary over time and issuers may reduce dividends paid on securities in the event of a recession or adverse event affecting a specific industry or issuer.
None of the stock information, data, and company information presented herein constitutes a recommendation by Navellier or a solicitation to buy or sell any securities. Any specific securities identified and described do not represent all of the securities purchased, sold, or recommended for advisory clients. The holdings identified do not represent all of the securities purchased, sold, or recommended for advisory clients and the reader should not assume that investments in the securities identified and discussed were or will be profitable.
Information presented is general information that does not take into account your individual circumstances, financial situation, or needs, nor does it present a personalized recommendation to you. Individual stocks presented may not be suitable for every investor. Investment in securities involves significant risk and has the potential for partial or complete loss of funds invested. Investment in fixed income securities has the potential for the investment return and principal value of an investment to fluctuate so that an investor’s holdings, when redeemed, may be worth less than their original cost.
One cannot invest directly in an index. Index is unmanaged and index performance does not reflect deduction of fees, expenses, or taxes. Presentation of Index data does not reflect a belief by Navellier that any stock index constitutes an investment alternative to any Navellier equity strategy or is necessarily comparable to such strategies. Among the most important differences between the Indices and Navellier strategies are that the Navellier equity strategies may (1) incur material management fees, (2) concentrate its investments in relatively few stocks, industries, or sectors, (3) have significantly greater trading activity and related costs, and (4) be significantly more or less volatile than the Indices.
ETF Risk: We may invest in exchange traded funds (“ETFs”) and some of our investment strategies are generally fully invested in ETFs. Like traditional mutual funds, ETFs charge asset-based fees, but they generally do not charge initial sales charges or redemption fees and investors typically pay only customary brokerage fees to buy and sell ETF shares. The fees and costs charged by ETFs held in client accounts will not be deducted from the compensation the client pays Navellier. ETF prices can fluctuate up or down, and a client account could lose money investing in an ETF if the prices of the securities owned by the ETF go down. ETFs are subject to additional risks:
- ETF shares may trade above or below their net asset value;
- An active trading market for an ETF’s shares may not develop or be maintained;
- The value of an ETF may be more volatile than the underlying portfolio of securities the ETF is designed to track;
- The cost of owning shares of the ETF may exceed those a client would incur by directly investing in the underlying securities; and
- Trading of an ETF’s shares may be halted if the listing exchange’s officials deem it appropriate, the shares are delisted from the exchange, or the activation of market-wide “circuit breakers” (which are tied to large decreases in stock prices) halts stock trading generally.
Grader Disclosures: Investment in equity strategies involves substantial risk and has the potential for partial or complete loss of funds invested. The sample portfolio and any accompanying charts are for informational purposes only and are not to be construed as a solicitation to buy or sell any financial instrument and should not be relied upon as the sole factor in an investment making decision. As a matter of normal and important disclosures to you, as a potential investor, please consider the following: The performance presented is not based on any actual securities trading, portfolio, or accounts, and the reported performance of the A, B, C, D, and F portfolios (collectively the “model portfolios”) should be considered mere “paper” or pro forma performance results based on Navellier’s research.
Investors evaluating any of Navellier & Associates, Inc.’s, (or its affiliates’) Investment Products must not use any information presented here, including the performance figures of the model portfolios, in their evaluation of any Navellier Investment Products. Navellier Investment Products include the firm’s mutual funds and managed accounts. The model portfolios, charts, and other information presented do not represent actual funded trades and are not actual funded portfolios. There are material differences between Navellier Investment Products’ portfolios and the model portfolios, research, and performance figures presented here. The model portfolios and the research results (1) may contain stocks or ETFs that are illiquid and difficult to trade; (2) may contain stock or ETF holdings materially different from actual funded Navellier Investment Product portfolios; (3) include the reinvestment of all dividends and other earnings, estimated trading costs, commissions, or management fees; and, (4) may not reflect prices obtained in an actual funded Navellier Investment Product portfolio. For these and other reasons, the reported performances of model portfolios do not reflect the performance results of Navellier’s actually funded and traded Investment Products. In most cases, Navellier’s Investment Products have materially lower performance results than the performances of the model portfolios presented.
This report contains statements that are, or may be considered to be, forward-looking statements. All statements that are not historical facts, including statements about our beliefs or expectations, are “forward-looking statements” within the meaning of The U.S. Private Securities Litigation Reform Act of 1995. These statements may be identified by such forward-looking terminology as “expect,” “estimate,” “plan,” “intend,” “believe,” “anticipate,” “may,” “will,” “should,” “could,” “continue,” “project,” or similar statements or variations of such terms. Our forward-looking statements are based on a series of expectations, assumptions, and projections, are not guarantees of future results or performance, and involve substantial risks and uncertainty as described in Form ADV Part 2A of our filing with the Securities and Exchange Commission (SEC), which is available at www.adviserinfo.sec.gov or by requesting a copy by emailing info@navellier.com. All of our forward-looking statements are as of the date of this report only. We can give no assurance that such expectations or forward-looking statements will prove to be correct. Actual results may differ materially. You are urged to carefully consider all such factors.
FEDERAL TAX ADVICE DISCLAIMER: As required by U.S. Treasury Regulations, you are informed that, to the extent this presentation includes any federal tax advice, the presentation is not written by Navellier to be used, and cannot be used, for the purpose of avoiding federal tax penalties. Navellier does not advise on any income tax requirements or issues. Use of any information presented by Navellier is for general information only and does not represent tax advice either express or implied. You are encouraged to seek professional tax advice for income tax questions and assistance.
IMPORTANT NEWSLETTER DISCLOSURE:The hypothetical performance results for investment newsletters that are authored or edited by Louis Navellier, including Louis Navellier’s Growth Investor, Louis Navellier’s Breakthrough Stocks, Louis Navellier’s Accelerated Profits, and Louis Navellier’s Platinum Club, are not based on any actual securities trading, portfolio, or accounts, and the newsletters’ reported hypothetical performances should be considered mere “paper” or proforma hypothetical performance results and are not actual performance of real world trades. Navellier & Associates, Inc. does not have any relation to or affiliation with the owner of these newsletters. There are material differences between Navellier Investment Products’ portfolios and the InvestorPlace Media, LLC newsletter portfolios authored by Louis Navellier. The InvestorPlace Media, LLC newsletters contain hypothetical performance that do not include transaction costs, advisory fees, or other fees a client might incur if actual investments and trades were being made by an investor. As a result, newsletter performance should not be used to evaluate Navellier Investment services which are separate and different from the newsletters. The owner of the newsletters is InvestorPlace Media, LLC and any questions concerning the newsletters, including any newsletter advertising or hypothetical Newsletter performance claims, (which are calculated solely by Investor Place Media and not Navellier) should be referred to InvestorPlace Media, LLC at (800) 718-8289.
Please note that Navellier & Associates and the Navellier Private Client Group are managed completely independent of the newsletters owned and published by InvestorPlace Media, LLC and written and edited by Louis Navellier, and investment performance of the newsletters should in no way be considered indicative of potential future investment performance for any Navellier & Associates separately managed account portfolio. Potential investors should consult with their financial advisor before investing in any Navellier Investment Product.
Navellier claims compliance with Global Investment Performance Standards (GIPS). To receive a complete list and descriptions of Navellier’s composites and/or a presentation that adheres to the GIPS standards, please contact Navellier or click here. It should not be assumed that any securities recommendations made by Navellier & Associates, Inc. in the future will be profitable or equal the performance of securities made in this report.
FactSet Disclosure: Navellier does not independently calculate the statistical information included in the attached report. The calculation and the information are provided by FactSet, a company not related to Navellier. Although information contained in the report has been obtained from FactSet and is based on sources Navellier believes to be reliable, Navellier does not guarantee its accuracy, and it may be incomplete or condensed. The report and the related FactSet sourced information are provided on an “as is” basis. The user assumes the entire risk of any use made of this information. Investors should consider the report as only a single factor in making their investment decision. The report is for informational purposes only and is not intended as an offer or solicitation for the purchase or sale of a security. FactSet sourced information is the exclusive property of FactSet. Without prior written permission of FactSet, this information may not be reproduced, disseminated or used to create any financial products. All indices are unmanaged and performance of the indices include reinvestment of dividends and interest income, unless otherwise noted, are not illustrative of any particular investment and an investment cannot be made in any index. Past performance is no guarantee of future results.