by Gary Alexander
August 15, 2023
What is it about the first week of August in the third year of a Biden/Obama first term that causes the bond rating agencies to lose their patience with trillion-dollar annual deficits as far as the eye can see?
And why did the first downgrade (2011) shock the investing world to its heels – with a 20% S&P 500 summer swoon, and a 25% surge in gold – while the 2023 downgrade caused nary a budge in either gold or stocks – even though the debt numbers have doubled, while inflation and interest rates have tripled?
There’s a parallel script in the cause of the downgrades, but a total yawner when it comes to the sequel.
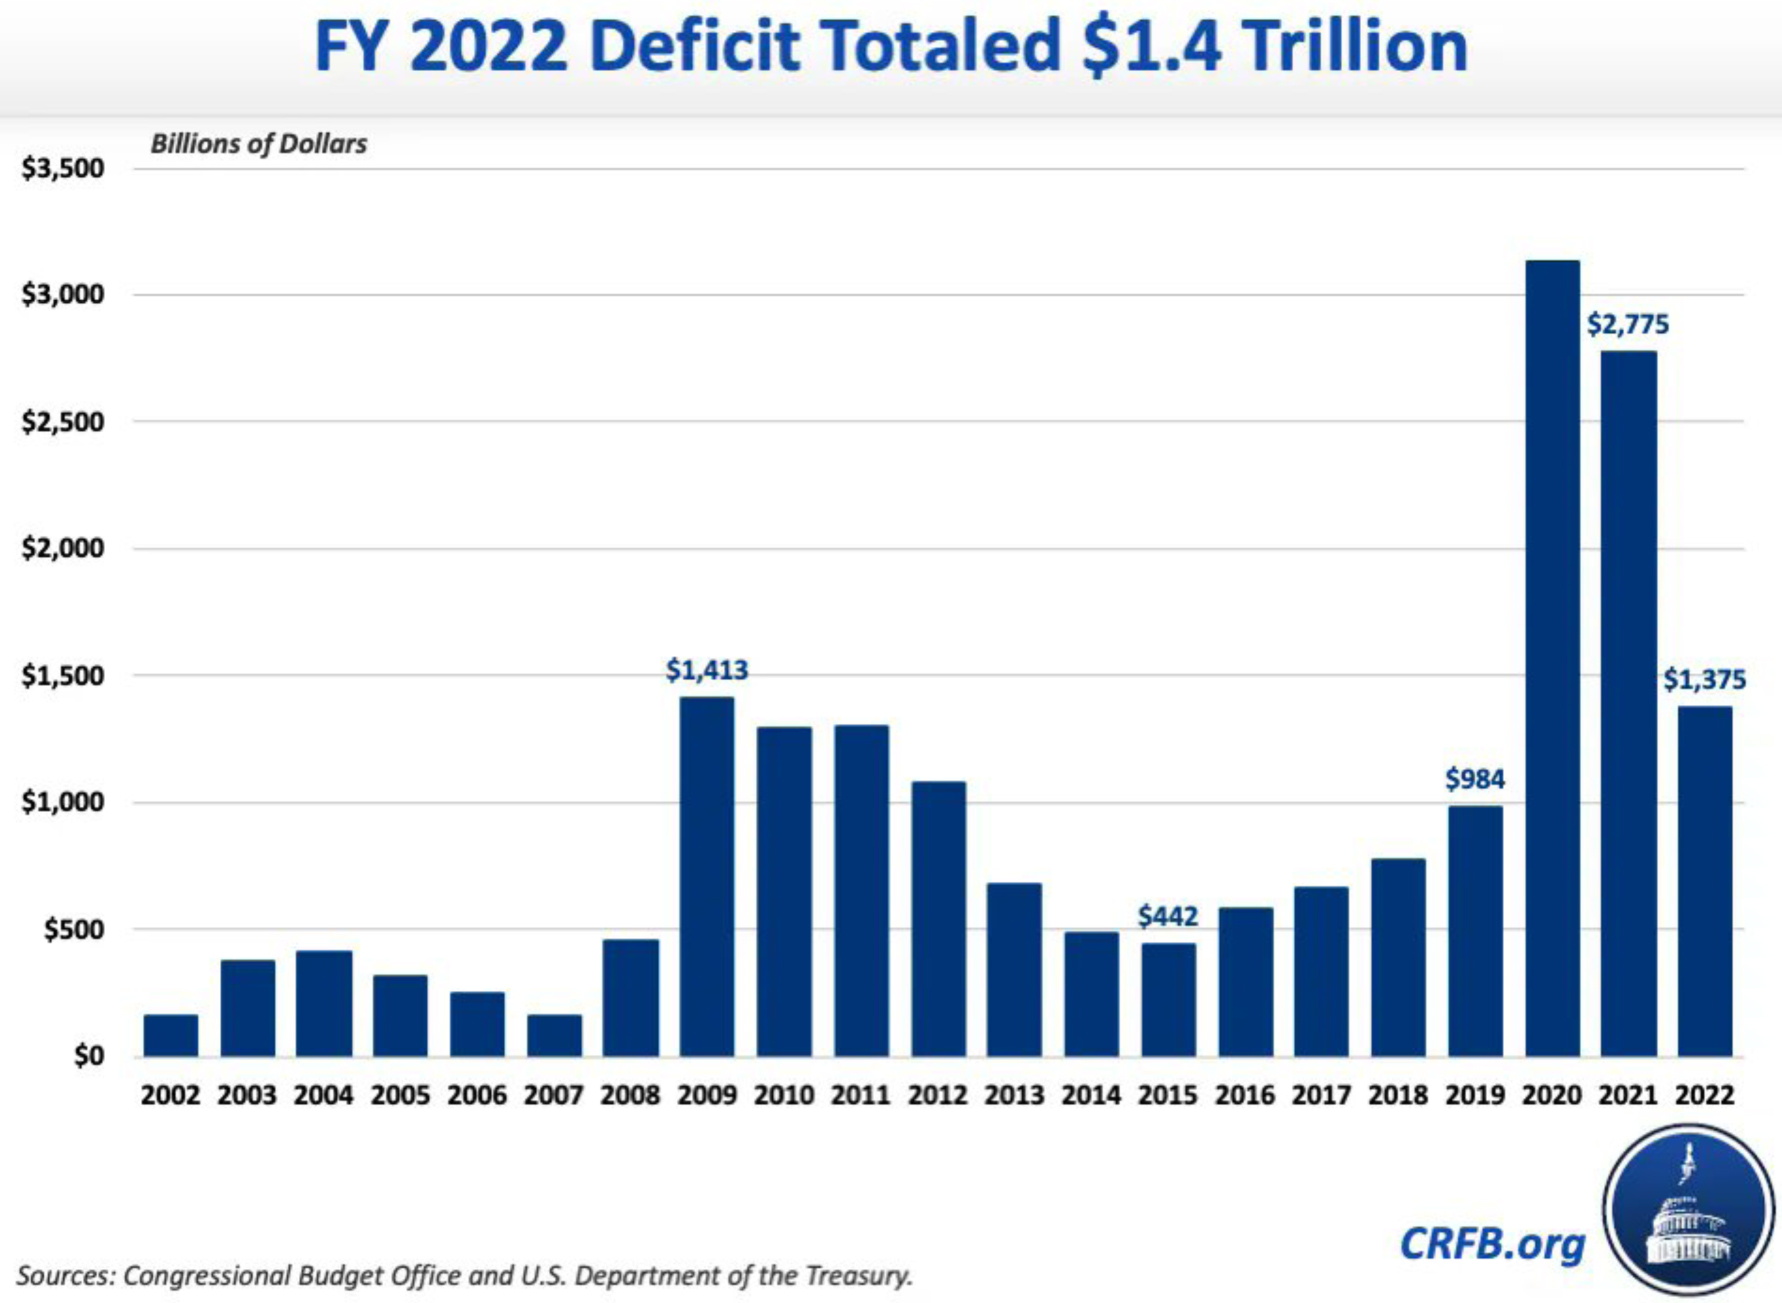
There were eight trillion-dollar deficits in U.S. history: The first four were in President Obama’s first term (2009 to 2012) and the second four were in the COVID years, 2020 to 2023, mostly under Biden. This year, the CBO estimates the deficit will reach $1.7 trillion, and it is already at $1.6 trillion as of July 31.
“The federal budget deficit was $1.6 trillion in the first 10 months of fiscal year 2023, the Congressional Budget Office estimates—more than twice the shortfall recorded during the same period last year.”
– Congressional Budget Office Monthly Review, August 8, 2023
Graphs are for illustrative and discussion purposes only. Please read important disclosures at the end of this commentary.
Both Obama and Biden took a crisis and used it as a Hall Pass to spend on every dream they ever had. It was Obama’s chief of staff, Rahm Emanuel, who said, “You never want a serious crisis to go to waste. And what I mean by that is an opportunity to do things that you think you could not do before.” Obama used the 2008 financial crisis and Biden used the Covid crisis, both on the wane, to spend way too much.
Within a month of taking office, Obama and his rubber-stamp Congress passed the American Recovery and Reinvestment Act (ARRA) on February 17, 2009, tagged as “$787 billion in shovel-ready jobs,” but the jobs were nowhere near shovels and the price tag reached $831 billion. Then came his “cash for clunkers,” killing the used car market, and his pet plan, Obamacare, “the Affordable Care Act,” passing March 23, 2010. His first (2009) deficit was $1.4 trillion, almost $1 trillion more than the 2008 deficit.
In retrospect, President Obama, Fed Chair Ben Bernanke, and Treasury Secretary Tim Geithner gave VP Joe Biden a blueprint for how to front-load spending in a first term. “Helicopter Ben” Bernanke promised to throw money from helicopters, if needed, in order to avoid a deflationary depression. He lived up to those words with three major rounds of quantitative easing, plus five years of 0% interest. Gold soared to new record highs. Gold tends to grade our leaders and the dollar. Gold was $564 when Bernanke took office on February 1, 2006. Gold tripled during Ben’s first five years, to over $1,800 in August 2011.
In November 2010, voters staged a Tea Party rebellion, reversing a 63-seat Democratic majority in the House to create a 63-seat Republican majority – a 126-seat swing, in what Charles Krauthammer called (in our political panel in New Orleans that year) “a restraining order” on Obama’s spending plans. That led to some ferocious debates over the debt ceiling the next summer and the fateful first debt downgrade.
What Happened Before and After the First Debt Downgrade
Here’s a blow-by-blow account of what happened just before and after the 2011 debt downgrade:
- On Tuesday, August 2, 2011, Congress ended its month-long highly contentious debt-ceiling debate when President Obama signed the Budget Control Act of 2011. The Dow fell 265.87 that day. Then, the Dow fell another 512.76 points on Thursday, August 4. The cause of the second decline was fear that Standard & Poor’s would downgrade America’s credit rating, and the market was on the money!
- Sure enough, S&P downgraded U.S. debt after the market closed on Friday, August 5. Even though that move was widely anticipated by then, the market went on a bizarre manic-depressive binge the next week. From August 8 to 11, the Dow rose or fell 423 points or more on four straight days!
-
A Manic-Depressive Market, August 8-11, 2011 Monday, August 8 Down 644.76 points Tuesday, August 9 Up 429.92 points Wednesday, August 10 Down 519.83 points Thursday, August 11 Up 423.37 points Source: Yahoo! Finance - On Meet the Press Sunday, August 7, former chairman Alan Greenspan said, “The United States can pay any debt it has because we can always print money to do that.” Gold and stocks sneered at him. The previous Friday, gold closed at $1,659. On Monday, gold hit $1,710 and the Dow fell 645 points.
- On August 9, when Chairman Bernanke said the Fed would keep rates near zero until at least 2013, gold soared to $1,818 the next day, causing such a gold bidding furor that COMEX had to raise the margin requirements by 22% in order to slow down gold’s rapid surge to new record highs.
Markets quickly recovered. The dollar did not die. The economy went on a 9-year surge, as did the stock market, after the debt downgrade. On August 1, 2011, the euro traded at a lofty $1.426. A year later, the euro traded at just under $1.23, after touching $1.20, when Mario Draghi, head of the European Central Bank (ECB), said that he would do “whatever it takes” to protect the falling euro. Also, the U.S. stock market basically had a phenomenal 8-year surge until a Wuhan-based China bug infected markets.
America, despite the 2011 downgrade, whipped the rest of the world in stock market returns, 2010-2020.
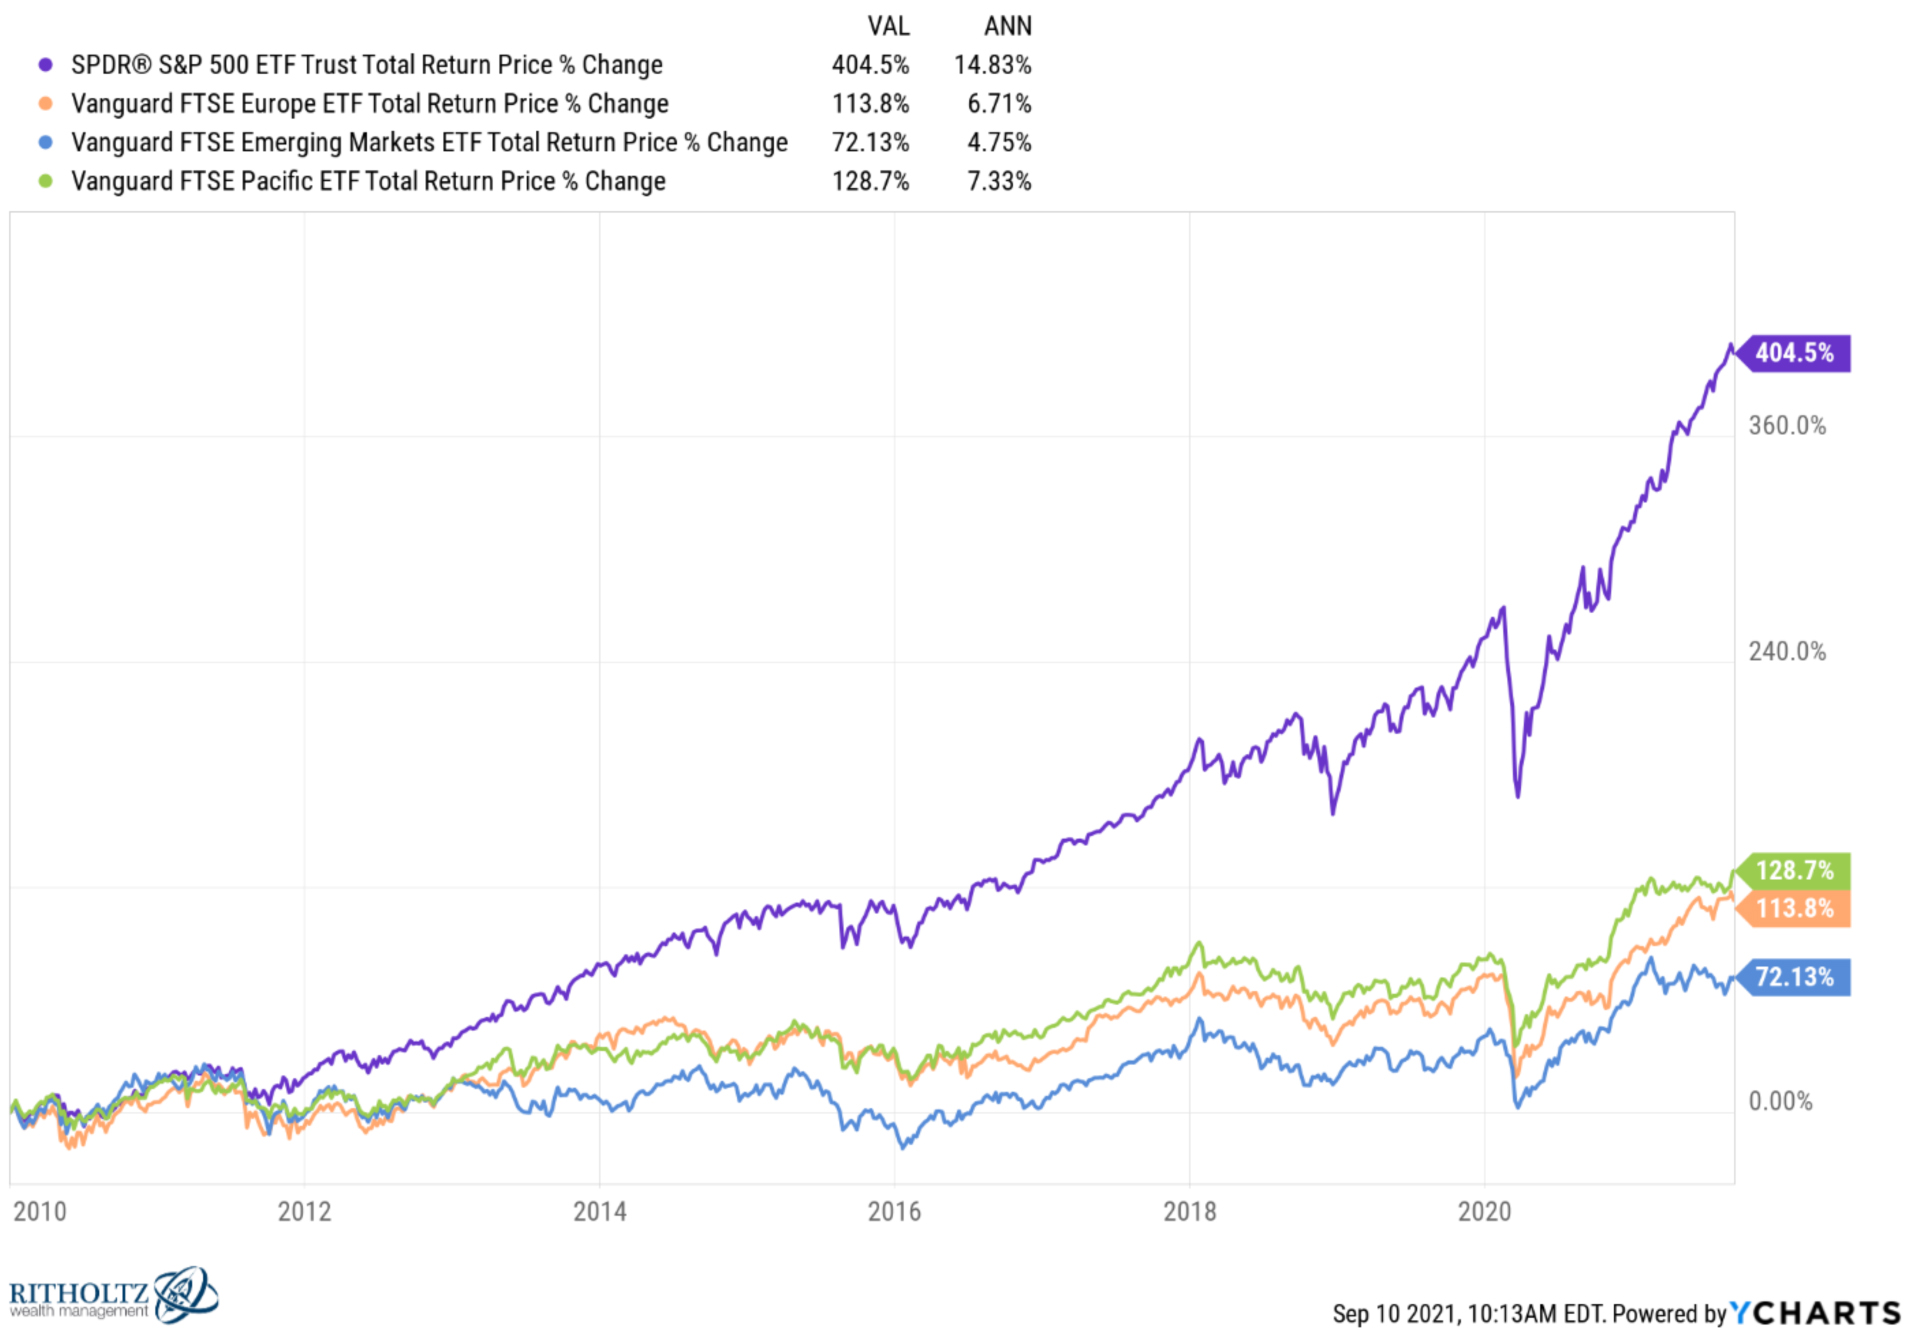
Graphs are for illustrative and discussion purposes only. Please read important disclosures at the end of this commentary.
Is this why the market yawned after Fitch’s debt downgrade in 2023? “Life goes on; the market will rise.”
Why No Big Reaction to the 2023 Fitch Downgrade?
Ten days after Fitch downgraded U.S. debt by the same single notch (AAA to AA+) on August 1, 2023, the S&P is down 2.7%, and gold is also down 3%, reflecting no great fear for the economy or the dollar. The 10-year bond rate rose immediately, but as of last Thursday, August 10, it was unchanged at 3.95%.
All of that qualifies as one big yawn, especially compared to the massive over-reactions of August 2011.
The answer, I think, lies in We the People, the voters. There was no Tea Party Revolution of 2022 against Biden’s massive overspending in 2021-22 – like Obama’s first two years. There was no restraining order to Bidenomics in 2022, no outrage over 9% inflation rates. There was only a 17-seat swing in the House and no switch in the Senate, a faint echo of the outrage that greeted Obama’s overspending in 2009-10.
This points to major problems in 2024. If America can’t see fit to nominate younger and more courageous Presidential candidates than the aging and divisive 2020 pair, and a Congress willing to cut spending instead of inventing new and ever more unrealistic spending promises, a third debt downgrade may ensue.
All content above represents the opinion of Gary Alexander of Navellier & Associates, Inc.
Also In This Issue
A Look Ahead by Louis Navellier
China May Soon Export its Deflation Worldwide
Income Mail by Bryan Perry
It’s A Rough Path – But Is Inflation Coming Down?
Growth Mail by Gary Alexander
A Tale of Two Downgrades – A Bang (2011) and a Whimper (2023)
Global Mail by Ivan Martchev
Watch the Bond Market for Stock Market Clues
Sector Spotlight by Jason Bodner
The Stock Market Seasons are Unfolding as Predicted
View Full Archive
Read Past Issues Here
About The Author

Gary Alexander
SENIOR EDITOR
Gary Alexander has been Senior Writer at Navellier since 2009. He edits Navellier’s weekly Marketmail and writes a weekly Growth Mail column, in which he uses market history to support the case for growth stocks. For the previous 20 years before joining Navellier, he was Senior Executive Editor at InvestorPlace Media (formerly Phillips Publishing), where he worked with several leading investment analysts, including Louis Navellier (since 1997), helping launch Louis Navellier’s Blue Chip Growth and Global Growth newsletters.
Prior to that, Gary edited Wealth Magazine and Gold Newsletter and wrote various investment research reports for Jefferson Financial in New Orleans in the 1980s. He began his financial newsletter career with KCI Communications in 1980, where he served as consulting editor for Personal Finance newsletter while serving as general manager of KCI’s Alexandria House book division. Before that, he covered the economics beat for news magazines. All content of “Growth Mail” represents the opinion of Gary Alexander
Important Disclosures:
Although information in these reports has been obtained from and is based upon sources that Navellier believes to be reliable, Navellier does not guarantee its accuracy and it may be incomplete or condensed. All opinions and estimates constitute Navellier’s judgment as of the date the report was created and are subject to change without notice. These reports are for informational purposes only and are not a solicitation for the purchase or sale of a security. Any decision to purchase securities mentioned in these reports must take into account existing public information on such securities or any registered prospectus.To the extent permitted by law, neither Navellier & Associates, Inc., nor any of its affiliates, agents, or service providers assumes any liability or responsibility nor owes any duty of care for any consequences of any person acting or refraining to act in reliance on the information contained in this communication or for any decision based on it.
Past performance is no indication of future results. Investment in securities involves significant risk and has the potential for partial or complete loss of funds invested. It should not be assumed that any securities recommendations made by Navellier. in the future will be profitable or equal the performance of securities made in this report. Dividend payments are not guaranteed. The amount of a dividend payment, if any, can vary over time and issuers may reduce dividends paid on securities in the event of a recession or adverse event affecting a specific industry or issuer.
None of the stock information, data, and company information presented herein constitutes a recommendation by Navellier or a solicitation to buy or sell any securities. Any specific securities identified and described do not represent all of the securities purchased, sold, or recommended for advisory clients. The holdings identified do not represent all of the securities purchased, sold, or recommended for advisory clients and the reader should not assume that investments in the securities identified and discussed were or will be profitable.
Information presented is general information that does not take into account your individual circumstances, financial situation, or needs, nor does it present a personalized recommendation to you. Individual stocks presented may not be suitable for every investor. Investment in securities involves significant risk and has the potential for partial or complete loss of funds invested. Investment in fixed income securities has the potential for the investment return and principal value of an investment to fluctuate so that an investor’s holdings, when redeemed, may be worth less than their original cost.
One cannot invest directly in an index. Index is unmanaged and index performance does not reflect deduction of fees, expenses, or taxes. Presentation of Index data does not reflect a belief by Navellier that any stock index constitutes an investment alternative to any Navellier equity strategy or is necessarily comparable to such strategies. Among the most important differences between the Indices and Navellier strategies are that the Navellier equity strategies may (1) incur material management fees, (2) concentrate its investments in relatively few stocks, industries, or sectors, (3) have significantly greater trading activity and related costs, and (4) be significantly more or less volatile than the Indices.
ETF Risk: We may invest in exchange traded funds (“ETFs”) and some of our investment strategies are generally fully invested in ETFs. Like traditional mutual funds, ETFs charge asset-based fees, but they generally do not charge initial sales charges or redemption fees and investors typically pay only customary brokerage fees to buy and sell ETF shares. The fees and costs charged by ETFs held in client accounts will not be deducted from the compensation the client pays Navellier. ETF prices can fluctuate up or down, and a client account could lose money investing in an ETF if the prices of the securities owned by the ETF go down. ETFs are subject to additional risks:
- ETF shares may trade above or below their net asset value;
- An active trading market for an ETF’s shares may not develop or be maintained;
- The value of an ETF may be more volatile than the underlying portfolio of securities the ETF is designed to track;
- The cost of owning shares of the ETF may exceed those a client would incur by directly investing in the underlying securities; and
- Trading of an ETF’s shares may be halted if the listing exchange’s officials deem it appropriate, the shares are delisted from the exchange, or the activation of market-wide “circuit breakers” (which are tied to large decreases in stock prices) halts stock trading generally.
Grader Disclosures: Investment in equity strategies involves substantial risk and has the potential for partial or complete loss of funds invested. The sample portfolio and any accompanying charts are for informational purposes only and are not to be construed as a solicitation to buy or sell any financial instrument and should not be relied upon as the sole factor in an investment making decision. As a matter of normal and important disclosures to you, as a potential investor, please consider the following: The performance presented is not based on any actual securities trading, portfolio, or accounts, and the reported performance of the A, B, C, D, and F portfolios (collectively the “model portfolios”) should be considered mere “paper” or pro forma performance results based on Navellier’s research.
Investors evaluating any of Navellier & Associates, Inc.’s, (or its affiliates’) Investment Products must not use any information presented here, including the performance figures of the model portfolios, in their evaluation of any Navellier Investment Products. Navellier Investment Products include the firm’s mutual funds and managed accounts. The model portfolios, charts, and other information presented do not represent actual funded trades and are not actual funded portfolios. There are material differences between Navellier Investment Products’ portfolios and the model portfolios, research, and performance figures presented here. The model portfolios and the research results (1) may contain stocks or ETFs that are illiquid and difficult to trade; (2) may contain stock or ETF holdings materially different from actual funded Navellier Investment Product portfolios; (3) include the reinvestment of all dividends and other earnings, estimated trading costs, commissions, or management fees; and, (4) may not reflect prices obtained in an actual funded Navellier Investment Product portfolio. For these and other reasons, the reported performances of model portfolios do not reflect the performance results of Navellier’s actually funded and traded Investment Products. In most cases, Navellier’s Investment Products have materially lower performance results than the performances of the model portfolios presented.
This report contains statements that are, or may be considered to be, forward-looking statements. All statements that are not historical facts, including statements about our beliefs or expectations, are “forward-looking statements” within the meaning of The U.S. Private Securities Litigation Reform Act of 1995. These statements may be identified by such forward-looking terminology as “expect,” “estimate,” “plan,” “intend,” “believe,” “anticipate,” “may,” “will,” “should,” “could,” “continue,” “project,” or similar statements or variations of such terms. Our forward-looking statements are based on a series of expectations, assumptions, and projections, are not guarantees of future results or performance, and involve substantial risks and uncertainty as described in Form ADV Part 2A of our filing with the Securities and Exchange Commission (SEC), which is available at www.adviserinfo.sec.gov or by requesting a copy by emailing info@navellier.com. All of our forward-looking statements are as of the date of this report only. We can give no assurance that such expectations or forward-looking statements will prove to be correct. Actual results may differ materially. You are urged to carefully consider all such factors.
FEDERAL TAX ADVICE DISCLAIMER: As required by U.S. Treasury Regulations, you are informed that, to the extent this presentation includes any federal tax advice, the presentation is not written by Navellier to be used, and cannot be used, for the purpose of avoiding federal tax penalties. Navellier does not advise on any income tax requirements or issues. Use of any information presented by Navellier is for general information only and does not represent tax advice either express or implied. You are encouraged to seek professional tax advice for income tax questions and assistance.
IMPORTANT NEWSLETTER DISCLOSURE:The hypothetical performance results for investment newsletters that are authored or edited by Louis Navellier, including Louis Navellier’s Growth Investor, Louis Navellier’s Breakthrough Stocks, Louis Navellier’s Accelerated Profits, and Louis Navellier’s Platinum Club, are not based on any actual securities trading, portfolio, or accounts, and the newsletters’ reported hypothetical performances should be considered mere “paper” or proforma hypothetical performance results and are not actual performance of real world trades. Navellier & Associates, Inc. does not have any relation to or affiliation with the owner of these newsletters. There are material differences between Navellier Investment Products’ portfolios and the InvestorPlace Media, LLC newsletter portfolios authored by Louis Navellier. The InvestorPlace Media, LLC newsletters contain hypothetical performance that do not include transaction costs, advisory fees, or other fees a client might incur if actual investments and trades were being made by an investor. As a result, newsletter performance should not be used to evaluate Navellier Investment services which are separate and different from the newsletters. The owner of the newsletters is InvestorPlace Media, LLC and any questions concerning the newsletters, including any newsletter advertising or hypothetical Newsletter performance claims, (which are calculated solely by Investor Place Media and not Navellier) should be referred to InvestorPlace Media, LLC at (800) 718-8289.
Please note that Navellier & Associates and the Navellier Private Client Group are managed completely independent of the newsletters owned and published by InvestorPlace Media, LLC and written and edited by Louis Navellier, and investment performance of the newsletters should in no way be considered indicative of potential future investment performance for any Navellier & Associates separately managed account portfolio. Potential investors should consult with their financial advisor before investing in any Navellier Investment Product.
Navellier claims compliance with Global Investment Performance Standards (GIPS). To receive a complete list and descriptions of Navellier’s composites and/or a presentation that adheres to the GIPS standards, please contact Navellier or click here. It should not be assumed that any securities recommendations made by Navellier & Associates, Inc. in the future will be profitable or equal the performance of securities made in this report.
FactSet Disclosure: Navellier does not independently calculate the statistical information included in the attached report. The calculation and the information are provided by FactSet, a company not related to Navellier. Although information contained in the report has been obtained from FactSet and is based on sources Navellier believes to be reliable, Navellier does not guarantee its accuracy, and it may be incomplete or condensed. The report and the related FactSet sourced information are provided on an “as is” basis. The user assumes the entire risk of any use made of this information. Investors should consider the report as only a single factor in making their investment decision. The report is for informational purposes only and is not intended as an offer or solicitation for the purchase or sale of a security. FactSet sourced information is the exclusive property of FactSet. Without prior written permission of FactSet, this information may not be reproduced, disseminated or used to create any financial products. All indices are unmanaged and performance of the indices include reinvestment of dividends and interest income, unless otherwise noted, are not illustrative of any particular investment and an investment cannot be made in any index. Past performance is no guarantee of future results.