by Jason Bodner
September 19, 2023
Everything is in interpretation. One great example of this is when Kentucky Fried Chicken started expanding to China in the 1980s. They tried in earnest for a literal translation to Mandarin of their famous slogan: “It’s Finger Lickin’ Good!”, but instead it came out more like “Eat Your Fingers Off!”
That doesn’t exactly scream ‘delicious’ … well unless you’re a cannibal. My point is that two different perspectives can interpret the same data with two different meanings. Stock market analysis is the same. Oftentimes the mainstream hears “Eat Your Fingers Off!” when I am hearing “Finger Lickin’ Good!”
I’ve harped on the media’s penchant for doom and gloom so often that I must sound like I’m constantly repeating himself. I may sound like a broken record, but I don’t really blame the media. We humans are a funny breed – we’re attracted to negative stories because counterintuitively, it makes us feel better about ourselves. Since the 1850s, Germans called this Schadenfreude, literally finding joy in others’ misfortune.
Spewing negative stories serves a purpose, though – to help advertisers sell us countless products and services. The news makes money by selling advertising, and advertisers pay for slots where more eyeballs see their ads. Sadly, happy stories don’t draw viewers the way tragedy and terror do.
Long ago, I realized that to understand markets and investor psychology, I must cut through the noise of media and spin, and analytically decipher objective data. That’s why I developed quantitative systems to help view market action without bias. This is done through the lens of unusual, outsized trading activity.
Our current news cycle is dominated by hurricanes, auto-union strikes, political scandal, inflation, war, and even click-bait headlines like Mexican Congress’ hearings on 1,000 year-old aliens. It’s a drag!
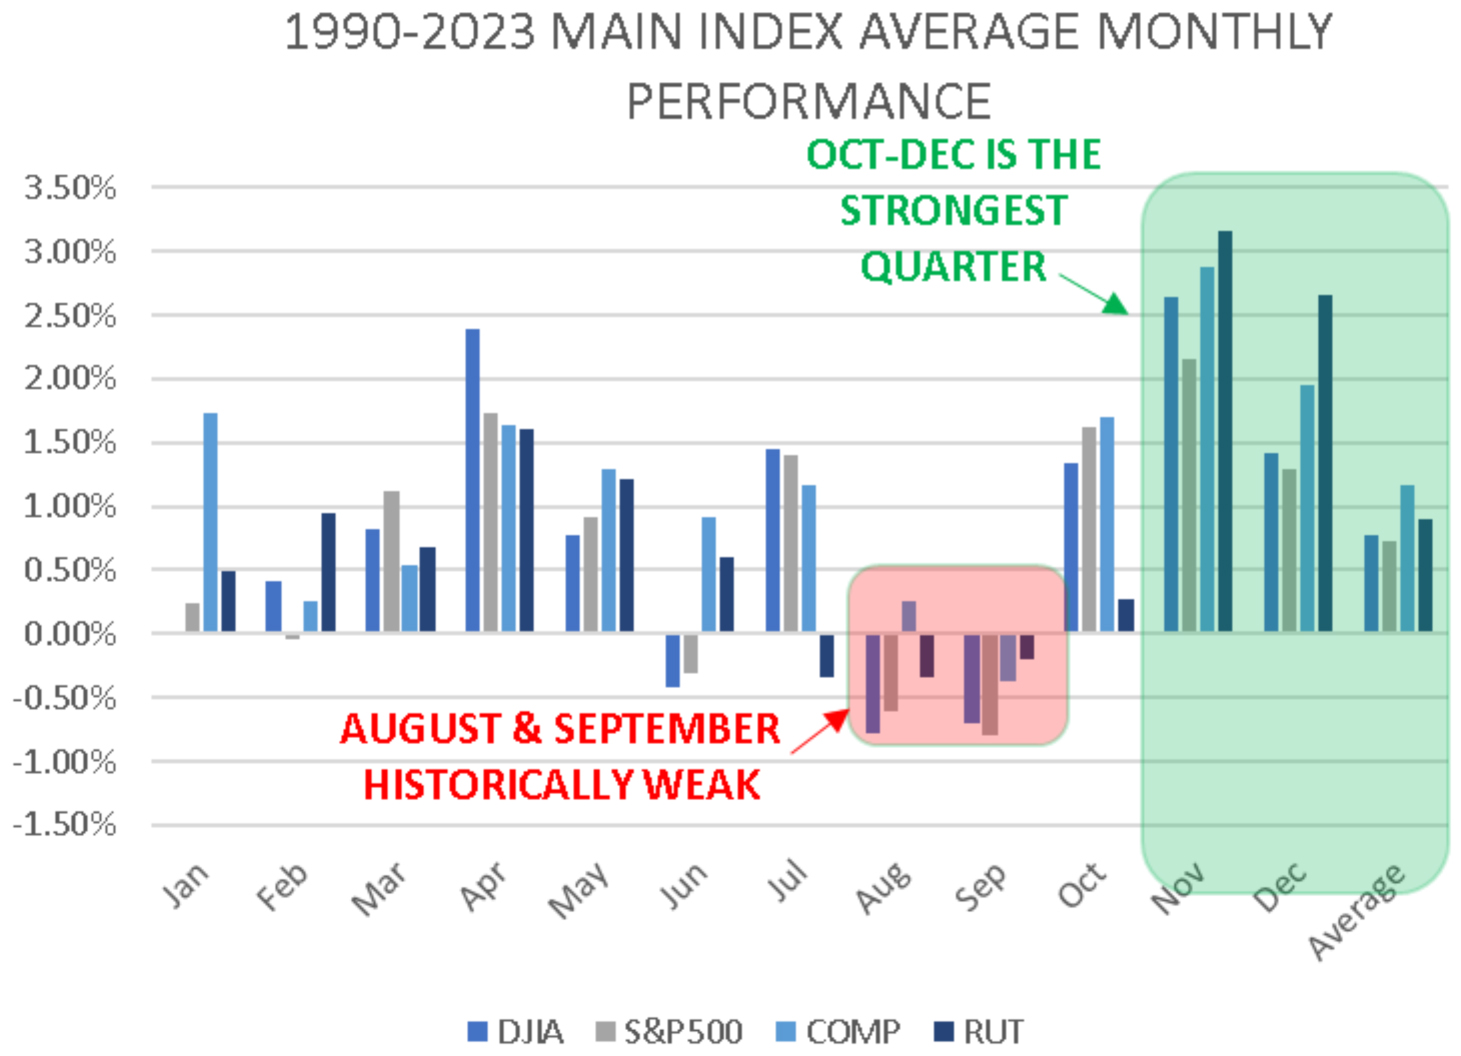
The stock market tuned into the news, with a lame September thus far. Historically speaking, August and September are the worst two months of the year for stocks, so stocks aren’t really underperforming – they’re actually just doing what they usually do. In other words: we must wait out the usual volatility.
The good news is that October through December is historically the strongest time of year for stocks, with substantial positive performance. The major story for investors remains pesky inflation and the difficulty to wrangle it under control. The Fed continually references its long-term goal of 2% inflation as a healthy level. Jerome Powell will surely mention it in his press conference after the FOMC meeting next week.
Let’s look at that for a moment: When Powell speaks, maybe the world hears him saying, “Eat Your Fingers Off,” but I am hearing something else. First, inflation has fallen over 6% from its peak. Currently it sits at 3.7% in the latest reading of the Consumer Price Index. Yes, that’s a meaningful uptick from June’s reading of 3%. But even a shallow look beneath the surface reveals that energy is the main culprit.
Energy commodities, like Gasoline, and Fuel Oil (highlighted in yellow, below) spiked hugely last month:
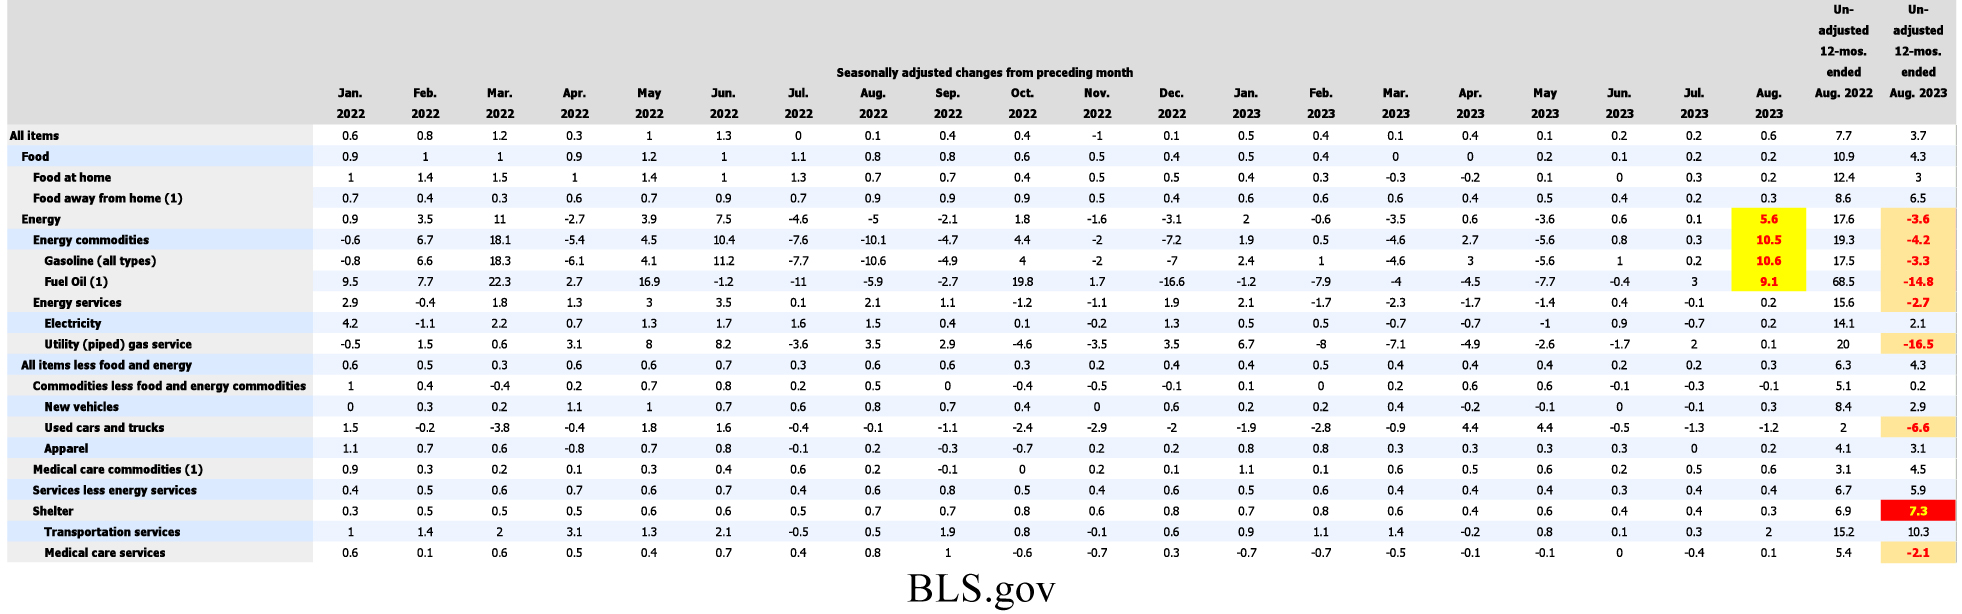
Graphs are for illustrative and discussion purposes only. Please read important disclosures at the end of this commentary.
However, the energy categories (highlighted in amber, above) are still down substantially for the past year. Utilities, used cars and trucks and medical care services are also down for the last 12 months. Energy and food costs are volatile, which is why there is “core” CPI that omits those line items. When energy and food are removed from the equation, all items rose only 0.3% in August.
Now let’s discuss shelter costs. Owners’ Equivalent Rent (OER) is the Fed’s favored metric for housing costs. It is hypothetical rent paid to yourself if you were a landlord. It is deeply flawed, and is essentially fictitious. As pointed out by Economics Professor (emeritus) Robert F. Stauffer of Roanoke College in The Wall Street Journal: No One Pays Owner’s Equivalent Rent: “If the fictional ‘owner equivalent rent’ (OER) were removed from the consumer-price index, the year-over-year inflation rate falls from 3.2% to about 1.5% (for July). The Fed’s preferred measure, the personal-consumption expenditures price index, would decline from 3% to about 2.2%.” This implies that inflation has fallen a lot more than the CPI says.
So, if the CPI for July is arguably lower than the published number, due to OER and volatile energy, then we are potentially below the Fed’s 2% target rate. That 2% target is like “Eating Your Fingers Off” instead of “Finger Lickin’ Good.” I looked at the CPI data since 1960 (from fred.stlouisfed.org) and found that the average CPI reading from 1960 through this year is 3.77%, far higher than 2%. Moreover, the average CPI since rates fell artificially to zero in December of 2008 is 2.32%. So, even when rates were the lowest ever historically, the CPI average was well above the Fed’s target of 2%. We see below that the fed funds target rate is substantially above the latest CPI readings, even with the uptick in energy costs:
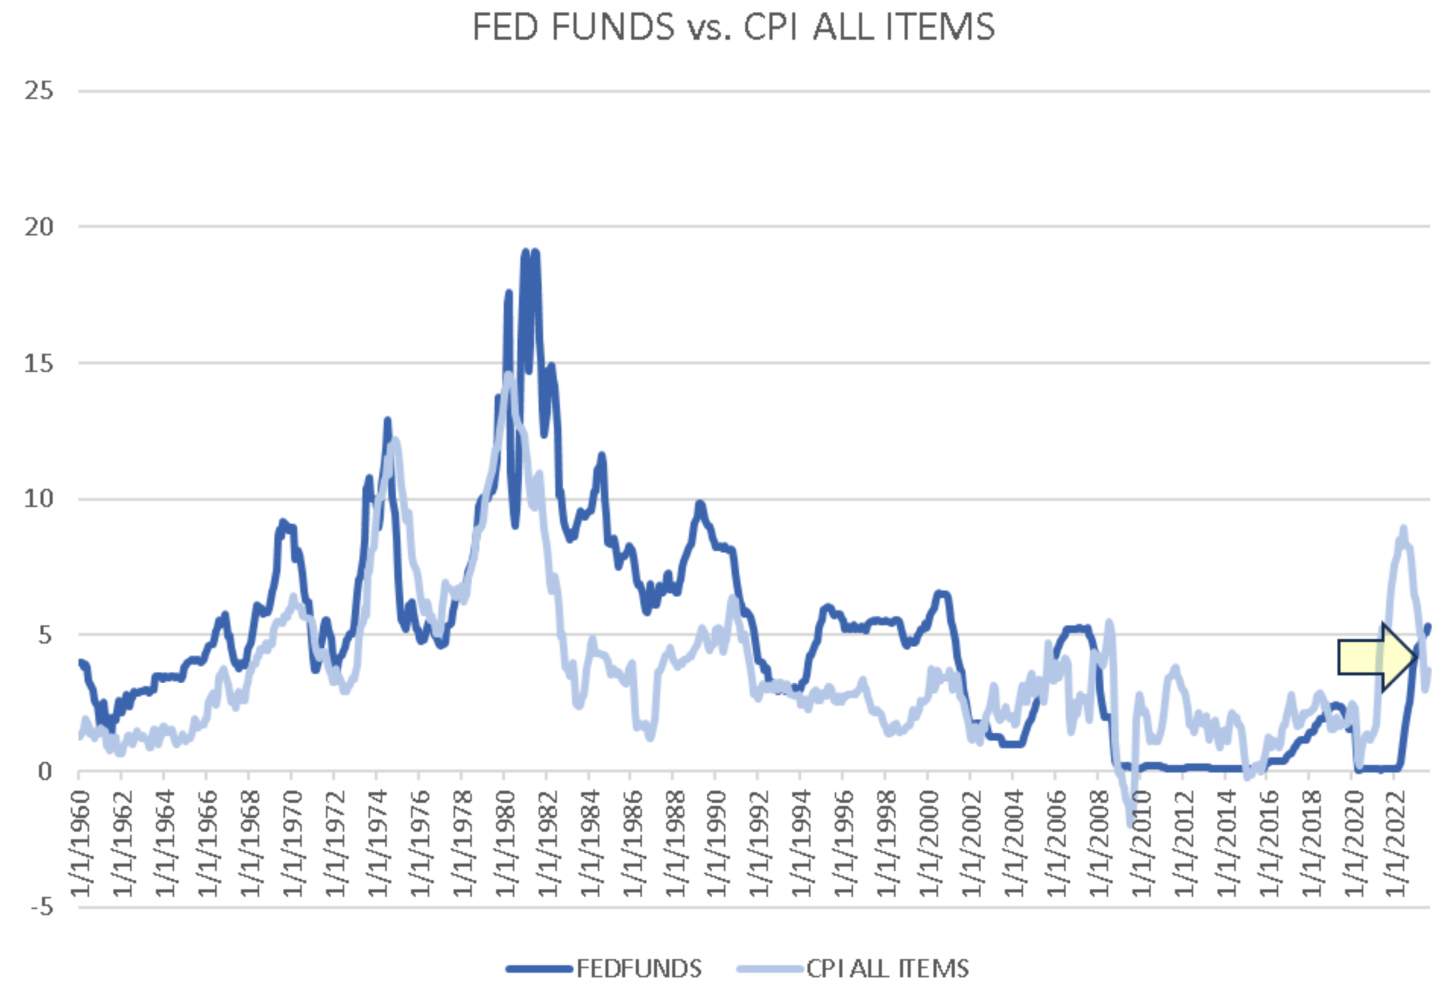
Graphs are for illustrative and discussion purposes only. Please read important disclosures at the end of this commentary.
Make no mistake, the recent energy spike is showing up in unusual buying in stocks, too.
First, we see that energy has risen to the top sector:
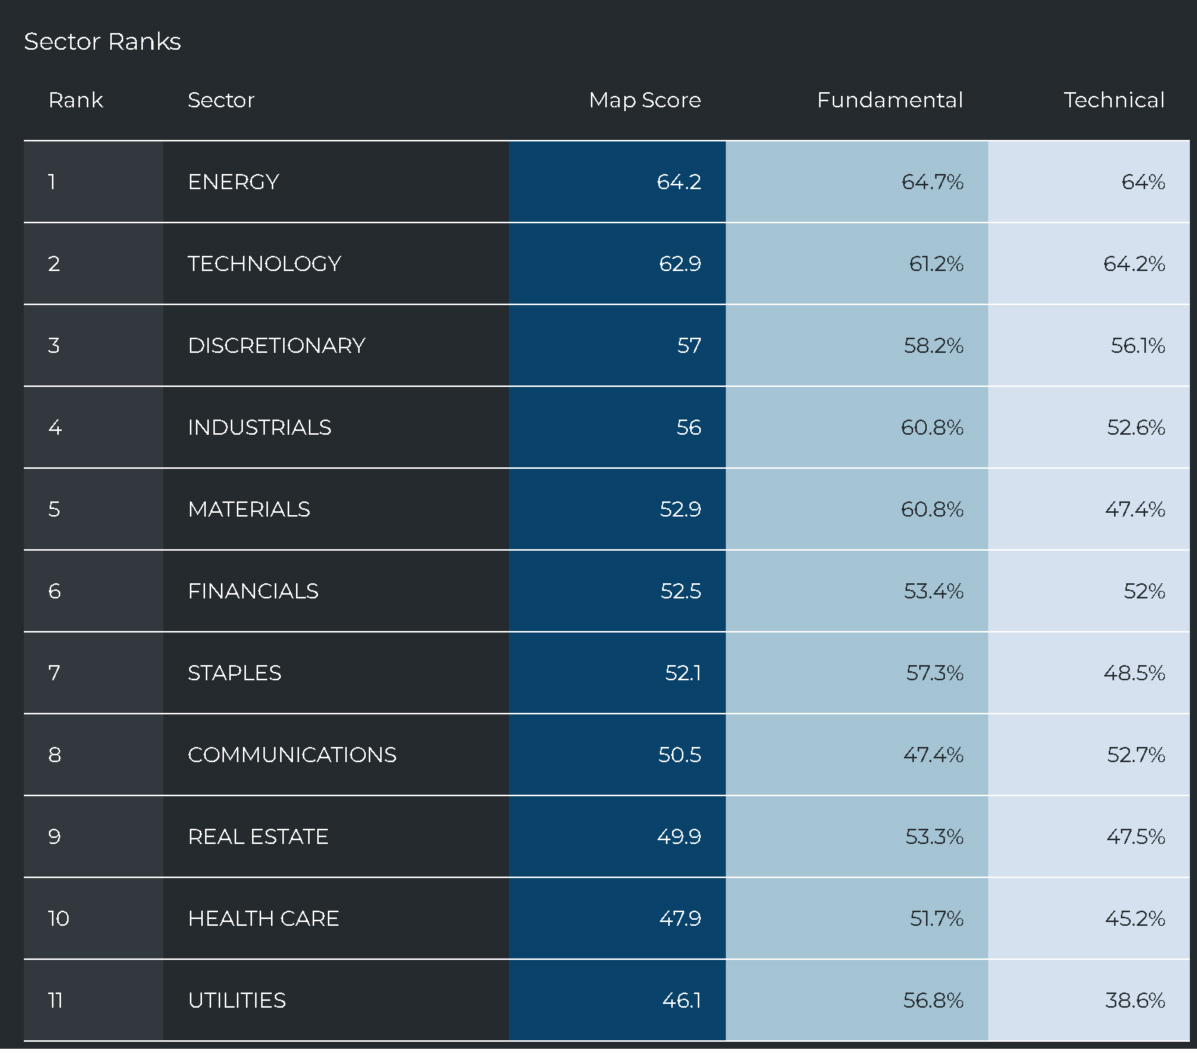
Graphs are for illustrative and discussion purposes only. Please read important disclosures at the end of this commentary.
As we look at unusual buying and selling, only energy has seen substantial buying in recent weeks:

Graphs are for illustrative and discussion purposes only. Please read important disclosures at the end of this commentary.
Since August 8th, WTI crude has risen by 17%, driving the sector – and future profit margins – higher:
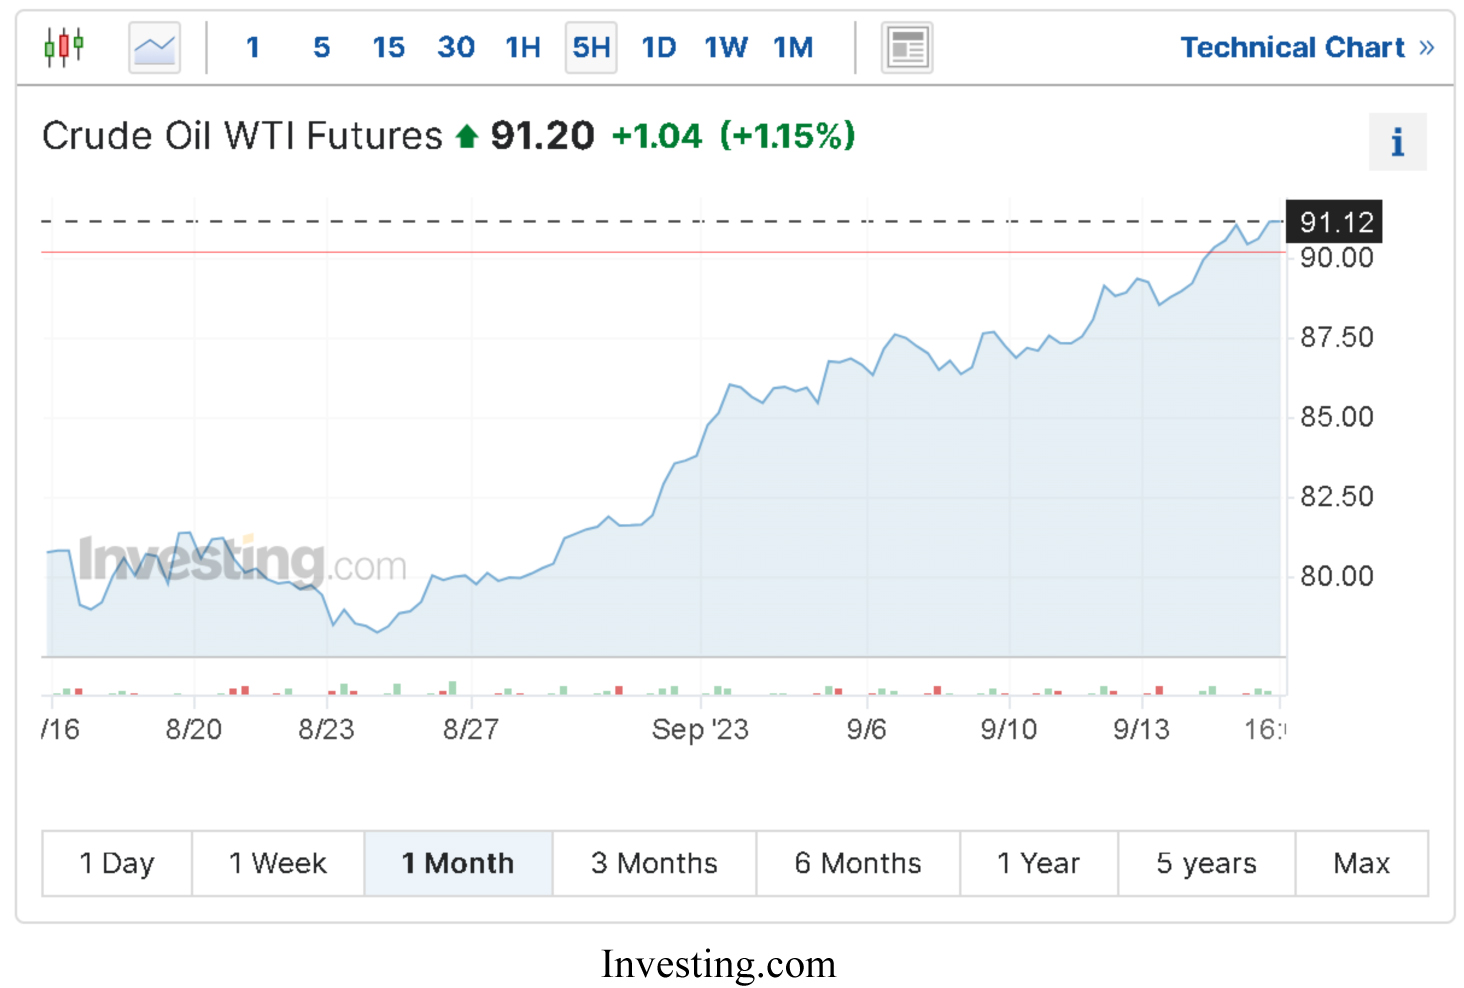
Graphs are for illustrative and discussion purposes only. Please read important disclosures at the end of this commentary.
September volatility is here. News headlines will take every advantage to leverage attention. This invariably drives stock market volatility, but there seem like two opposing stories going on. From one point of view, the VIX (CBOE Volatility Index) recently was at its lowest levels since the pandemic:
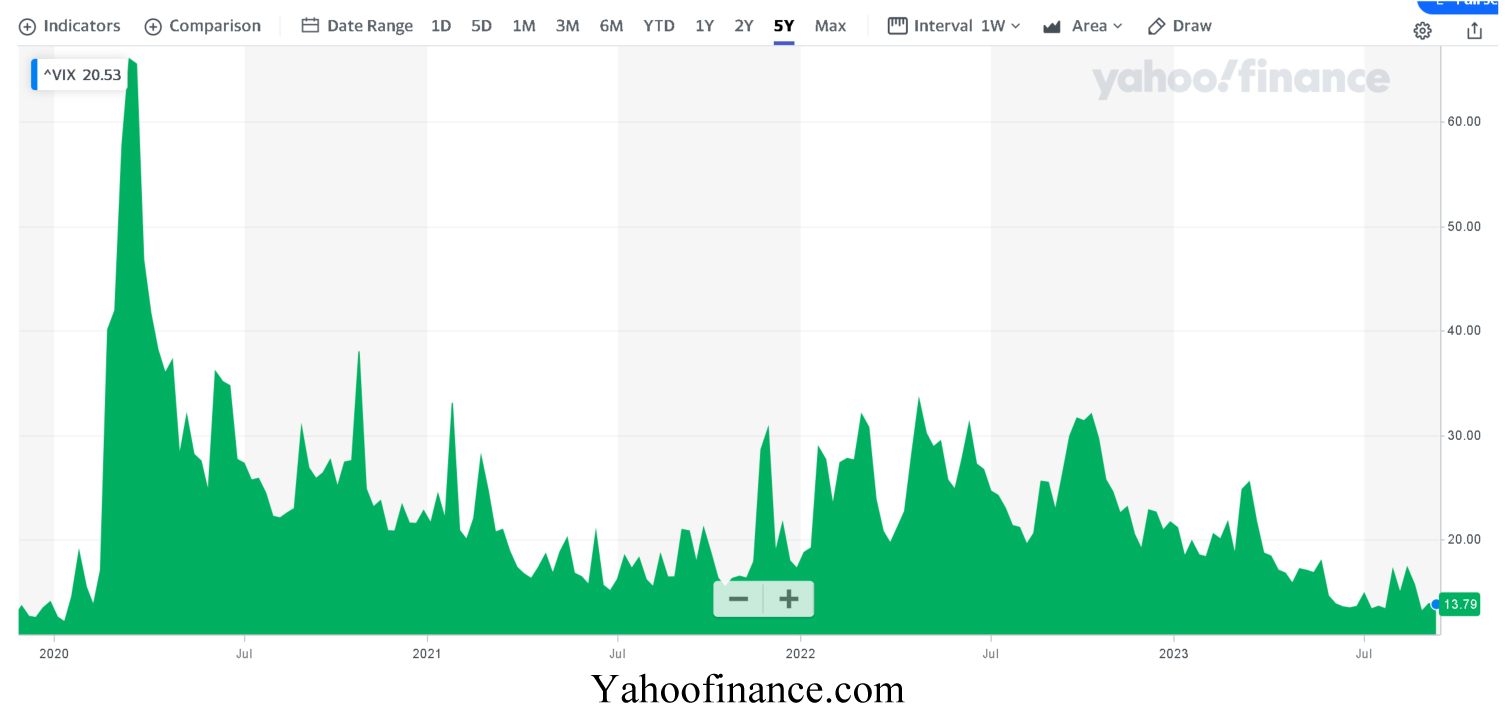
Graphs are for illustrative and discussion purposes only. Please read important disclosures at the end of this commentary.
A low VIX for an S&P 500 that returned -1.5% thus far in September is odd. This could mean we are in for more volatility, especially with a falling BMI:
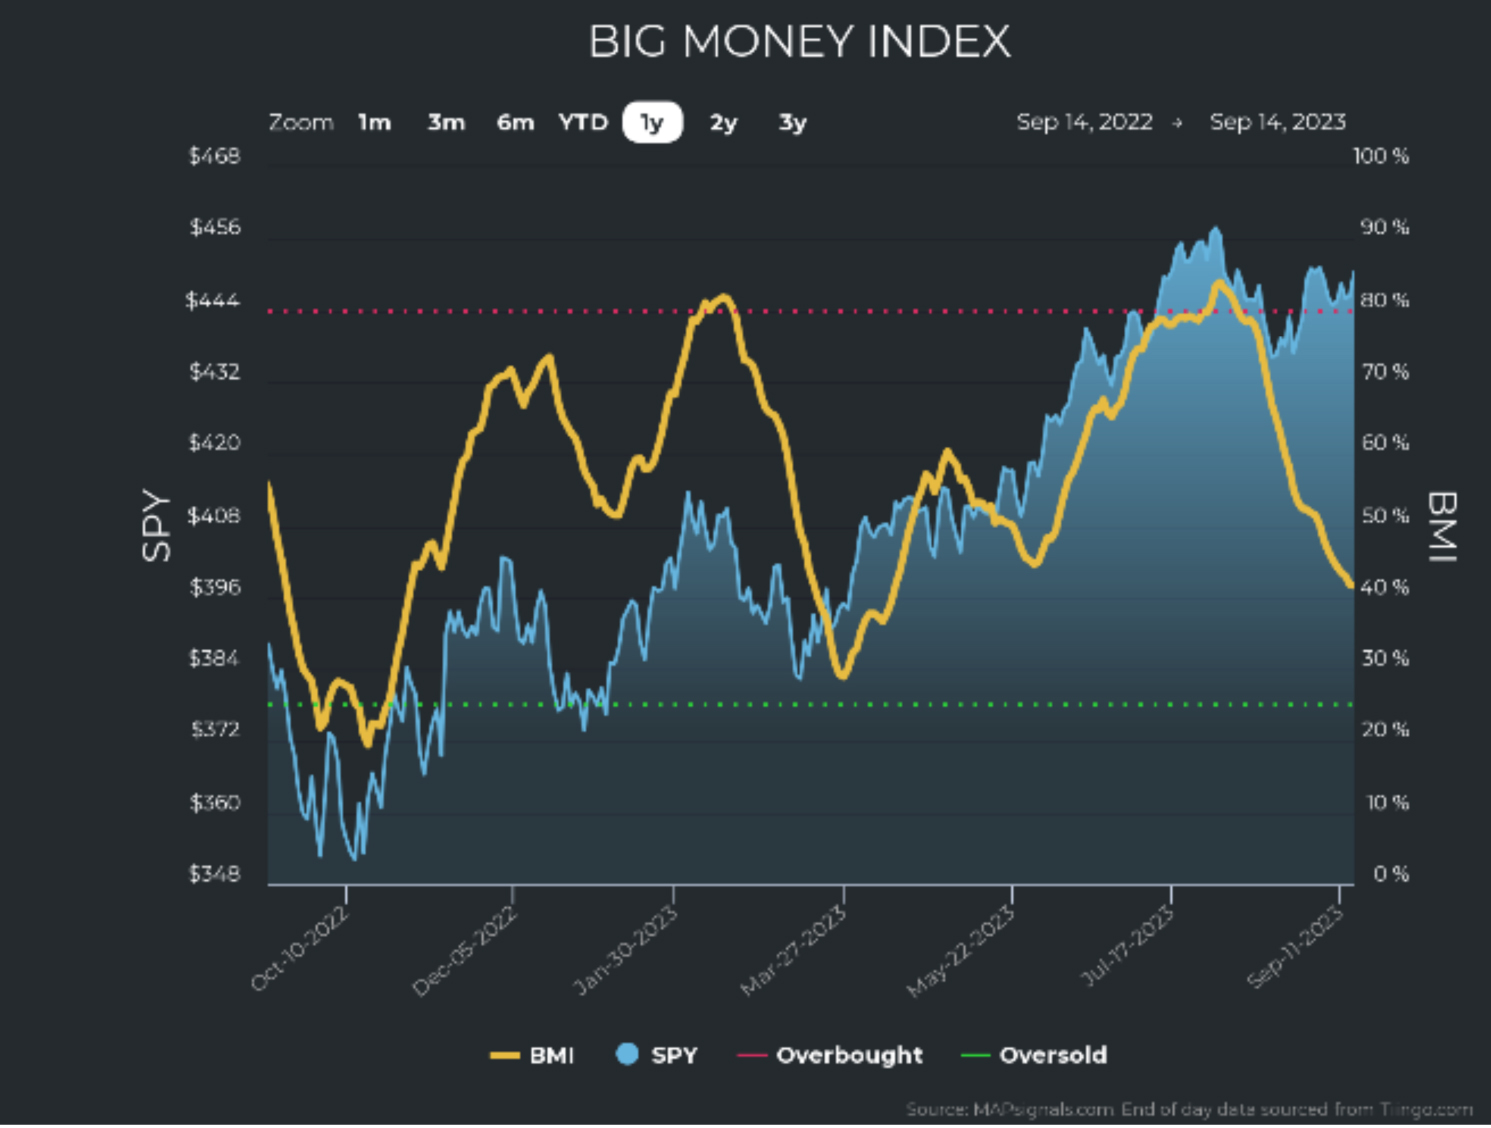
Graphs are for illustrative and discussion purposes only. Please read important disclosures at the end of this commentary.
But then again, that’s what we expect this time of year. That only paves the way for Q4: a big lift!
Graphs are for illustrative and discussion purposes only. Please read important disclosures at the end of this commentary.
I believe inflation isn’t as bad as the media echo chamber. I also believe we will not fall into a recession and stocks will lift by year’s end. Is it “Finger Lickin’ Good?” or “Eat Your Fingers Off”? I guess it depends on who is looking. It’s not always clear, and perspective matters a lot. As Friedrich Nietzsche said: “…those who were seen dancing were thought to be crazy by those who could not hear the music.”
All content above represents the opinion of Jason Bodner of Navellier & Associates, Inc.
Also In This Issue
A Look Ahead by Louis Navellier
Inflation is Rapidly Receding – Except for Energy Prices
Income Mail by Bryan Perry
America Desperately Needs Lower Rates to Pay its Rising Bills
Growth Mail by Gary Alexander
Rising Debt, Fewer Workers and Slower Growth Since 2001 – Why?
Global Mail by Ivan Martchev
Bonds and the Dollar Suggest a Further Correction in Equities
Sector Spotlight by Jason Bodner
The Market Often Surges or Sinks on Misinterpreted Words
View Full Archive
Read Past Issues Here

Jason Bodner
MARKETMAIL EDITOR FOR SECTOR SPOTLIGHT
Jason Bodner writes Sector Spotlight in the weekly Marketmail publication and has authored several white papers for the company. He is also Co-Founder of Macro Analytics for Professionals which produces proprietary equity accumulation/distribution research for its clients. Previously, Mr. Bodner served as Director of European Equity Derivatives for Cantor Fitzgerald Europe in London, then moved to the role of Head of Equity Derivatives North America for the same company in New York. He also served as S.V.P. Equity Derivatives for Jefferies, LLC. He received a B.S. in business administration in 1996, with honors, from Skidmore College as a member of the Periclean Honors Society. All content of “Sector Spotlight” represents the opinion of Jason Bodner
Important Disclosures:
Jason Bodner is a co-founder and co-owner of Mapsignals. Mr. Bodner is an independent contractor who is occasionally hired by Navellier & Associates to write an article and or provide opinions for possible use in articles that appear in Navellier & Associates weekly Market Mail. Mr. Bodner is not employed or affiliated with Louis Navellier, Navellier & Associates, Inc., or any other Navellier owned entity. The opinions and statements made here are those of Mr. Bodner and not necessarily those of any other persons or entities. This is not an endorsement, or solicitation or testimonial or investment advice regarding the BMI Index or any statements or recommendations or analysis in the article or the BMI Index or Mapsignals or its products or strategies.
Although information in these reports has been obtained from and is based upon sources that Navellier believes to be reliable, Navellier does not guarantee its accuracy and it may be incomplete or condensed. All opinions and estimates constitute Navellier’s judgment as of the date the report was created and are subject to change without notice. These reports are for informational purposes only and are not a solicitation for the purchase or sale of a security. Any decision to purchase securities mentioned in these reports must take into account existing public information on such securities or any registered prospectus.To the extent permitted by law, neither Navellier & Associates, Inc., nor any of its affiliates, agents, or service providers assumes any liability or responsibility nor owes any duty of care for any consequences of any person acting or refraining to act in reliance on the information contained in this communication or for any decision based on it.
Past performance is no indication of future results. Investment in securities involves significant risk and has the potential for partial or complete loss of funds invested. It should not be assumed that any securities recommendations made by Navellier. in the future will be profitable or equal the performance of securities made in this report. Dividend payments are not guaranteed. The amount of a dividend payment, if any, can vary over time and issuers may reduce dividends paid on securities in the event of a recession or adverse event affecting a specific industry or issuer.
None of the stock information, data, and company information presented herein constitutes a recommendation by Navellier or a solicitation to buy or sell any securities. Any specific securities identified and described do not represent all of the securities purchased, sold, or recommended for advisory clients. The holdings identified do not represent all of the securities purchased, sold, or recommended for advisory clients and the reader should not assume that investments in the securities identified and discussed were or will be profitable.
Information presented is general information that does not take into account your individual circumstances, financial situation, or needs, nor does it present a personalized recommendation to you. Individual stocks presented may not be suitable for every investor. Investment in securities involves significant risk and has the potential for partial or complete loss of funds invested. Investment in fixed income securities has the potential for the investment return and principal value of an investment to fluctuate so that an investor’s holdings, when redeemed, may be worth less than their original cost.
One cannot invest directly in an index. Index is unmanaged and index performance does not reflect deduction of fees, expenses, or taxes. Presentation of Index data does not reflect a belief by Navellier that any stock index constitutes an investment alternative to any Navellier equity strategy or is necessarily comparable to such strategies. Among the most important differences between the Indices and Navellier strategies are that the Navellier equity strategies may (1) incur material management fees, (2) concentrate its investments in relatively few stocks, industries, or sectors, (3) have significantly greater trading activity and related costs, and (4) be significantly more or less volatile than the Indices.
ETF Risk: We may invest in exchange traded funds (“ETFs”) and some of our investment strategies are generally fully invested in ETFs. Like traditional mutual funds, ETFs charge asset-based fees, but they generally do not charge initial sales charges or redemption fees and investors typically pay only customary brokerage fees to buy and sell ETF shares. The fees and costs charged by ETFs held in client accounts will not be deducted from the compensation the client pays Navellier. ETF prices can fluctuate up or down, and a client account could lose money investing in an ETF if the prices of the securities owned by the ETF go down. ETFs are subject to additional risks:
- ETF shares may trade above or below their net asset value;
- An active trading market for an ETF’s shares may not develop or be maintained;
- The value of an ETF may be more volatile than the underlying portfolio of securities the ETF is designed to track;
- The cost of owning shares of the ETF may exceed those a client would incur by directly investing in the underlying securities; and
- Trading of an ETF’s shares may be halted if the listing exchange’s officials deem it appropriate, the shares are delisted from the exchange, or the activation of market-wide “circuit breakers” (which are tied to large decreases in stock prices) halts stock trading generally.
Grader Disclosures: Investment in equity strategies involves substantial risk and has the potential for partial or complete loss of funds invested. The sample portfolio and any accompanying charts are for informational purposes only and are not to be construed as a solicitation to buy or sell any financial instrument and should not be relied upon as the sole factor in an investment making decision. As a matter of normal and important disclosures to you, as a potential investor, please consider the following: The performance presented is not based on any actual securities trading, portfolio, or accounts, and the reported performance of the A, B, C, D, and F portfolios (collectively the “model portfolios”) should be considered mere “paper” or pro forma performance results based on Navellier’s research.
Investors evaluating any of Navellier & Associates, Inc.’s, (or its affiliates’) Investment Products must not use any information presented here, including the performance figures of the model portfolios, in their evaluation of any Navellier Investment Products. Navellier Investment Products include the firm’s mutual funds and managed accounts. The model portfolios, charts, and other information presented do not represent actual funded trades and are not actual funded portfolios. There are material differences between Navellier Investment Products’ portfolios and the model portfolios, research, and performance figures presented here. The model portfolios and the research results (1) may contain stocks or ETFs that are illiquid and difficult to trade; (2) may contain stock or ETF holdings materially different from actual funded Navellier Investment Product portfolios; (3) include the reinvestment of all dividends and other earnings, estimated trading costs, commissions, or management fees; and, (4) may not reflect prices obtained in an actual funded Navellier Investment Product portfolio. For these and other reasons, the reported performances of model portfolios do not reflect the performance results of Navellier’s actually funded and traded Investment Products. In most cases, Navellier’s Investment Products have materially lower performance results than the performances of the model portfolios presented.
This report contains statements that are, or may be considered to be, forward-looking statements. All statements that are not historical facts, including statements about our beliefs or expectations, are “forward-looking statements” within the meaning of The U.S. Private Securities Litigation Reform Act of 1995. These statements may be identified by such forward-looking terminology as “expect,” “estimate,” “plan,” “intend,” “believe,” “anticipate,” “may,” “will,” “should,” “could,” “continue,” “project,” or similar statements or variations of such terms. Our forward-looking statements are based on a series of expectations, assumptions, and projections, are not guarantees of future results or performance, and involve substantial risks and uncertainty as described in Form ADV Part 2A of our filing with the Securities and Exchange Commission (SEC), which is available at www.adviserinfo.sec.gov or by requesting a copy by emailing info@navellier.com. All of our forward-looking statements are as of the date of this report only. We can give no assurance that such expectations or forward-looking statements will prove to be correct. Actual results may differ materially. You are urged to carefully consider all such factors.
FEDERAL TAX ADVICE DISCLAIMER: As required by U.S. Treasury Regulations, you are informed that, to the extent this presentation includes any federal tax advice, the presentation is not written by Navellier to be used, and cannot be used, for the purpose of avoiding federal tax penalties. Navellier does not advise on any income tax requirements or issues. Use of any information presented by Navellier is for general information only and does not represent tax advice either express or implied. You are encouraged to seek professional tax advice for income tax questions and assistance.
IMPORTANT NEWSLETTER DISCLOSURE:The hypothetical performance results for investment newsletters that are authored or edited by Louis Navellier, including Louis Navellier’s Growth Investor, Louis Navellier’s Breakthrough Stocks, Louis Navellier’s Accelerated Profits, and Louis Navellier’s Platinum Club, are not based on any actual securities trading, portfolio, or accounts, and the newsletters’ reported hypothetical performances should be considered mere “paper” or proforma hypothetical performance results and are not actual performance of real world trades. Navellier & Associates, Inc. does not have any relation to or affiliation with the owner of these newsletters. There are material differences between Navellier Investment Products’ portfolios and the InvestorPlace Media, LLC newsletter portfolios authored by Louis Navellier. The InvestorPlace Media, LLC newsletters contain hypothetical performance that do not include transaction costs, advisory fees, or other fees a client might incur if actual investments and trades were being made by an investor. As a result, newsletter performance should not be used to evaluate Navellier Investment services which are separate and different from the newsletters. The owner of the newsletters is InvestorPlace Media, LLC and any questions concerning the newsletters, including any newsletter advertising or hypothetical Newsletter performance claims, (which are calculated solely by Investor Place Media and not Navellier) should be referred to InvestorPlace Media, LLC at (800) 718-8289.
Please note that Navellier & Associates and the Navellier Private Client Group are managed completely independent of the newsletters owned and published by InvestorPlace Media, LLC and written and edited by Louis Navellier, and investment performance of the newsletters should in no way be considered indicative of potential future investment performance for any Navellier & Associates separately managed account portfolio. Potential investors should consult with their financial advisor before investing in any Navellier Investment Product.
Navellier claims compliance with Global Investment Performance Standards (GIPS). To receive a complete list and descriptions of Navellier’s composites and/or a presentation that adheres to the GIPS standards, please contact Navellier or click here. It should not be assumed that any securities recommendations made by Navellier & Associates, Inc. in the future will be profitable or equal the performance of securities made in this report.
FactSet Disclosure: Navellier does not independently calculate the statistical information included in the attached report. The calculation and the information are provided by FactSet, a company not related to Navellier. Although information contained in the report has been obtained from FactSet and is based on sources Navellier believes to be reliable, Navellier does not guarantee its accuracy, and it may be incomplete or condensed. The report and the related FactSet sourced information are provided on an “as is” basis. The user assumes the entire risk of any use made of this information. Investors should consider the report as only a single factor in making their investment decision. The report is for informational purposes only and is not intended as an offer or solicitation for the purchase or sale of a security. FactSet sourced information is the exclusive property of FactSet. Without prior written permission of FactSet, this information may not be reproduced, disseminated or used to create any financial products. All indices are unmanaged and performance of the indices include reinvestment of dividends and interest income, unless otherwise noted, are not illustrative of any particular investment and an investment cannot be made in any index. Past performance is no guarantee of future results.