by Gary Alexander
May 2, 2023
The first estimate for U.S. Gross Domestic Product (GDP) for the first quarter of 2023 just came out last Thursday, and it was an anemic +1.1%, par for the course for the Biden era, and for our post-9/11 world.
In last Friday’s “Review & Outlook” section, The Wall Street Journal editorialized (in “The Case of the Missing Investment”) that the supply-side of the economy is hurting from Biden’s anti-growth policies.
In particular, the Journal pointed out that, “Gross private domestic investment fell 12.5% in the quarter, driven by declines in business equipment (down 7.3%) and residential housing (down 4.2%). This tells a worrying story about economic policy. A characteristic of the post-pandemic recovery has been that business investment often hasn’t kept pace with robust consumer demand, and now it looks like investment might fall behind again.” This is a sad commentary on the anti-business tone in Washington.
We have seen brief spurts of high growth – such as in 2019 and 2021, just before and after COVID struck – but overall, the last 22 years of slow growth and soaring debt would tempt a cynic to say that Osama bin Laden permanently wounded our economy. When he engineered those flights into the World Trade Center and Pentagon, he may not have destroyed America’s financial system, but he slowed 55 years of postwar growth to half-speed. From then on, we have lived more on future borrowings than on present production.
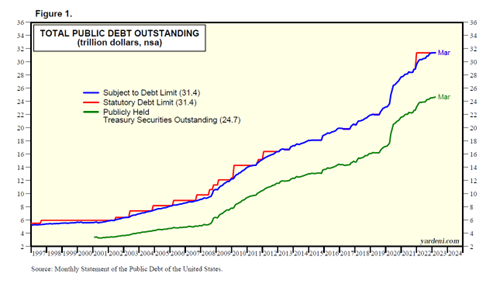
Our many reactive overseas wars – in Afghanistan and Iraq, then Libya and Syria, and more – to fight the long shadow of bin Laden are only part of the cost. We have also expanded many non-productive programs at home while running up debts that are now well over five-fold what they were on 9/11.
Graphs are for illustrative and discussion purposes only. Please read important disclosures at the end of this commentary.
After three successive years of balanced budgets, 1999-2001, the national debt quintupled in 20 years.
After half a century of 3.6% average annual growth, and 2.4% real annual per capital growth, 1950 to 1999, per capita growth was cut in half, and average annual growth has been reduced to 2% since 2000.
| Years | GDP/Year | Per Capita |
| 1950-1999 | +3.6% | +2.4% |
| 2000-2022 | +2.0% | +1.2% |
| Crestmont Research (Economy-GDP-R-By-Decade.pdf (crestmontresearch.com) | ||
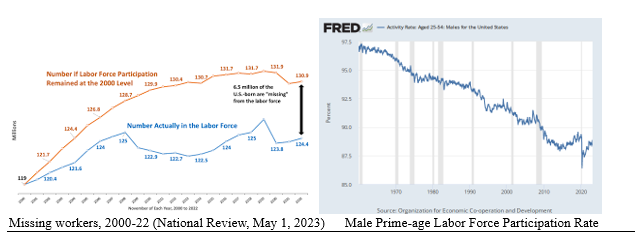
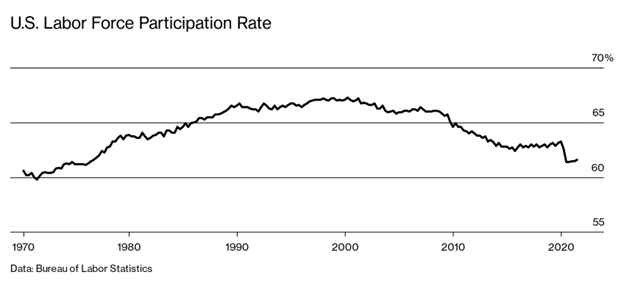
The year 2000 is also about the time when able-bodied men and women started dropping out of the labor force. I’ve covered men in the past, but the current issue of National Review (“Missing Workers Found: It turns out they are not immigrants,” May 1, 2003, by Steven Camarota, director of research at the Center for Immigration Studies) shows that “The labor-force participation rate of U.S.-born women rose until about the year 2000 and has declined since, even as the share of U.S.-born women with children has also declined significantly. The decline in employment is primarily among the U.S.-born non-college-educated, and this holds true whether one studies the 16-to-64, 18-to-64 or 25-to-54 age range.”
Graphs are for illustrative and discussion purposes only. Please read important disclosures at the end of this commentary.
The overall labor force participation rate for U.S.-born adults aged 18 to 64 without a bachelor’s degree was 76.4% in 2000, but it fell to 70.3% at the end of 2022, when the unemployment rate was under 4%. The reason for this great statistical gap is that the unemployment rate only counts those who say they are looking for a job. “They do not include the roughly 54 million working-age people who are neither working nor looking for work,” says National Review. Did something in the dot-com bubble or 9/11 (or both) kill our entrepreneurial spirit or our working drive or the spirit of growth in our country?
Graphs are for illustrative and discussion purposes only. Please read important disclosures at the end of this commentary.
The Day of Reckoning for Debts is Approaching
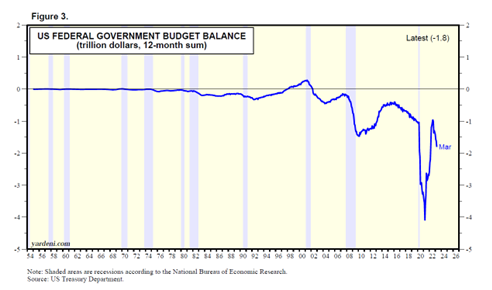
Presidents and Congressional majorities of both Parties spend too much money, to be sure, but we voters choose these people and re-elect them. This is what we apparently want, that proverbial “free lunch” of rising benefits at low or no cost. The result has been trillion-dollar deficits in most years since 2009:
Graphs are for illustrative and discussion purposes only. Please read important disclosures at the end of this commentary.
So far in the 2020s, deficits are approaching $10 trillion: $3.132 trillion in 2020, $2.776 trillion in 2021, $1.375 trillion in 2022, and $1.1 trillion in the first half of FY’23, for a $9.5 trillion rate for four years.
So far, we have not faced the inevitable consequences of this massive debt, since interest rates have been so low, at near zero for nearly 14 years until last year. This free ride will not continue. In the last year, including tomorrow’s presumptive 0.25% rate increase, the Fed raised rates 10 consecutive times for 500 basis points. This has raised the outlay for interest paid on the federal debt to $565 billion over the last 12 months (through March 31, charted below), up about 50% from early 2022, with more rises to come.
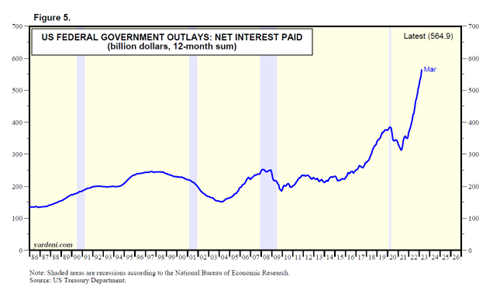
Graphs are for illustrative and discussion purposes only. Please read important disclosures at the end of this commentary.
This total is based on average interest rates on publicly held debt of around 2.2%. At average payments of just 3%, the annual interest expense would be $740 billion at current debt levels – but debts will increase!
This brings us to the silliest of all debates – the “debt ceiling debate.” This carnival is like a convention of overeaters arguing over diet plans so that they can wrestle into their bathing suits this summer, after which they will binge again in the fall. Setting a new debt ceiling only gives them permission to over-spend more, until the next ceiling comes into view. Where is the virtue in that? Do away with ceilings and start talking “floors” instead. Start reducing spending to last year’s spending level instead – a new floor!
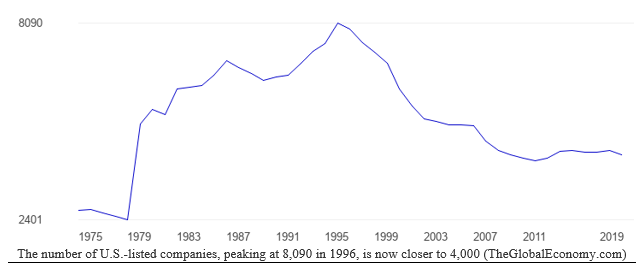
In the meantime, let’s keep investing in good stocks. Don’t “Sell in May” or “Go Away,” since well-run companies can still grow despite the direction the nation as a whole is taking. In fact, with fewer of us willing to work, those who work the hardest and smartest will be rewarded the most, and there are now far fewer companies on U.S. exchanges, from a peak of 8,090 in 1996 to barely half that, 4,266 in 2019:
Graphs are for illustrative and discussion purposes only. Please read important disclosures at the end of this commentary.
With far more money chasing far fewer stocks, there is a thriving market for good stocks. The world is still growing on all major continents, and there will be customers in developing nations as well as at home for enlightened businesses seeking new markets, so go where the smart money is going – toward growth.
All content above represents the opinion of Gary Alexander of Navellier & Associates, Inc.
Also In This Issue
A Look Ahead by Louis Navellier
GDP Rose 1.1% in Q1; Can We Dodge a Recession?
Income Mail by Bryan Perry
The Market May Enjoy “Spring Fever” With a Positive Fed Policy Statement
Growth Mail by Gary Alexander
A Tale of Two Centuries: Growth (1950-99) vs. Debt (2000-23)
Global Mail by Ivan Martchev
Market Advances on Poor Breadth
Sector Spotlight by Jason Bodner
Tech is Back in Fashion – Will That Continue?
View Full Archive
Read Past Issues Here
About The Author

Gary Alexander
SENIOR EDITOR
Gary Alexander has been Senior Writer at Navellier since 2009. He edits Navellier’s weekly Marketmail and writes a weekly Growth Mail column, in which he uses market history to support the case for growth stocks. For the previous 20 years before joining Navellier, he was Senior Executive Editor at InvestorPlace Media (formerly Phillips Publishing), where he worked with several leading investment analysts, including Louis Navellier (since 1997), helping launch Louis Navellier’s Blue Chip Growth and Global Growth newsletters.
Prior to that, Gary edited Wealth Magazine and Gold Newsletter and wrote various investment research reports for Jefferson Financial in New Orleans in the 1980s. He began his financial newsletter career with KCI Communications in 1980, where he served as consulting editor for Personal Finance newsletter while serving as general manager of KCI’s Alexandria House book division. Before that, he covered the economics beat for news magazines. All content of “Growth Mail” represents the opinion of Gary Alexander
Important Disclosures:
Although information in these reports has been obtained from and is based upon sources that Navellier believes to be reliable, Navellier does not guarantee its accuracy and it may be incomplete or condensed. All opinions and estimates constitute Navellier’s judgment as of the date the report was created and are subject to change without notice. These reports are for informational purposes only and are not a solicitation for the purchase or sale of a security. Any decision to purchase securities mentioned in these reports must take into account existing public information on such securities or any registered prospectus.To the extent permitted by law, neither Navellier & Associates, Inc., nor any of its affiliates, agents, or service providers assumes any liability or responsibility nor owes any duty of care for any consequences of any person acting or refraining to act in reliance on the information contained in this communication or for any decision based on it.
Past performance is no indication of future results. Investment in securities involves significant risk and has the potential for partial or complete loss of funds invested. It should not be assumed that any securities recommendations made by Navellier. in the future will be profitable or equal the performance of securities made in this report. Dividend payments are not guaranteed. The amount of a dividend payment, if any, can vary over time and issuers may reduce dividends paid on securities in the event of a recession or adverse event affecting a specific industry or issuer.
None of the stock information, data, and company information presented herein constitutes a recommendation by Navellier or a solicitation to buy or sell any securities. Any specific securities identified and described do not represent all of the securities purchased, sold, or recommended for advisory clients. The holdings identified do not represent all of the securities purchased, sold, or recommended for advisory clients and the reader should not assume that investments in the securities identified and discussed were or will be profitable.
Information presented is general information that does not take into account your individual circumstances, financial situation, or needs, nor does it present a personalized recommendation to you. Individual stocks presented may not be suitable for every investor. Investment in securities involves significant risk and has the potential for partial or complete loss of funds invested. Investment in fixed income securities has the potential for the investment return and principal value of an investment to fluctuate so that an investor’s holdings, when redeemed, may be worth less than their original cost.
One cannot invest directly in an index. Index is unmanaged and index performance does not reflect deduction of fees, expenses, or taxes. Presentation of Index data does not reflect a belief by Navellier that any stock index constitutes an investment alternative to any Navellier equity strategy or is necessarily comparable to such strategies. Among the most important differences between the Indices and Navellier strategies are that the Navellier equity strategies may (1) incur material management fees, (2) concentrate its investments in relatively few stocks, industries, or sectors, (3) have significantly greater trading activity and related costs, and (4) be significantly more or less volatile than the Indices.
ETF Risk: We may invest in exchange traded funds (“ETFs”) and some of our investment strategies are generally fully invested in ETFs. Like traditional mutual funds, ETFs charge asset-based fees, but they generally do not charge initial sales charges or redemption fees and investors typically pay only customary brokerage fees to buy and sell ETF shares. The fees and costs charged by ETFs held in client accounts will not be deducted from the compensation the client pays Navellier. ETF prices can fluctuate up or down, and a client account could lose money investing in an ETF if the prices of the securities owned by the ETF go down. ETFs are subject to additional risks:
- ETF shares may trade above or below their net asset value;
- An active trading market for an ETF’s shares may not develop or be maintained;
- The value of an ETF may be more volatile than the underlying portfolio of securities the ETF is designed to track;
- The cost of owning shares of the ETF may exceed those a client would incur by directly investing in the underlying securities; and
- Trading of an ETF’s shares may be halted if the listing exchange’s officials deem it appropriate, the shares are delisted from the exchange, or the activation of market-wide “circuit breakers” (which are tied to large decreases in stock prices) halts stock trading generally.
Grader Disclosures: Investment in equity strategies involves substantial risk and has the potential for partial or complete loss of funds invested. The sample portfolio and any accompanying charts are for informational purposes only and are not to be construed as a solicitation to buy or sell any financial instrument and should not be relied upon as the sole factor in an investment making decision. As a matter of normal and important disclosures to you, as a potential investor, please consider the following: The performance presented is not based on any actual securities trading, portfolio, or accounts, and the reported performance of the A, B, C, D, and F portfolios (collectively the “model portfolios”) should be considered mere “paper” or pro forma performance results based on Navellier’s research.
Investors evaluating any of Navellier & Associates, Inc.’s, (or its affiliates’) Investment Products must not use any information presented here, including the performance figures of the model portfolios, in their evaluation of any Navellier Investment Products. Navellier Investment Products include the firm’s mutual funds and managed accounts. The model portfolios, charts, and other information presented do not represent actual funded trades and are not actual funded portfolios. There are material differences between Navellier Investment Products’ portfolios and the model portfolios, research, and performance figures presented here. The model portfolios and the research results (1) may contain stocks or ETFs that are illiquid and difficult to trade; (2) may contain stock or ETF holdings materially different from actual funded Navellier Investment Product portfolios; (3) include the reinvestment of all dividends and other earnings, estimated trading costs, commissions, or management fees; and, (4) may not reflect prices obtained in an actual funded Navellier Investment Product portfolio. For these and other reasons, the reported performances of model portfolios do not reflect the performance results of Navellier’s actually funded and traded Investment Products. In most cases, Navellier’s Investment Products have materially lower performance results than the performances of the model portfolios presented.
This report contains statements that are, or may be considered to be, forward-looking statements. All statements that are not historical facts, including statements about our beliefs or expectations, are “forward-looking statements” within the meaning of The U.S. Private Securities Litigation Reform Act of 1995. These statements may be identified by such forward-looking terminology as “expect,” “estimate,” “plan,” “intend,” “believe,” “anticipate,” “may,” “will,” “should,” “could,” “continue,” “project,” or similar statements or variations of such terms. Our forward-looking statements are based on a series of expectations, assumptions, and projections, are not guarantees of future results or performance, and involve substantial risks and uncertainty as described in Form ADV Part 2A of our filing with the Securities and Exchange Commission (SEC), which is available at www.adviserinfo.sec.gov or by requesting a copy by emailing info@navellier.com. All of our forward-looking statements are as of the date of this report only. We can give no assurance that such expectations or forward-looking statements will prove to be correct. Actual results may differ materially. You are urged to carefully consider all such factors.
FEDERAL TAX ADVICE DISCLAIMER: As required by U.S. Treasury Regulations, you are informed that, to the extent this presentation includes any federal tax advice, the presentation is not written by Navellier to be used, and cannot be used, for the purpose of avoiding federal tax penalties. Navellier does not advise on any income tax requirements or issues. Use of any information presented by Navellier is for general information only and does not represent tax advice either express or implied. You are encouraged to seek professional tax advice for income tax questions and assistance.
IMPORTANT NEWSLETTER DISCLOSURE:The hypothetical performance results for investment newsletters that are authored or edited by Louis Navellier, including Louis Navellier’s Growth Investor, Louis Navellier’s Breakthrough Stocks, Louis Navellier’s Accelerated Profits, and Louis Navellier’s Platinum Club, are not based on any actual securities trading, portfolio, or accounts, and the newsletters’ reported hypothetical performances should be considered mere “paper” or proforma hypothetical performance results and are not actual performance of real world trades. Navellier & Associates, Inc. does not have any relation to or affiliation with the owner of these newsletters. There are material differences between Navellier Investment Products’ portfolios and the InvestorPlace Media, LLC newsletter portfolios authored by Louis Navellier. The InvestorPlace Media, LLC newsletters contain hypothetical performance that do not include transaction costs, advisory fees, or other fees a client might incur if actual investments and trades were being made by an investor. As a result, newsletter performance should not be used to evaluate Navellier Investment services which are separate and different from the newsletters. The owner of the newsletters is InvestorPlace Media, LLC and any questions concerning the newsletters, including any newsletter advertising or hypothetical Newsletter performance claims, (which are calculated solely by Investor Place Media and not Navellier) should be referred to InvestorPlace Media, LLC at (800) 718-8289.
Please note that Navellier & Associates and the Navellier Private Client Group are managed completely independent of the newsletters owned and published by InvestorPlace Media, LLC and written and edited by Louis Navellier, and investment performance of the newsletters should in no way be considered indicative of potential future investment performance for any Navellier & Associates separately managed account portfolio. Potential investors should consult with their financial advisor before investing in any Navellier Investment Product.
Navellier claims compliance with Global Investment Performance Standards (GIPS). To receive a complete list and descriptions of Navellier’s composites and/or a presentation that adheres to the GIPS standards, please contact Navellier or click here. It should not be assumed that any securities recommendations made by Navellier & Associates, Inc. in the future will be profitable or equal the performance of securities made in this report.
FactSet Disclosure: Navellier does not independently calculate the statistical information included in the attached report. The calculation and the information are provided by FactSet, a company not related to Navellier. Although information contained in the report has been obtained from FactSet and is based on sources Navellier believes to be reliable, Navellier does not guarantee its accuracy, and it may be incomplete or condensed. The report and the related FactSet sourced information are provided on an “as is” basis. The user assumes the entire risk of any use made of this information. Investors should consider the report as only a single factor in making their investment decision. The report is for informational purposes only and is not intended as an offer or solicitation for the purchase or sale of a security. FactSet sourced information is the exclusive property of FactSet. Without prior written permission of FactSet, this information may not be reproduced, disseminated or used to create any financial products. All indices are unmanaged and performance of the indices include reinvestment of dividends and interest income, unless otherwise noted, are not illustrative of any particular investment and an investment cannot be made in any index. Past performance is no guarantee of future results.