by Jason Bodner
August 29, 2023
A lot of weird stuff happens in the heat of summer. For instance, the Eiffel Tower gets taller in the summer – by up to six inches – due to thermal expansion – then it shrinks back in the winter.
Stocks also bow and flex in the summer. And I bet you’re sick of all that volatility. Looking at it can be dizzying. Hearing about is almost worse. And waking up not knowing what to expect can be agonizing.
August market days can be so frustrating. A case in point is the recent earnings call from Nvidia (NVDA, which I own in personal accounts). The company shattered all expectations for a blowout quarter. It delivered the coveted trifecta: NVDA beat both sales and earnings estimates, and then issued substantially higher guidance. That’s the kind of report that usually powers a stock to stratospheric heights. Overnight, many street analysts raised their price target to $600 (from Wednesday’s $471 close). One target was $1,000. Eager owners, including me, watched as shares soared more than 10% in after-hours trading.
A company worth $1.1 trillion would ordinarily lift an entire market higher. And Thursday seemed poised for exactly that with NASDAQ futures up 1.5% pre-market and NVDA opening at a lofty $502. But it wasn’t meant to be. Markets ended up closing sharply lower. NASDAQ closed -1.87% lower. And those paper NVDA gains? They melted away to a measly $0.47 (+0.1%) gain by the time of Thursday’s close.
Then, NVDA fell 2.43% to $460.18 on Friday’s close. So much for winning the “trifecta.”
It’s stuff like this that makes traders want to log out of their brokerage accounts and not come back until October. But the news events keep coming…. The ones you can’t miss. Like FED chair Jerome Powell’s speech at Jackson Hole. He said the falling inflation is good, BUT – and there’s always a ‘but’ – on the other hand (and there’s always that ‘other hand’), so you end up wondering what he really thinks.
Essentially, Powell’s language is very cautionary. Two successive lower readings are not enough to feel confident that PCE and core inflation will continue their declining trend. While core goods fell, they are still higher, year over year. Therefore, continued restrictive policy is required to keep fighting inflation.
We’re hearing more or less the same message we have been hearing – only now, the acknowledgement is that everything is coming down. Powell’s “BUT” is that we are “navigating using the stars under the cover of clouds” or something like that. One would think that voodoo like this might tank stocks. But at the conclusion of Powell’s address, NASDAQ rallied to +1% and then fell to -0.3% before rallying again.
Naturally, this speech comes in what is arguably the last week of summer for Wall Street. We still have this week, as Labor Day marks the boundary between lazy summer and an action-packed autumn. The bottom line is that we are in the thick of summer volatility, so Fed speeches keep reeling us back in.
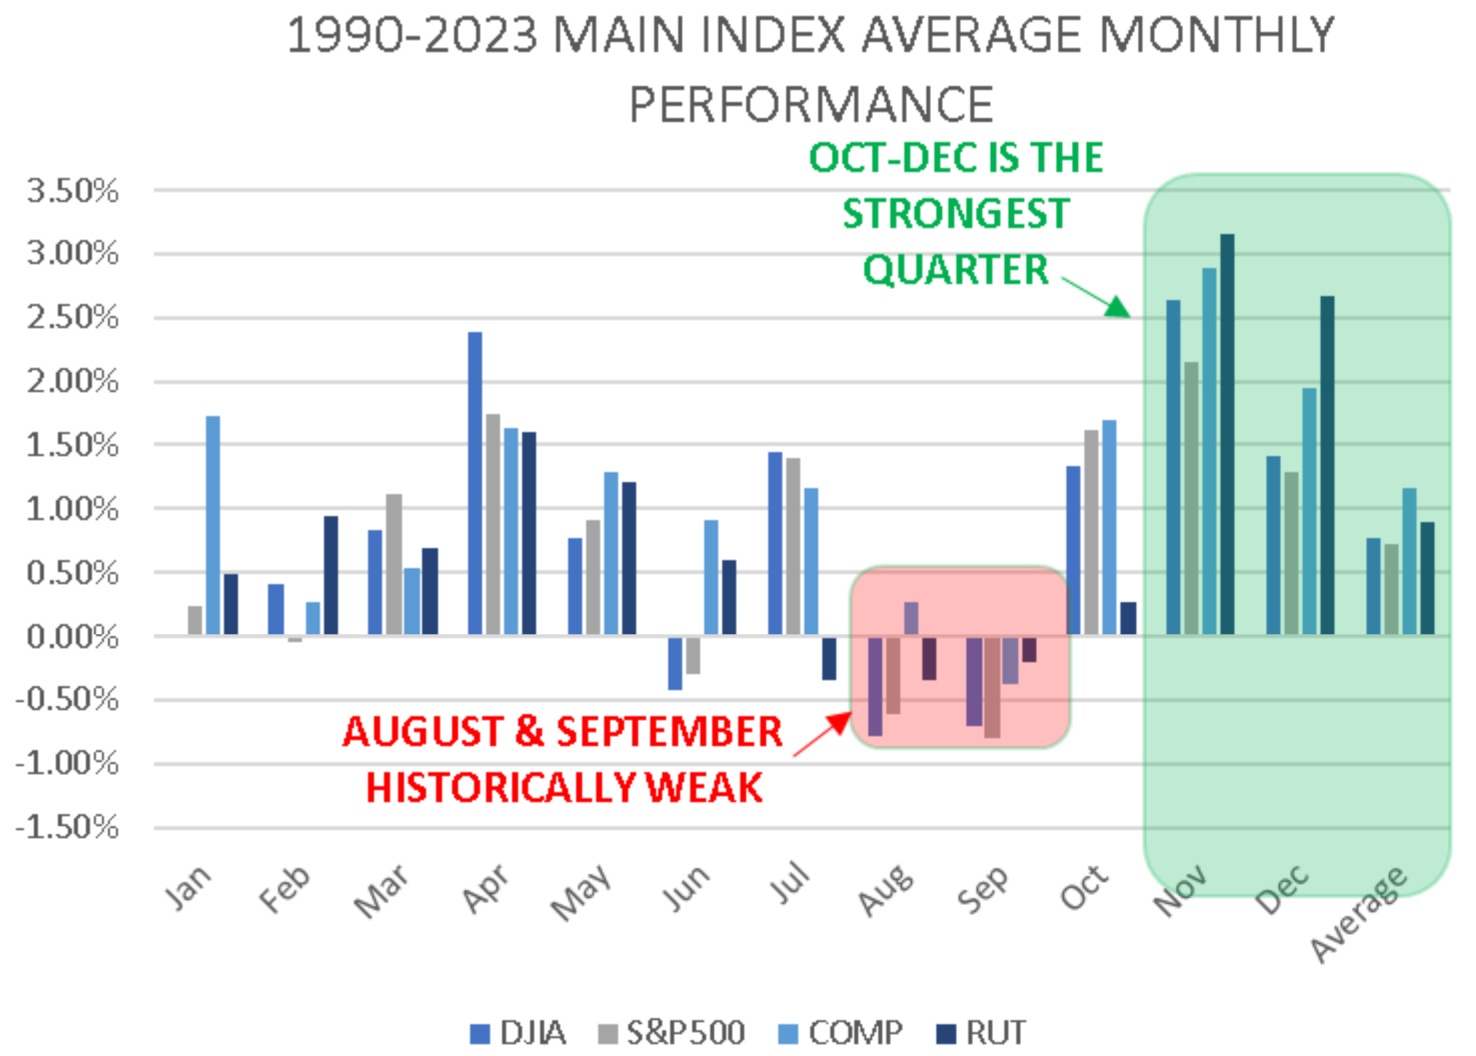
Let’s turn to the data to see what’s really happening, and what we can expect. Naturally you have seen the following chart many times. I love it because it tells the whole story in a simple graph, the story being, in sum: August and September typically stink, while October through December are awesome for stocks.
Graphs are for illustrative and discussion purposes only. Please read important disclosures at the end of this commentary.
August has played out precisely how history suggested it would, with the S&P 500 down 4% through last Friday. My bet is that September will also be down, which bodes well for the rest of the year. With that out of the way, perhaps we really could just turn off CNBC and reapproach investing in early October?
That would be nice, but it would also ignore what sets up to be a potentially great opportunity. Markets are softening, but perhaps there’s a signal that will alert us when to buy great stocks on sale?
Let’s look at the setup.
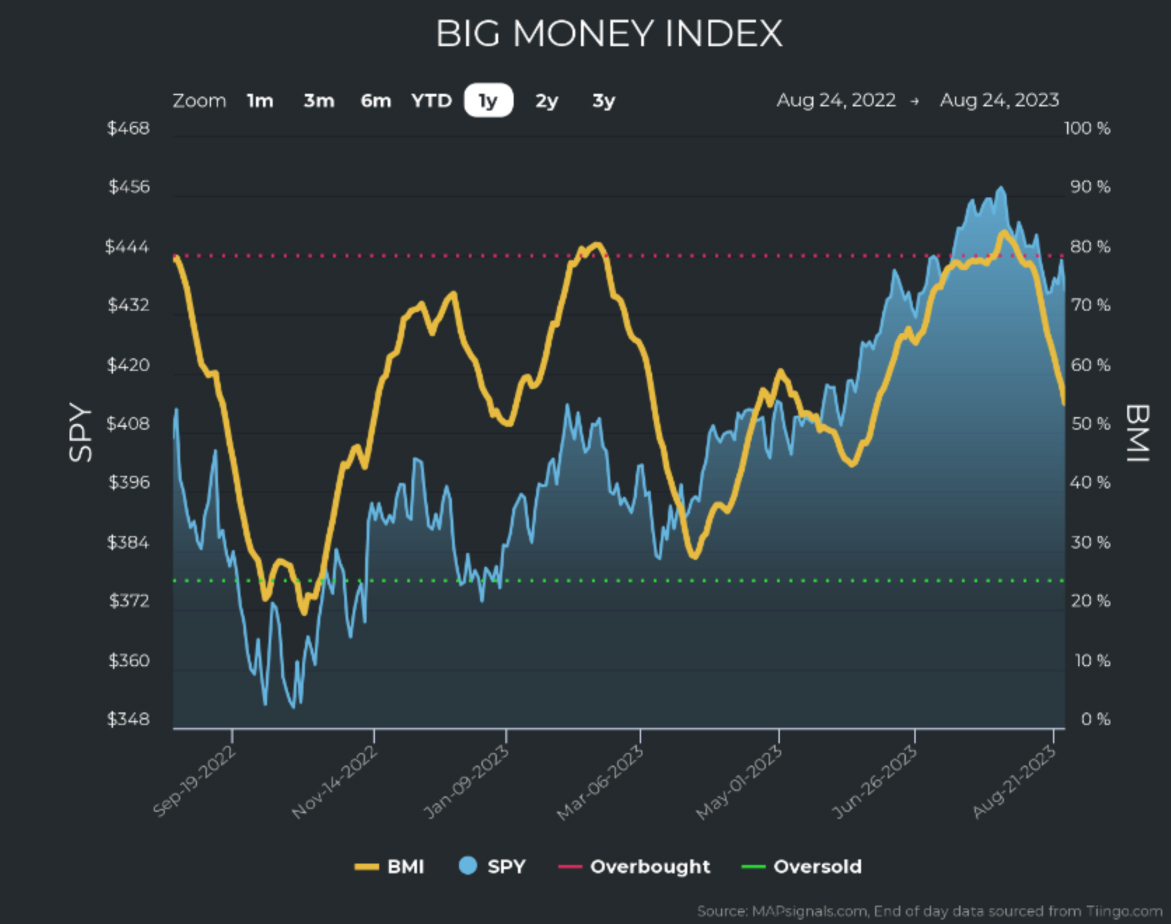
First, the Big Money Index went overbought and then promptly started falling. It doesn’t always do this. It once stayed overbought for nearly four months. But this time, it pierced overbought territory, then fell.
It is still falling sharply, as shown in our first MAPSignals chart:
Graphs are for illustrative and discussion purposes only. Please read important disclosures at the end of this commentary.
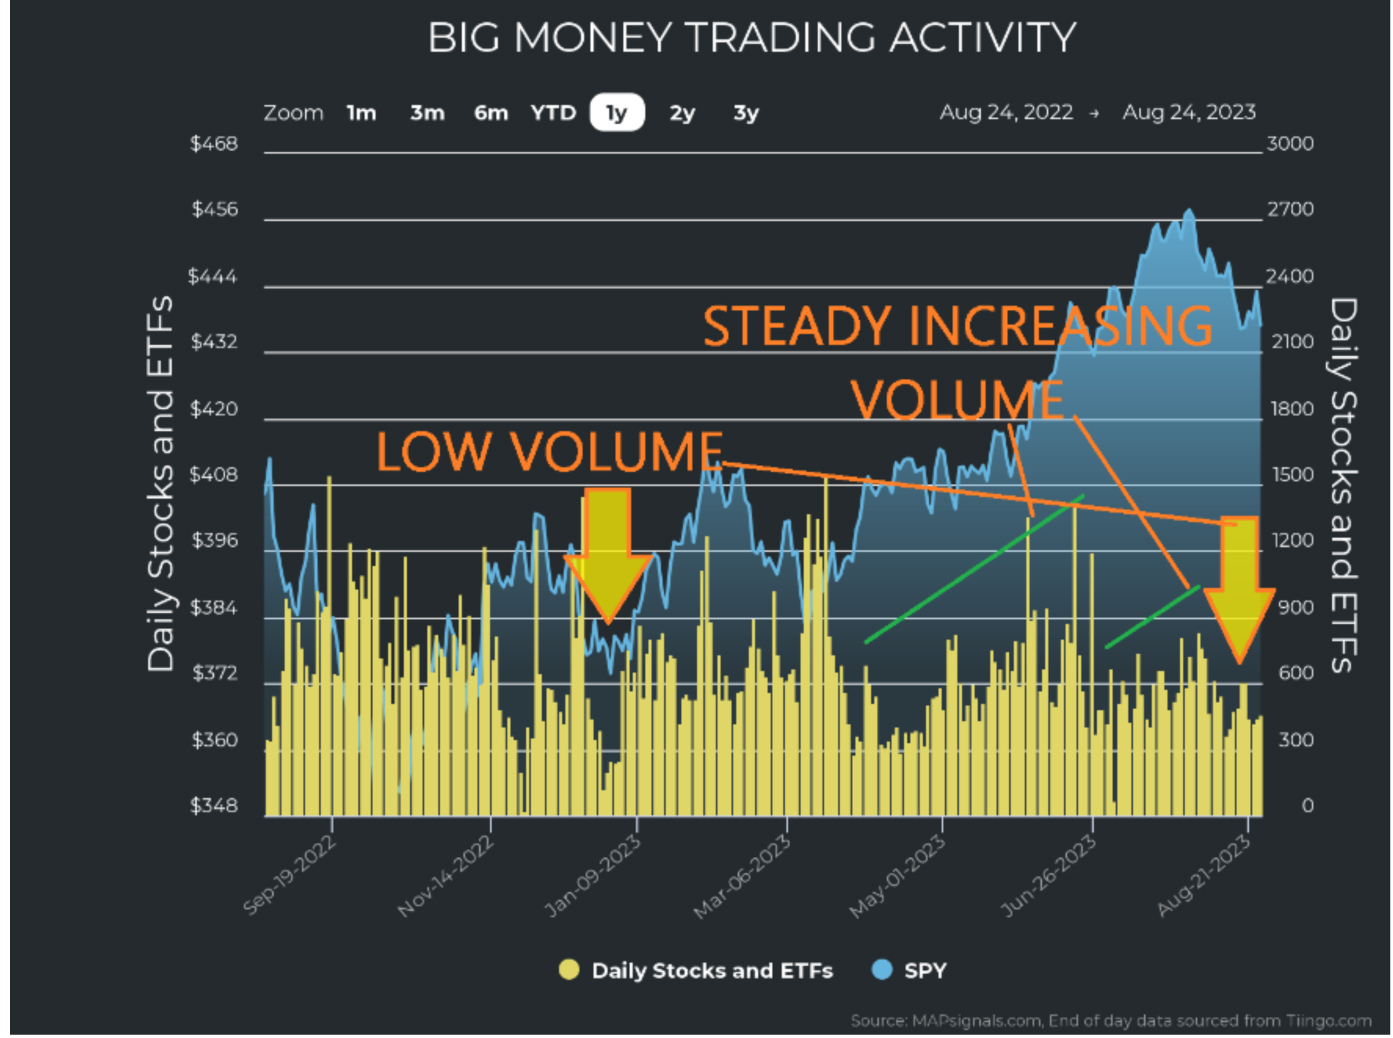
Now, it’s important to say that the BMI is falling more due to an absence of buying than due to accelerated selling. This can of course change at any time, but for now, as you can see below, buying shrank to virtually nothing but selling picked up only mildly for both stocks and ETFs:

Graphs are for illustrative and discussion purposes only. Please read important disclosures at the end of this commentary.
For the BMI to plummet to oversold levels, we will need to see very uncomfortable selling, reminiscent of March, which wasn’t fun. It’s also important to contextualize the recent trading activity. August is typically characterized by low volume. In the chart below, we can see that is definitely the case now.
The amber bars show the cumulative unusually large trades on any given day, according to MAPSignals data. We can use this as a proxy for institutional trading, or (more simply put): volume that matters.
We can see that much of the recent run up in stocks starting in April was accompanied with increasing unusual trading. We see the drop in the market in January was with seasonally usual low volumes.
Graphs are for illustrative and discussion purposes only. Please read important disclosures at the end of this commentary.
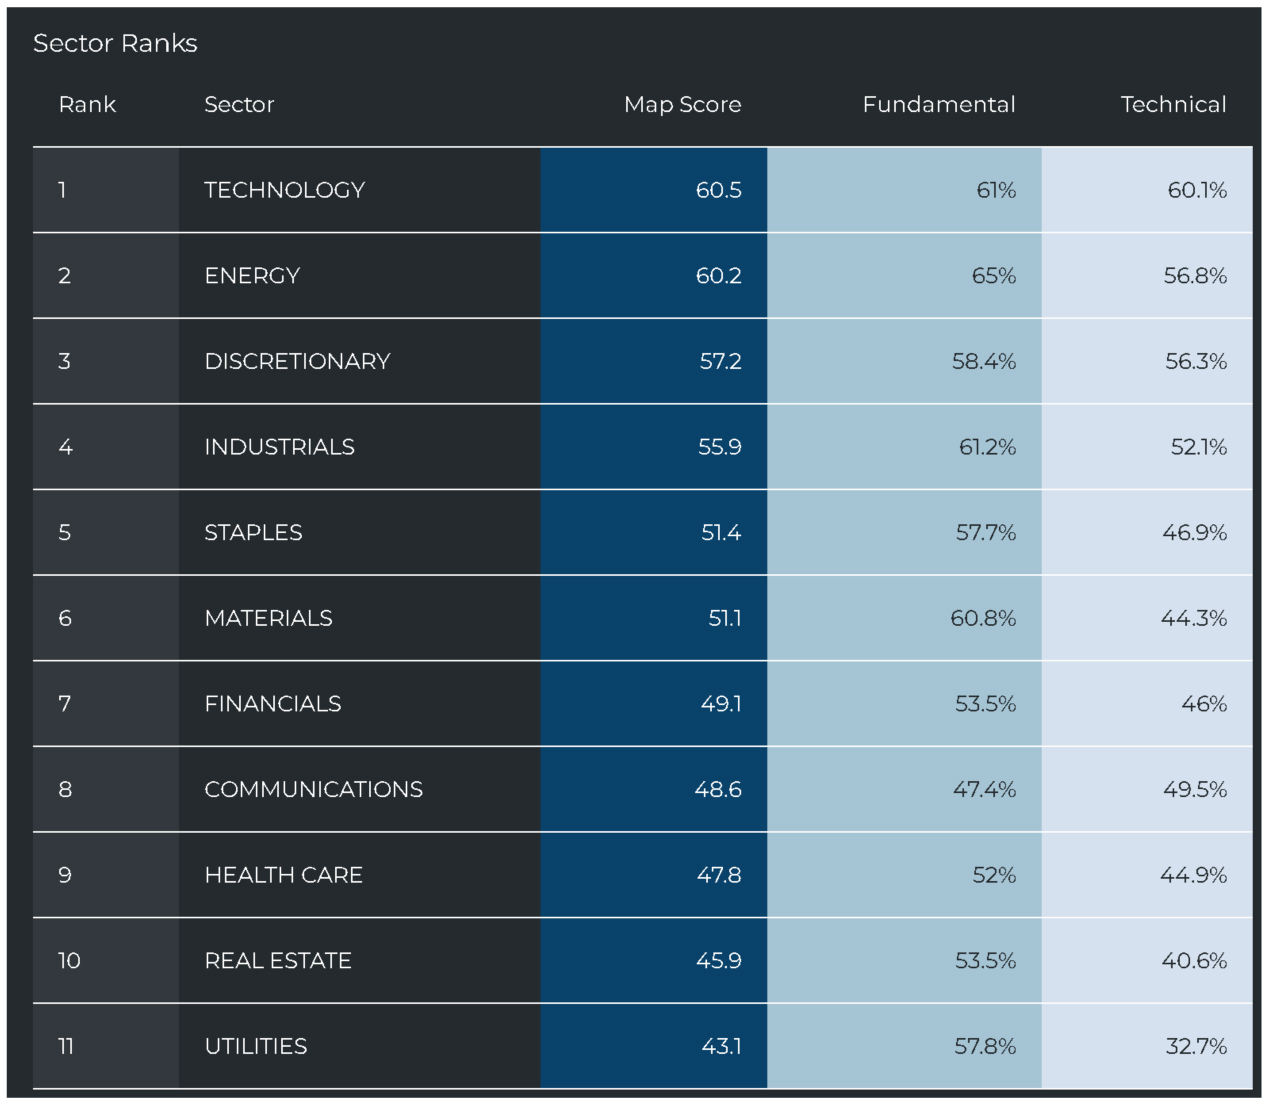
I’m not saying that an oversold BMI is assured, but should it come, it’s historically an excellent time to buy stocks. A quick glance at the sectors shows us that growth-oriented sectors, while recently feeling some pressure, are still the highest ranked. Tech, Energy, Discretionary, and Industrials are still the top four, while Real Estate and Utilities (rate-sensitive securities) are at the bottom:
Graphs are for illustrative and discussion purposes only. Please read important disclosures at the end of this commentary.
As far as buying or selling in individual sectors, we see that selling is hitting Discretionary and Staples with some significance. Recently, there hasn’t been much more buying, which is why the BMI is falling. (Remember when you see Communications, the results are amplified as the sector universe is very small).
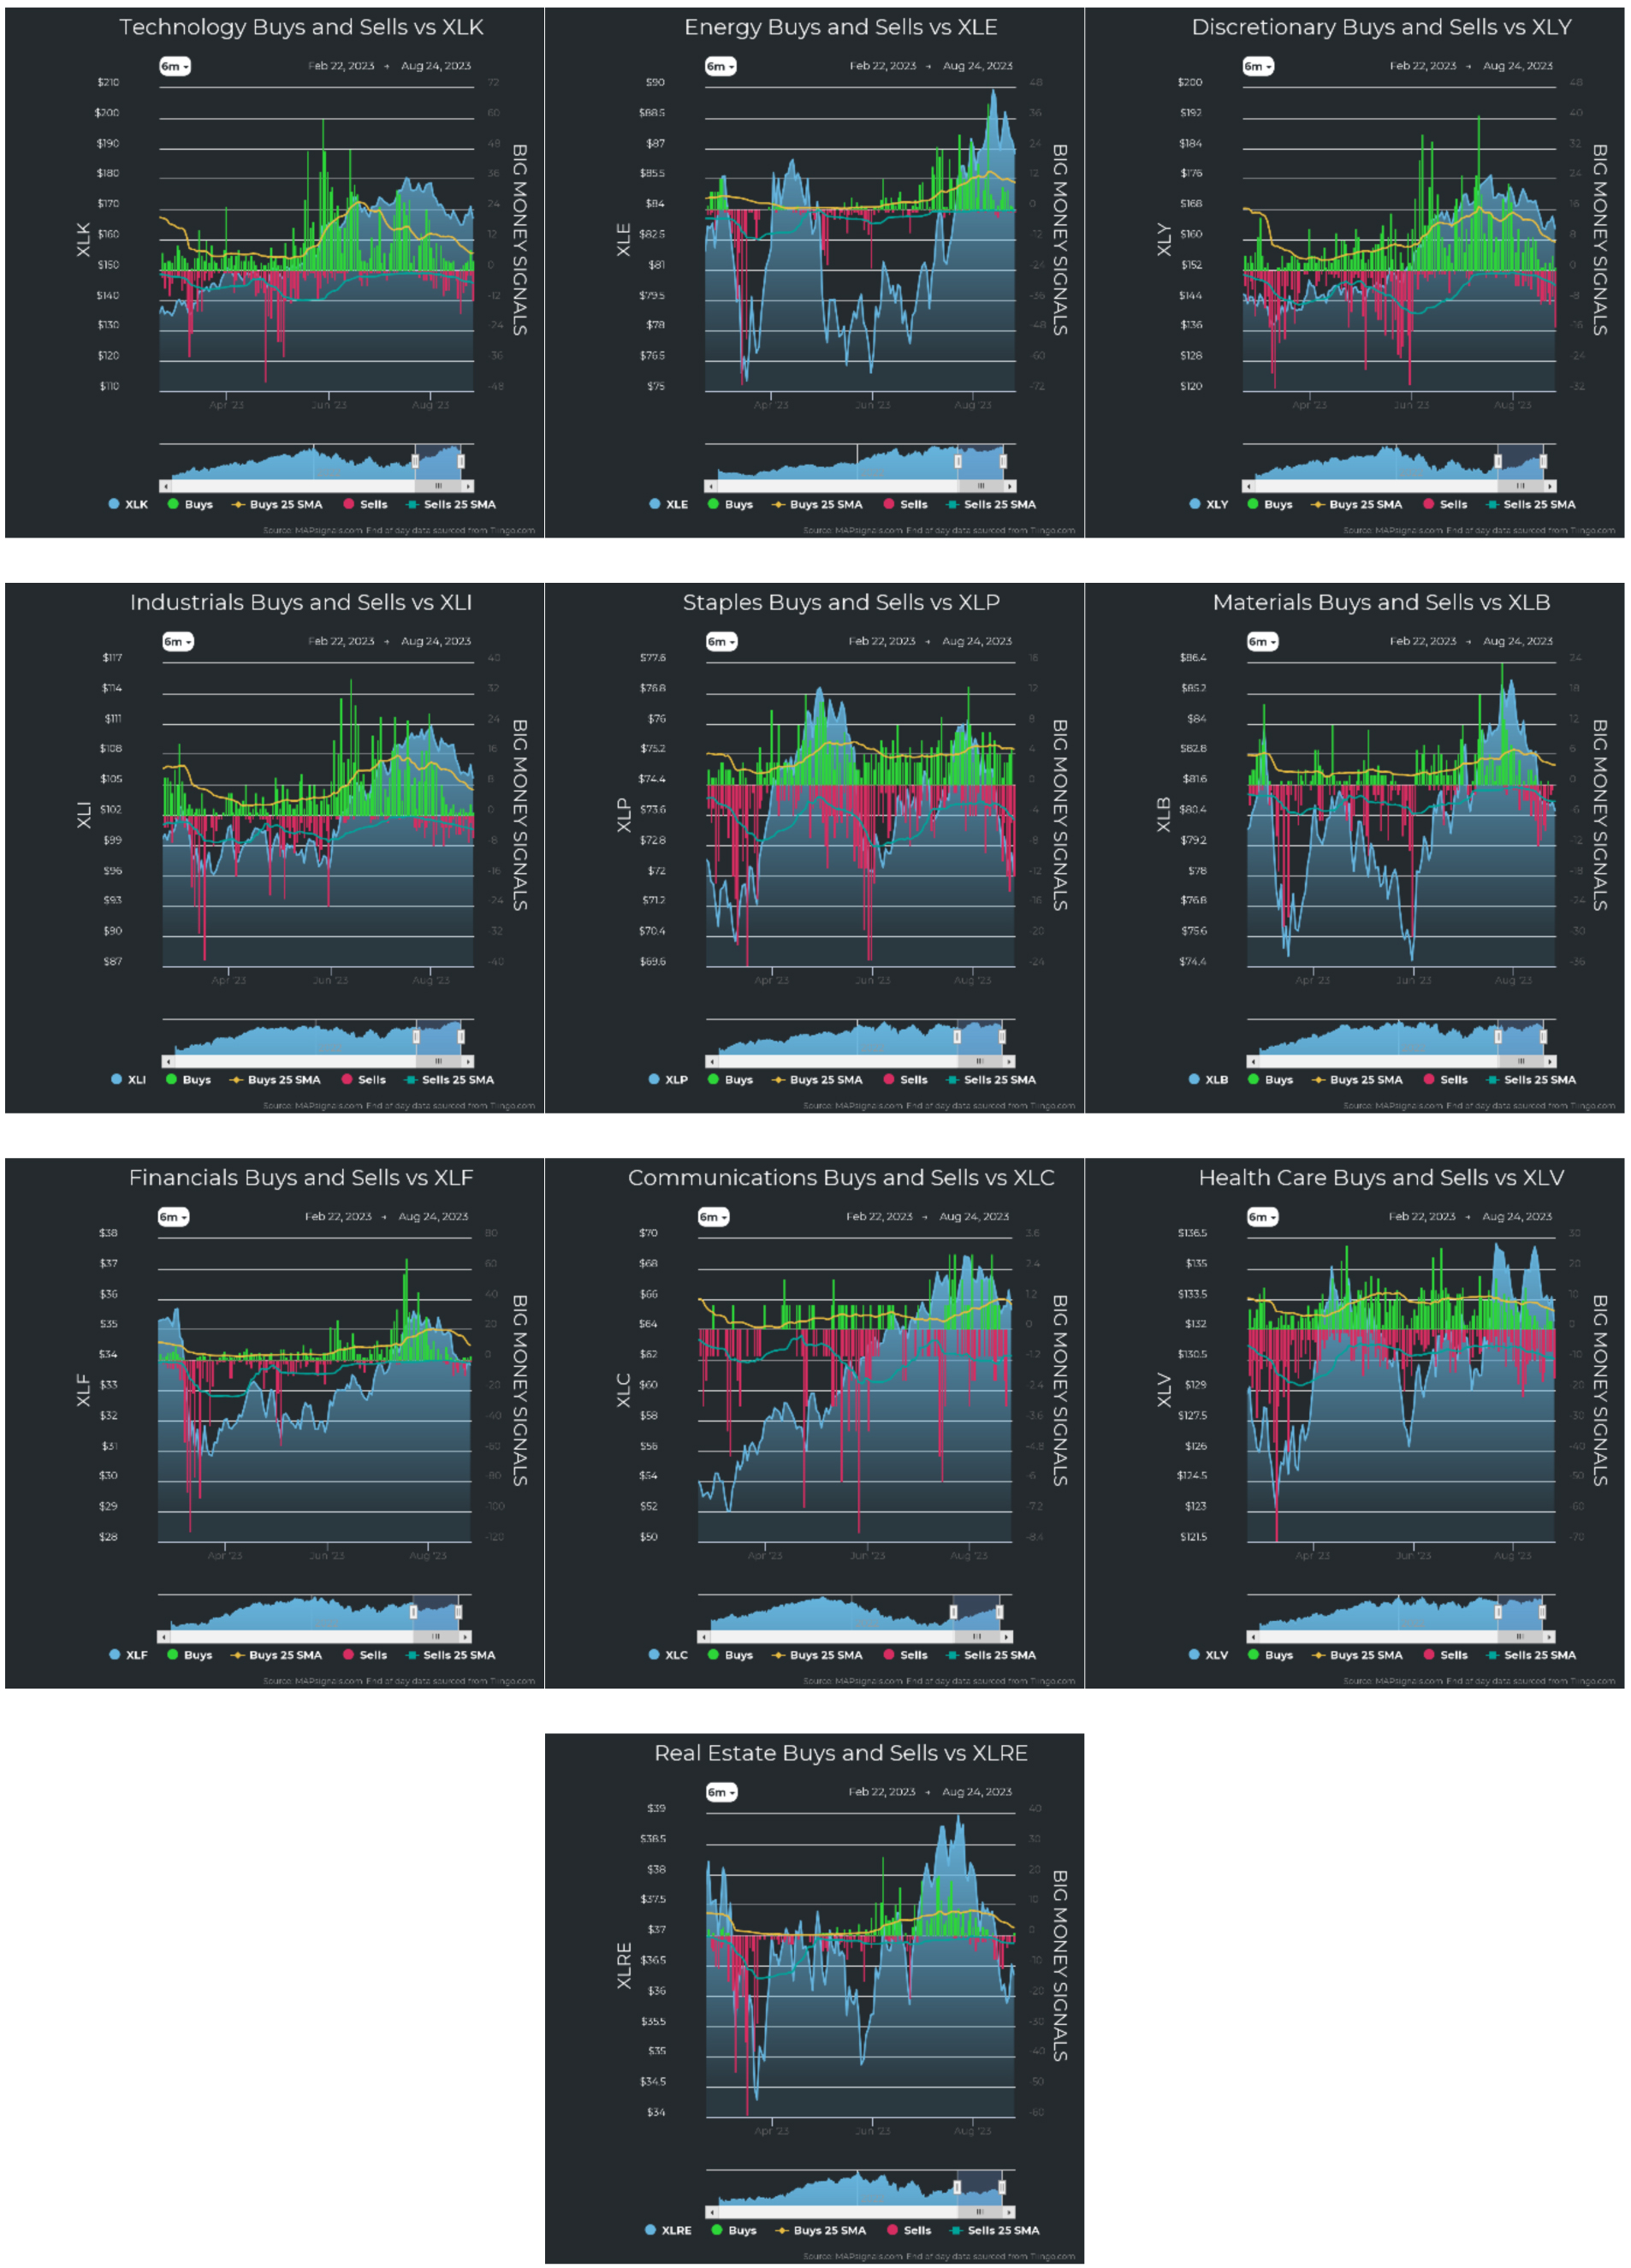
Graphs are for illustrative and discussion purposes only. Please read important disclosures at the end of this commentary.
The truth is that we are in the midst of summer madness. That’s life. The bright side is that we are halfway through this August/September volatility. By the middle of October, markets usually right themselves and lift into the end of the year. But it’s still summer. Enjoy what’s left of it, even if we must suffer through the market’s predictable hurricane season.
As Russell Baker said: “Ah, summer, what power you have to make us suffer … and like it.”
Navellier & Associates owns Nvidia Corp (NVDA), in managed accounts. Jason Bodner owns Nvidia Corp (NVDA), in a personal account.
All content above represents the opinion of Jason Bodner of Navellier & Associates, Inc.
Also In This Issue
A Look Ahead by Louis Navellier
Wall Street Likes to Add Volatility to the August Doldrums
Income Mail by Bryan Perry
Stocks Are Looking to Make Peace with The Bond Market
Growth Mail by Gary Alexander
Jerome Powell’s “Dream Speech” at Jackson Hole, 2025
Global Mail by Ivan Martchev
The Stock Market Reaches Another Fork in the Road
Sector Spotlight by Jason Bodner
Why Good Stocks Go Down in Price…on Good News
View Full Archive
Read Past Issues Here

Jason Bodner
MARKETMAIL EDITOR FOR SECTOR SPOTLIGHT
Jason Bodner writes Sector Spotlight in the weekly Marketmail publication and has authored several white papers for the company. He is also Co-Founder of Macro Analytics for Professionals which produces proprietary equity accumulation/distribution research for its clients. Previously, Mr. Bodner served as Director of European Equity Derivatives for Cantor Fitzgerald Europe in London, then moved to the role of Head of Equity Derivatives North America for the same company in New York. He also served as S.V.P. Equity Derivatives for Jefferies, LLC. He received a B.S. in business administration in 1996, with honors, from Skidmore College as a member of the Periclean Honors Society. All content of “Sector Spotlight” represents the opinion of Jason Bodner
Important Disclosures:
Jason Bodner is a co-founder and co-owner of Mapsignals. Mr. Bodner is an independent contractor who is occasionally hired by Navellier & Associates to write an article and or provide opinions for possible use in articles that appear in Navellier & Associates weekly Market Mail. Mr. Bodner is not employed or affiliated with Louis Navellier, Navellier & Associates, Inc., or any other Navellier owned entity. The opinions and statements made here are those of Mr. Bodner and not necessarily those of any other persons or entities. This is not an endorsement, or solicitation or testimonial or investment advice regarding the BMI Index or any statements or recommendations or analysis in the article or the BMI Index or Mapsignals or its products or strategies.
Although information in these reports has been obtained from and is based upon sources that Navellier believes to be reliable, Navellier does not guarantee its accuracy and it may be incomplete or condensed. All opinions and estimates constitute Navellier’s judgment as of the date the report was created and are subject to change without notice. These reports are for informational purposes only and are not a solicitation for the purchase or sale of a security. Any decision to purchase securities mentioned in these reports must take into account existing public information on such securities or any registered prospectus.To the extent permitted by law, neither Navellier & Associates, Inc., nor any of its affiliates, agents, or service providers assumes any liability or responsibility nor owes any duty of care for any consequences of any person acting or refraining to act in reliance on the information contained in this communication or for any decision based on it.
Past performance is no indication of future results. Investment in securities involves significant risk and has the potential for partial or complete loss of funds invested. It should not be assumed that any securities recommendations made by Navellier. in the future will be profitable or equal the performance of securities made in this report. Dividend payments are not guaranteed. The amount of a dividend payment, if any, can vary over time and issuers may reduce dividends paid on securities in the event of a recession or adverse event affecting a specific industry or issuer.
None of the stock information, data, and company information presented herein constitutes a recommendation by Navellier or a solicitation to buy or sell any securities. Any specific securities identified and described do not represent all of the securities purchased, sold, or recommended for advisory clients. The holdings identified do not represent all of the securities purchased, sold, or recommended for advisory clients and the reader should not assume that investments in the securities identified and discussed were or will be profitable.
Information presented is general information that does not take into account your individual circumstances, financial situation, or needs, nor does it present a personalized recommendation to you. Individual stocks presented may not be suitable for every investor. Investment in securities involves significant risk and has the potential for partial or complete loss of funds invested. Investment in fixed income securities has the potential for the investment return and principal value of an investment to fluctuate so that an investor’s holdings, when redeemed, may be worth less than their original cost.
One cannot invest directly in an index. Index is unmanaged and index performance does not reflect deduction of fees, expenses, or taxes. Presentation of Index data does not reflect a belief by Navellier that any stock index constitutes an investment alternative to any Navellier equity strategy or is necessarily comparable to such strategies. Among the most important differences between the Indices and Navellier strategies are that the Navellier equity strategies may (1) incur material management fees, (2) concentrate its investments in relatively few stocks, industries, or sectors, (3) have significantly greater trading activity and related costs, and (4) be significantly more or less volatile than the Indices.
ETF Risk: We may invest in exchange traded funds (“ETFs”) and some of our investment strategies are generally fully invested in ETFs. Like traditional mutual funds, ETFs charge asset-based fees, but they generally do not charge initial sales charges or redemption fees and investors typically pay only customary brokerage fees to buy and sell ETF shares. The fees and costs charged by ETFs held in client accounts will not be deducted from the compensation the client pays Navellier. ETF prices can fluctuate up or down, and a client account could lose money investing in an ETF if the prices of the securities owned by the ETF go down. ETFs are subject to additional risks:
- ETF shares may trade above or below their net asset value;
- An active trading market for an ETF’s shares may not develop or be maintained;
- The value of an ETF may be more volatile than the underlying portfolio of securities the ETF is designed to track;
- The cost of owning shares of the ETF may exceed those a client would incur by directly investing in the underlying securities; and
- Trading of an ETF’s shares may be halted if the listing exchange’s officials deem it appropriate, the shares are delisted from the exchange, or the activation of market-wide “circuit breakers” (which are tied to large decreases in stock prices) halts stock trading generally.
Grader Disclosures: Investment in equity strategies involves substantial risk and has the potential for partial or complete loss of funds invested. The sample portfolio and any accompanying charts are for informational purposes only and are not to be construed as a solicitation to buy or sell any financial instrument and should not be relied upon as the sole factor in an investment making decision. As a matter of normal and important disclosures to you, as a potential investor, please consider the following: The performance presented is not based on any actual securities trading, portfolio, or accounts, and the reported performance of the A, B, C, D, and F portfolios (collectively the “model portfolios”) should be considered mere “paper” or pro forma performance results based on Navellier’s research.
Investors evaluating any of Navellier & Associates, Inc.’s, (or its affiliates’) Investment Products must not use any information presented here, including the performance figures of the model portfolios, in their evaluation of any Navellier Investment Products. Navellier Investment Products include the firm’s mutual funds and managed accounts. The model portfolios, charts, and other information presented do not represent actual funded trades and are not actual funded portfolios. There are material differences between Navellier Investment Products’ portfolios and the model portfolios, research, and performance figures presented here. The model portfolios and the research results (1) may contain stocks or ETFs that are illiquid and difficult to trade; (2) may contain stock or ETF holdings materially different from actual funded Navellier Investment Product portfolios; (3) include the reinvestment of all dividends and other earnings, estimated trading costs, commissions, or management fees; and, (4) may not reflect prices obtained in an actual funded Navellier Investment Product portfolio. For these and other reasons, the reported performances of model portfolios do not reflect the performance results of Navellier’s actually funded and traded Investment Products. In most cases, Navellier’s Investment Products have materially lower performance results than the performances of the model portfolios presented.
This report contains statements that are, or may be considered to be, forward-looking statements. All statements that are not historical facts, including statements about our beliefs or expectations, are “forward-looking statements” within the meaning of The U.S. Private Securities Litigation Reform Act of 1995. These statements may be identified by such forward-looking terminology as “expect,” “estimate,” “plan,” “intend,” “believe,” “anticipate,” “may,” “will,” “should,” “could,” “continue,” “project,” or similar statements or variations of such terms. Our forward-looking statements are based on a series of expectations, assumptions, and projections, are not guarantees of future results or performance, and involve substantial risks and uncertainty as described in Form ADV Part 2A of our filing with the Securities and Exchange Commission (SEC), which is available at www.adviserinfo.sec.gov or by requesting a copy by emailing info@navellier.com. All of our forward-looking statements are as of the date of this report only. We can give no assurance that such expectations or forward-looking statements will prove to be correct. Actual results may differ materially. You are urged to carefully consider all such factors.
FEDERAL TAX ADVICE DISCLAIMER: As required by U.S. Treasury Regulations, you are informed that, to the extent this presentation includes any federal tax advice, the presentation is not written by Navellier to be used, and cannot be used, for the purpose of avoiding federal tax penalties. Navellier does not advise on any income tax requirements or issues. Use of any information presented by Navellier is for general information only and does not represent tax advice either express or implied. You are encouraged to seek professional tax advice for income tax questions and assistance.
IMPORTANT NEWSLETTER DISCLOSURE:The hypothetical performance results for investment newsletters that are authored or edited by Louis Navellier, including Louis Navellier’s Growth Investor, Louis Navellier’s Breakthrough Stocks, Louis Navellier’s Accelerated Profits, and Louis Navellier’s Platinum Club, are not based on any actual securities trading, portfolio, or accounts, and the newsletters’ reported hypothetical performances should be considered mere “paper” or proforma hypothetical performance results and are not actual performance of real world trades. Navellier & Associates, Inc. does not have any relation to or affiliation with the owner of these newsletters. There are material differences between Navellier Investment Products’ portfolios and the InvestorPlace Media, LLC newsletter portfolios authored by Louis Navellier. The InvestorPlace Media, LLC newsletters contain hypothetical performance that do not include transaction costs, advisory fees, or other fees a client might incur if actual investments and trades were being made by an investor. As a result, newsletter performance should not be used to evaluate Navellier Investment services which are separate and different from the newsletters. The owner of the newsletters is InvestorPlace Media, LLC and any questions concerning the newsletters, including any newsletter advertising or hypothetical Newsletter performance claims, (which are calculated solely by Investor Place Media and not Navellier) should be referred to InvestorPlace Media, LLC at (800) 718-8289.
Please note that Navellier & Associates and the Navellier Private Client Group are managed completely independent of the newsletters owned and published by InvestorPlace Media, LLC and written and edited by Louis Navellier, and investment performance of the newsletters should in no way be considered indicative of potential future investment performance for any Navellier & Associates separately managed account portfolio. Potential investors should consult with their financial advisor before investing in any Navellier Investment Product.
Navellier claims compliance with Global Investment Performance Standards (GIPS). To receive a complete list and descriptions of Navellier’s composites and/or a presentation that adheres to the GIPS standards, please contact Navellier or click here. It should not be assumed that any securities recommendations made by Navellier & Associates, Inc. in the future will be profitable or equal the performance of securities made in this report.
FactSet Disclosure: Navellier does not independently calculate the statistical information included in the attached report. The calculation and the information are provided by FactSet, a company not related to Navellier. Although information contained in the report has been obtained from FactSet and is based on sources Navellier believes to be reliable, Navellier does not guarantee its accuracy, and it may be incomplete or condensed. The report and the related FactSet sourced information are provided on an “as is” basis. The user assumes the entire risk of any use made of this information. Investors should consider the report as only a single factor in making their investment decision. The report is for informational purposes only and is not intended as an offer or solicitation for the purchase or sale of a security. FactSet sourced information is the exclusive property of FactSet. Without prior written permission of FactSet, this information may not be reproduced, disseminated or used to create any financial products. All indices are unmanaged and performance of the indices include reinvestment of dividends and interest income, unless otherwise noted, are not illustrative of any particular investment and an investment cannot be made in any index. Past performance is no guarantee of future results.