by Louis Navellier
June 13, 2023
Our friends at Bespoke Investment Group issued a report that showed the Russell 2000 has beaten the S&P 500 by 5% over a five-day period only seven times in history, and the eighth time happened last week. They looked at the gains of the two indexes over various time periods the previous seven times:
After the Russell 2000 Beat the S&P 500 by 5% in a 5-day period: What Happened Next?
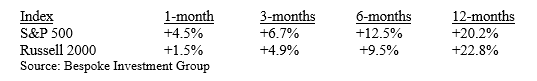
The good news is that both indexes tend to rise very well and consistently, with the S&P 500 rising the most at first, but both indexes rose over 20% on average in the year after the last seven occurrences.
As usual, we try to do even better by finding the crème de la creme in each market. The small-cap stocks we own are currently trading at only 4.7 times forecasted 2023 earnings, so I do not expect their price-to-earnings (P/E) ratios to be compressed much further, if at all. Furthermore, our small cap stocks boast 22% average forecasted sales growth and 82% forecasted earnings growth, at last count. And now, I expect to see more buying power, as much of the cash on the sidelines could pour into the stock market if investor confidence improves, boosted by the annual Russell Reconstitution that is triggering institutional buying pressure, aided by mounting evidence that a recession is less likely to occur this quarter or next.
The annual Russell Reconstitution has already caused many of our small cap stocks to surge, and institutional buying pressure is anticipated to filter down from the eight largest NASDAQ companies that have been hogging most of the money, as leaders of the AI craze. Outside of those eight tech stocks, there are many other great stocks, like Rambus, which recently surged over 30%, and Super Micro Computer that surged over 110% in just the past month during the AI feeding frenzy! As a result, I am expecting more institutional money to drive small cap stocks significantly higher in the upcoming weeks.
I am also getting a lot of questions about my big energy bet, so I want to tell you what is unfolding as summer officially begins next week. First, Russia did not follow through with its big 500,000 barrel daily cut in crude oil production that it pledged back in March, so excess Russian crude oil and refined products are being bought by China, India, Saudi Arabia, UAE, and several countries in Latin America.
Second, the annual wildfires in Alberta started early from lightning and are not expected to be put out until October, when the first snows fall, since the peat in the soil makes any fire hard to put out. This limits Canada’s crude oil output. Before Memorial Day weekend, inventories of crude oil and gasoline were depleted to five-year lows, so crude oil prices are poised to rise as seasonal demand rises during the summer months. Finally, Saudi Arabia announced an additional 1 million barrel per day production cut, effective in July, in addition to the 1.6 million OPEC+ production cut that was announced in early April.
The OPEC+ meeting in Vienna on June 4th did not go well after Saudi Arabia pushed other OPEC nations to curtail their crude oil output. As a result, Saudi Arabia is accounting for 2 million of the 2.6 million in crude oil production cuts that OPEC+ has announced. It is widely perceived that Saudi Arabia needs $80 per barrel crude oil to balance its budget, so it is obvious that it is now desperate to curtail production.
I should add that there are an estimated 413 wildfires in Canada that have burned 82 million acres, which is 13 times worse than the average for this time of year vs. the past decade. Seizing a political opportunity, Prime Minister Justin Trudeau said, “Year after year, with climate change, we’re seeing more and more intense wildfires in places where they don’t normally happen.” Trudeau has deployed Canada’s Armed Forces, but the truth of the matter is that lightning strikes caused the vast majority of these fires, so there is little that Trudeau can do to stop lightning. He is using climate change as a scapegoat to grab even more power.
Despite these horrific wildfires that have curtailed Canadian crude oil production, North America and South America are producing more crude oil, which is one reason why The Wall Street Journal noted that the five largest U.S. energy companies are characterized by record cash flow, vigorous stock buy-backs, and an eagerness to make more acquisitions. Guyana is the most exciting crude oil production area, since its output of 400,000 barrels per day is expected to triple to 1.2 million barrels per day by 2027.
This rising crude oil output in the Americas, plus Russia effectively circumventing sanctions by selling 80% of its heavy sour crude oil to China and India to be refined and resold as petroleum products, is one reason why oil speculators have temporarily succeeded in suppressing crude oil prices. However, supply and demand cannot be circumvented forever by tricks and political games, so I am still optimistic that crude oil prices will meander higher in the summer months when there is seasonally peak demand.
In the meantime, the hideous smoke from Canadian wildfires over the Northeast has interrupted air traffic and is reducing energy demand, which should allow refineries to replace depleted inventories. In addition, China’s April trade data was horrible, with exports and imports both declining, so their second-quarter GDP growth is highly questionable, and the eurozone is officially in a recession due to an economic contraction in Germany and Ireland. This trend toward slower global growth keeps energy demand down.
Another interesting anomaly that should impact crude oil prices long-term is that in recent months, after China and Germany dropped their electric vehicle (EV) incentives, EV sales moderated, so a lot of the excess EV inventory has been dumped in the U.S., which is why Audi and Mercedes are offering special leases and other incentives to move unsold EVs. In California, with high state gasoline taxes, EVs make sense, since EV owners can drive in the HOV lanes and there are plenty of charging stations. However, outside of California and other deep-blue states, EVs are not selling well, and customers are defiantly sticking with internal combustion engines. In fact, Ford is ready to convert back to internal combustion engines if customers demand them, despite the F-150 Lightening and other innovative EVs, like Mach-e.
I should add that the primary reason that EVs are popular in China is that the vehicles are cheaper and utilize predominantly iron-phosphate (LFP) batteries. CATL in China dominates LFP batteries and has 39% of the world’s battery market share, followed by LG Energy with a 15% market share.
A new battery technology is poised to capture more market share, which is a lithium iron manganese phosphate (LMFP) battery by Gotion High-Tech, which is a Chinese company that has VW Group as its largest shareholder. These LMFP batteries have approximately 26% higher energy density than LFP batteries and cost about 5% less than an LFP battery to manufacture, so a new generation of cheaper batteries is expected to lower EV costs slightly in the upcoming years, especially VW Group’s EVs.
Recent Economic Indicators Point to a More Restrained U.S. Consumer
Complicating vehicle sales are high interest rates and a consumer that is reluctant to buy high-priced durable goods. For example, the Conference Board announced that its consumer confidence index slipped to 102.3 in May, down from a revised 103.7 in April. The expectations and present situation components both declined in May and contributed to declining consumer confidence. Interestingly, the employment component also declined, which means that consumers are less confident about finding a job. Overall, consumer confidence is now at a six-month low and indicative that most consumers remain cautious.
Another reason why the auto industry is struggling is that the manufacturing sector is already in recession (while the larger service sector is not). The Institute of Supply Management (ISM) announced that its manufacturing index declined to 46.9 in May from 47.1 in April, the seventh straight month that the ISM manufacturing index has been below 50, the mark which indicates a contraction. The new orders index plunged to 42.6 in May, down from 45.7 in April. Even worse, the backlog component collapsed to 37.5 in May, down from 43.1 in April. The prices component plunged to 44.2 in May, down from 53.2 in April, which indicates that wholesale prices continue to decline – a “silver lining” of sharply-declining inflation.
If the Fed is looking for an excuse to delay interest rate hikes this week, the ISM manufacturing report should be a good reason, since only four of the 18 industries ISM surveyed reported any expansion.
ISM also announced that its non-manufacturing (service) index declined to 50.3 in May, down from 51.9 in April. This was well below the economists’ consensus expectation of 51.8, so the ISM miss was a big disappointment. The big drop was partially attributable to the huge (9-point) “backlog of orders” drop to 40.9, from 49.7 in April. The price component declined to 56.2 in May, down from 59.6 in April, which is a good sign – that service inflation is cooling off. The other silver lining is that the new order component was 52.9 in May, down from 56.1 in April, but still above 50, indicative of expansion. Overall, 11 of the 18 service industries that ISM surveyed reported expansion in May, so the service sector is still growing.
The Commerce Department announced on Wednesday that the trade deficit rose 23.1% to $74.6 billion in April as exports declined 3.6% to $249 billion and imports rose 1.5% to $323.6 billion. This widening trade deficit is now at the highest in six months and may cause economists to lower their second-quarter GDP forecast. However, the Atlanta Fed on Wednesday raised its second-quarter GDP estimate to +2.2%.
The Labor Department announced on Thursday that weekly jobless claims rose to 261,000 in the latest week, up from a revised 233,000 in the previous week. Continuing claims reached 1.757 million in the latest week, vs. a revised 1.72 million in the previous week. Weekly jobless claims were significantly higher than the economists’ consensus expectation of 235,000, causing concern among some economists.
The FOMC Meets This Week and Will Likely “Pause” on Rate Increases – Finally!
I am on record that the Federal Open Market Committee (FOMC) meeting this week will be the first time the Fed has not raised key interest rates after 10 straight key interest rate hikes. The Fed rate remains above market rates based on Treasury yields and there are a lot of outspoken doves on the Fed – from Chicago, Minneapolis, San Francisco, and other influential Fed districts. Although Fed Chairman Jerome Powell likes the FOMC to agree, recent FOMC minutes revealed disagreement within the FOMC.
One of the factors that might alarm the FOMC is that the unemployment rate rose to 3.7% in May, up from 3.4% in April, as 440,000 new workers entered the job market. Another factor is that inflation is expected to decelerate rapidly in the next couple of months, since the big CPI increases from May and June 2022 will be “cut off” from the trailing 12-month data, so the annual pace of the CPI may be under 3% by mid-July. As a result of inflation cooling, the Fed can afford to pause on any further rate hikes.
The Treasury Department is refinancing about $1.1 trillion in securities. Most of the sales will be on the short end of the yield curve, where yields are higher. This “sweet spot” between the 3-month and 6-month Treasury yield curve should account for the majority of refinancing. Naturally, I will carefully watch the “bid to cover ratio” on these Treasury auctions. Typically, a 2.6 bid to coverage ratio is a healthy auction, while a 2.2 ratio could be problematic, causing yields to rise. Since this refinancing is so massive, it will be closely scrutinized. I am expecting a successful series of auctions due to all the cash on the sidelines.
Before wrapping up, I should mention that the fighting between Russia and Ukraine may have to wait for another day – or month – due to the big Kakhovka dam break in Ukraine that is flooding so much land that it will effectively postpose a Ukrainian counteroffensive to oust Russian troops. Ukraine is blaming Russia for the blast at a hydroelectric dam that is now threatening the largest nuclear plant in Europe.
Another blast on an ammonia pipeline is sending fertilizer and wheat prices higher. Russian forces were shelling flooded residents in the city of Kherson as they were being evacuated. Ironically, the flooding on the Dnipro River is also causing both Ukrainian and Russian troops to retreat. Hundreds of thousands of people are at risk, so a cease fire may ensue, as rescue efforts take priority and Russian troops pull back.
Kherson had been occupied by Russian forces for eight months. Ukrainian forces were on the West side of the Dnipro, while Russian forces were on the East side. Since the Dnipro is impassable, fighting has stopped. The Kakhovka reservoir provides drinking water to the Russian-occupied Crimean Peninsula.
On his new Twitter program, Tucker Carlson accused Ukraine of causing the Kakhovka dam break. Whether or not this is true (we still don’t know the source of the explosion of the Nord Stream 2 pipeline, even though the investigation has been closed), if Ukraine did cause the Kakhovka dam break, it may cause NATO support to erode, since a massive human tragedy has unfolded in Southern Ukraine.
In conclusion, whatever investors were worried about, there is suddenly less to worry about, now that (1) the debt ceiling has been lifted, (2) inflation is cooling, (3) the Fed may pause at its June FOMC meeting, (4) the U.S. economy is growing, although slowly, (5) fighting may decrease in Ukraine for much of the summer, due to the recent dam break, and (6) corporate earnings are finally on the road to recovery.
The truth of the matter is that many stock investors are convinced by the press and the bears to be scared of their own shadow and reluctant to invest, but most of the old excuses not to invest have disappeared.
Navellier & Associates owns Volkswagen Ag. (VWAGY), Rambus Inc. (RMBS), and Super Micro Computer, Inc. (SMCI), in managed accounts. We do not own Ford Motor Co (F), in managed accounts. Louis Navellier and his family personally own Volkswagen Ag. (VWAGY), Rambus Inc. (RMBS), and Super Micro Computer, Inc. (SMCI), via a Navellier managed account.
All content above represents the opinion of Louis Navellier of Navellier & Associates, Inc.
Also In This Issue
A Look Ahead by Louis Navellier
Small Caps and Energy Stocks Still Look Good
Income Mail by Bryan Perry
Investors Taking a Year-End View Should Be Well Rewarded
Growth Mail by Gary Alexander
As Adam Smith Turns 300 (With Marx at 205 & Keynes 140), Who’s Winning?
Global Mail by Ivan Martchev
Watch Jobless Claims – and Beware Bitcoin
Sector Spotlight by Jason Bodner
Are You Still Waiting for the “Next Shoe to Drop?”
View Full Archive
Read Past Issues Here

Louis Navellier
CHIEF INVESTMENT OFFICER
Louis Navellier is Founder, Chairman of the Board, Chief Investment Officer and Chief Compliance Officer of Navellier & Associates, Inc., located in Reno, Nevada. With decades of experience translating what had been purely academic techniques into real market applications, he believes that disciplined, quantitative analysis can select stocks that will significantly outperform the overall market. All content in this “A Look Ahead” section of Market Mail represents the opinion of Louis Navellier of Navellier & Associates, Inc.
Important Disclosures:
Although information in these reports has been obtained from and is based upon sources that Navellier believes to be reliable, Navellier does not guarantee its accuracy and it may be incomplete or condensed. All opinions and estimates constitute Navellier’s judgment as of the date the report was created and are subject to change without notice. These reports are for informational purposes only and are not a solicitation for the purchase or sale of a security. Any decision to purchase securities mentioned in these reports must take into account existing public information on such securities or any registered prospectus.To the extent permitted by law, neither Navellier & Associates, Inc., nor any of its affiliates, agents, or service providers assumes any liability or responsibility nor owes any duty of care for any consequences of any person acting or refraining to act in reliance on the information contained in this communication or for any decision based on it.
Past performance is no indication of future results. Investment in securities involves significant risk and has the potential for partial or complete loss of funds invested. It should not be assumed that any securities recommendations made by Navellier. in the future will be profitable or equal the performance of securities made in this report. Dividend payments are not guaranteed. The amount of a dividend payment, if any, can vary over time and issuers may reduce dividends paid on securities in the event of a recession or adverse event affecting a specific industry or issuer.
None of the stock information, data, and company information presented herein constitutes a recommendation by Navellier or a solicitation to buy or sell any securities. Any specific securities identified and described do not represent all of the securities purchased, sold, or recommended for advisory clients. The holdings identified do not represent all of the securities purchased, sold, or recommended for advisory clients and the reader should not assume that investments in the securities identified and discussed were or will be profitable.
Information presented is general information that does not take into account your individual circumstances, financial situation, or needs, nor does it present a personalized recommendation to you. Individual stocks presented may not be suitable for every investor. Investment in securities involves significant risk and has the potential for partial or complete loss of funds invested. Investment in fixed income securities has the potential for the investment return and principal value of an investment to fluctuate so that an investor’s holdings, when redeemed, may be worth less than their original cost.
One cannot invest directly in an index. Index is unmanaged and index performance does not reflect deduction of fees, expenses, or taxes. Presentation of Index data does not reflect a belief by Navellier that any stock index constitutes an investment alternative to any Navellier equity strategy or is necessarily comparable to such strategies. Among the most important differences between the Indices and Navellier strategies are that the Navellier equity strategies may (1) incur material management fees, (2) concentrate its investments in relatively few stocks, industries, or sectors, (3) have significantly greater trading activity and related costs, and (4) be significantly more or less volatile than the Indices.
ETF Risk: We may invest in exchange traded funds (“ETFs”) and some of our investment strategies are generally fully invested in ETFs. Like traditional mutual funds, ETFs charge asset-based fees, but they generally do not charge initial sales charges or redemption fees and investors typically pay only customary brokerage fees to buy and sell ETF shares. The fees and costs charged by ETFs held in client accounts will not be deducted from the compensation the client pays Navellier. ETF prices can fluctuate up or down, and a client account could lose money investing in an ETF if the prices of the securities owned by the ETF go down. ETFs are subject to additional risks:
- ETF shares may trade above or below their net asset value;
- An active trading market for an ETF’s shares may not develop or be maintained;
- The value of an ETF may be more volatile than the underlying portfolio of securities the ETF is designed to track;
- The cost of owning shares of the ETF may exceed those a client would incur by directly investing in the underlying securities; and
- Trading of an ETF’s shares may be halted if the listing exchange’s officials deem it appropriate, the shares are delisted from the exchange, or the activation of market-wide “circuit breakers” (which are tied to large decreases in stock prices) halts stock trading generally.
Grader Disclosures: Investment in equity strategies involves substantial risk and has the potential for partial or complete loss of funds invested. The sample portfolio and any accompanying charts are for informational purposes only and are not to be construed as a solicitation to buy or sell any financial instrument and should not be relied upon as the sole factor in an investment making decision. As a matter of normal and important disclosures to you, as a potential investor, please consider the following: The performance presented is not based on any actual securities trading, portfolio, or accounts, and the reported performance of the A, B, C, D, and F portfolios (collectively the “model portfolios”) should be considered mere “paper” or pro forma performance results based on Navellier’s research.
Investors evaluating any of Navellier & Associates, Inc.’s, (or its affiliates’) Investment Products must not use any information presented here, including the performance figures of the model portfolios, in their evaluation of any Navellier Investment Products. Navellier Investment Products include the firm’s mutual funds and managed accounts. The model portfolios, charts, and other information presented do not represent actual funded trades and are not actual funded portfolios. There are material differences between Navellier Investment Products’ portfolios and the model portfolios, research, and performance figures presented here. The model portfolios and the research results (1) may contain stocks or ETFs that are illiquid and difficult to trade; (2) may contain stock or ETF holdings materially different from actual funded Navellier Investment Product portfolios; (3) include the reinvestment of all dividends and other earnings, estimated trading costs, commissions, or management fees; and, (4) may not reflect prices obtained in an actual funded Navellier Investment Product portfolio. For these and other reasons, the reported performances of model portfolios do not reflect the performance results of Navellier’s actually funded and traded Investment Products. In most cases, Navellier’s Investment Products have materially lower performance results than the performances of the model portfolios presented.
This report contains statements that are, or may be considered to be, forward-looking statements. All statements that are not historical facts, including statements about our beliefs or expectations, are “forward-looking statements” within the meaning of The U.S. Private Securities Litigation Reform Act of 1995. These statements may be identified by such forward-looking terminology as “expect,” “estimate,” “plan,” “intend,” “believe,” “anticipate,” “may,” “will,” “should,” “could,” “continue,” “project,” or similar statements or variations of such terms. Our forward-looking statements are based on a series of expectations, assumptions, and projections, are not guarantees of future results or performance, and involve substantial risks and uncertainty as described in Form ADV Part 2A of our filing with the Securities and Exchange Commission (SEC), which is available at www.adviserinfo.sec.gov or by requesting a copy by emailing info@navellier.com. All of our forward-looking statements are as of the date of this report only. We can give no assurance that such expectations or forward-looking statements will prove to be correct. Actual results may differ materially. You are urged to carefully consider all such factors.
FEDERAL TAX ADVICE DISCLAIMER: As required by U.S. Treasury Regulations, you are informed that, to the extent this presentation includes any federal tax advice, the presentation is not written by Navellier to be used, and cannot be used, for the purpose of avoiding federal tax penalties. Navellier does not advise on any income tax requirements or issues. Use of any information presented by Navellier is for general information only and does not represent tax advice either express or implied. You are encouraged to seek professional tax advice for income tax questions and assistance.
IMPORTANT NEWSLETTER DISCLOSURE:The hypothetical performance results for investment newsletters that are authored or edited by Louis Navellier, including Louis Navellier’s Growth Investor, Louis Navellier’s Breakthrough Stocks, Louis Navellier’s Accelerated Profits, and Louis Navellier’s Platinum Club, are not based on any actual securities trading, portfolio, or accounts, and the newsletters’ reported hypothetical performances should be considered mere “paper” or proforma hypothetical performance results and are not actual performance of real world trades. Navellier & Associates, Inc. does not have any relation to or affiliation with the owner of these newsletters. There are material differences between Navellier Investment Products’ portfolios and the InvestorPlace Media, LLC newsletter portfolios authored by Louis Navellier. The InvestorPlace Media, LLC newsletters contain hypothetical performance that do not include transaction costs, advisory fees, or other fees a client might incur if actual investments and trades were being made by an investor. As a result, newsletter performance should not be used to evaluate Navellier Investment services which are separate and different from the newsletters. The owner of the newsletters is InvestorPlace Media, LLC and any questions concerning the newsletters, including any newsletter advertising or hypothetical Newsletter performance claims, (which are calculated solely by Investor Place Media and not Navellier) should be referred to InvestorPlace Media, LLC at (800) 718-8289.
Please note that Navellier & Associates and the Navellier Private Client Group are managed completely independent of the newsletters owned and published by InvestorPlace Media, LLC and written and edited by Louis Navellier, and investment performance of the newsletters should in no way be considered indicative of potential future investment performance for any Navellier & Associates separately managed account portfolio. Potential investors should consult with their financial advisor before investing in any Navellier Investment Product.
Navellier claims compliance with Global Investment Performance Standards (GIPS). To receive a complete list and descriptions of Navellier’s composites and/or a presentation that adheres to the GIPS standards, please contact Navellier or click here. It should not be assumed that any securities recommendations made by Navellier & Associates, Inc. in the future will be profitable or equal the performance of securities made in this report.
FactSet Disclosure: Navellier does not independently calculate the statistical information included in the attached report. The calculation and the information are provided by FactSet, a company not related to Navellier. Although information contained in the report has been obtained from FactSet and is based on sources Navellier believes to be reliable, Navellier does not guarantee its accuracy, and it may be incomplete or condensed. The report and the related FactSet sourced information are provided on an “as is” basis. The user assumes the entire risk of any use made of this information. Investors should consider the report as only a single factor in making their investment decision. The report is for informational purposes only and is not intended as an offer or solicitation for the purchase or sale of a security. FactSet sourced information is the exclusive property of FactSet. Without prior written permission of FactSet, this information may not be reproduced, disseminated or used to create any financial products. All indices are unmanaged and performance of the indices include reinvestment of dividends and interest income, unless otherwise noted, are not illustrative of any particular investment and an investment cannot be made in any index. Past performance is no guarantee of future results.