by Bryan Perry
June 13, 2023
The stock market is finally starting to broaden out from the AI-related Magnificent 7 (or Elite 8) mega-cap tech stocks that have hoarded most of the fund flows in the 2023 rally that has led the S&P 500 to its next resistance level at 4,300. Even though roughly one-third of the S&P 500 companies trade below their 50-day moving average, there is improvement in the NYSE Advance/Decline Line in the past two weeks.
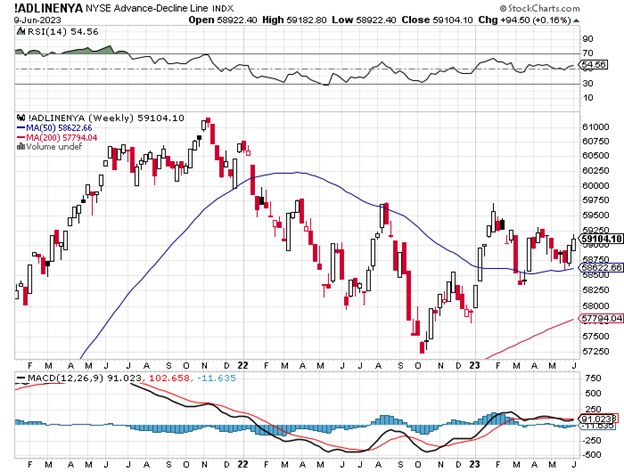
Graphs are for illustrative and discussion purposes only. Please read important disclosures at the end of this commentary.
To be quite frank, there isn’t much keeping the S&P 500 from challenging 4,500 (4.7% higher) or Nasdaq trading up to 14,000 (5.5% higher) by Labor Day – if a couple more hurdles are cleared. They include this week’s May inflation data (CPI and PPI) coming in at or below forecast, followed by the Fed pausing their rate increases at this week’s FOMC meeting. Currently, about 70% of those surveyed are forecasting the Fed will keep the Fed Funds rate at 5.00%-5.25%. The Fed will have the luxury of getting both inflation reports before they issue their rate decision tomorrow at 2:00 pm Eastern time.
The business of forecasting much further in this current economic backdrop is a major challenge, given the wide-ranging set of data points showing pockets of real strength (home construction, technology, healthcare, infrastructure) and real deterioration (manufacturing, commercial real estate, retail sales). Retail sales are not adjusted for inflation, so the key takeaway from the 0.2% bump in the April report is that total retail sales were up primarily due to price increases, and not due much to increased demand.
I am more encouraged by forward-looking charts that bode well for the economy in 2024 – namely the forecast for inflation and product shortages showing marked improvement by later this year. A recent Q2 Global Economic Outlook report by Capital Economics assumes that tightening credit criteria will rein in lending, thereby adversely impacting companies and households and raise our cost of living.
A May 31 Reuters report lent credibility to this forecast: “U.S. domestic banks reported a widespread tightening of lending standards by the end of the first quarter of 2023 – even before the full impact of the regional banking crisis had been felt. Stricter lending criteria are likely to slow the flow of credit to small businesses and households – amplifying the impact of interest rate increases by the Federal Reserve over the last year. The net percentage of domestic banks tightening standards for commercial and industrial loans to small businesses with annual sales below $50 million hit +47% at the end of the first quarter.”
China’s reopening boost is now largely over with their recovery being weaker than anticipated and there haven’t been any new major stimulus plans announced, which some cite as a major reason why oil prices failed to get a boost from the latest OPEC+ production cut of one million barrels per day, and news of the U.S. intending to restock the Strategic Petroleum Reserve. Although crude oil still trades around $70 per barrel, it is starting to look like the predictions of $100 per barrel this summer may not be realized.
And yet energy companies will still produce plenty of profits if crude stays above $65, while cheaper oil and gas prices have a healing influence on the rate of inflation, as well as the normalization of global supply chains affecting the cost of goods and commodities. Both lower energy prices and the alleviation of product supply shortages should contribute to lowering inflation.
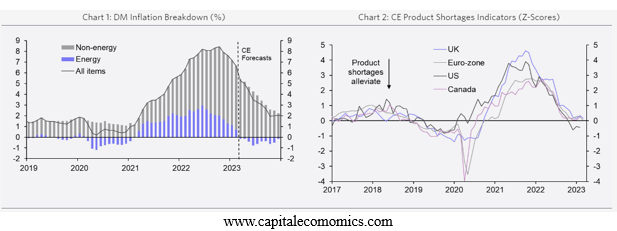
Graphs are for illustrative and discussion purposes only. Please read important disclosures at the end of this commentary.
Hopefully, the May inflation data this week will reflect these key price inputs and the Fed can take a breather. Suffice it to say that only about 50% of the rate hikes have worked their way through the system, so it is a good time to see just what kind of impact tighter lending standards on banks will have on consumer spending and capital expenditures for small-to-medium-sized businesses.
The recent banking crisis just might have done the rest of the heavy lifting for the Fed, and that will all come in the May and June data. Additionally, end-of-quarter window dressing begins this week with a war chest of cash on the sidelines. According to Investment Company Institute (ICI), as of June 8, 2023, the total money market fund assets increased by $36.63 billion to $5.46 trillion for the week ended Wednesday, June 7. Among taxable money market funds, government funds increased by $18.01 billion and prime funds increased by $15.78 billion. Tax-exempt money market funds increased by $2.84 billion.
Professional fund managers holding huge cash weightings are likely spending more time in the restroom biting their fists as the “pain trade” takes the market higher as the quarter comes to a close, with second-quarter earnings season just ahead. These fund managers must be the 30% that believe the Fed will hike again and hopefully let some air out of the current rally. That, and being a bystander as the Russell 2000 has rallied by 6% since June 1 – while keeping a lot of cash – is keeping cash-rich investors up at night.
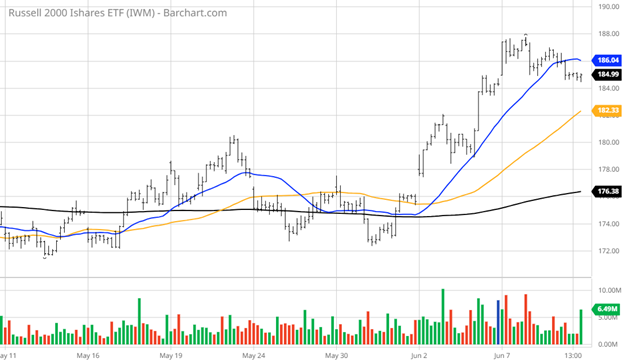
Graphs are for illustrative and discussion purposes only. Please read important disclosures at the end of this commentary.
Is the rally in the risk-on Russell stocks just another false breakout – like the last three attempts going back to July 2022? That’s hard to say, but it is safe to say, we won’t have to wait too long to find out.
All content above represents the opinion of Bryan Perry of Navellier & Associates, Inc.
Also In This Issue
A Look Ahead by Louis Navellier
Small Caps and Energy Stocks Still Look Good
Income Mail by Bryan Perry
Investors Taking a Year-End View Should Be Well Rewarded
Growth Mail by Gary Alexander
As Adam Smith Turns 300 (With Marx at 205 & Keynes 140), Who’s Winning?
Global Mail by Ivan Martchev
Watch Jobless Claims – and Beware Bitcoin
Sector Spotlight by Jason Bodner
Are You Still Waiting for the “Next Shoe to Drop?”
View Full Archive
Read Past Issues Here

Bryan Perry
SENIOR DIRECTOR
Bryan Perry is a Senior Director with Navellier Private Client Group, advising and facilitating high net worth investors in the pursuit of their financial goals.
Bryan’s financial services career spanning the past three decades includes over 20 years of wealth management experience with Wall Street firms that include Bear Stearns, Lehman Brothers and Paine Webber, working with both retail and institutional clients. Bryan earned a B.A. in Political Science from Virginia Polytechnic Institute & State University and currently holds a Series 65 license. All content of “Income Mail” represents the opinion of Bryan Perry
Important Disclosures:
Although information in these reports has been obtained from and is based upon sources that Navellier believes to be reliable, Navellier does not guarantee its accuracy and it may be incomplete or condensed. All opinions and estimates constitute Navellier’s judgment as of the date the report was created and are subject to change without notice. These reports are for informational purposes only and are not a solicitation for the purchase or sale of a security. Any decision to purchase securities mentioned in these reports must take into account existing public information on such securities or any registered prospectus.To the extent permitted by law, neither Navellier & Associates, Inc., nor any of its affiliates, agents, or service providers assumes any liability or responsibility nor owes any duty of care for any consequences of any person acting or refraining to act in reliance on the information contained in this communication or for any decision based on it.
Past performance is no indication of future results. Investment in securities involves significant risk and has the potential for partial or complete loss of funds invested. It should not be assumed that any securities recommendations made by Navellier. in the future will be profitable or equal the performance of securities made in this report. Dividend payments are not guaranteed. The amount of a dividend payment, if any, can vary over time and issuers may reduce dividends paid on securities in the event of a recession or adverse event affecting a specific industry or issuer.
None of the stock information, data, and company information presented herein constitutes a recommendation by Navellier or a solicitation to buy or sell any securities. Any specific securities identified and described do not represent all of the securities purchased, sold, or recommended for advisory clients. The holdings identified do not represent all of the securities purchased, sold, or recommended for advisory clients and the reader should not assume that investments in the securities identified and discussed were or will be profitable.
Information presented is general information that does not take into account your individual circumstances, financial situation, or needs, nor does it present a personalized recommendation to you. Individual stocks presented may not be suitable for every investor. Investment in securities involves significant risk and has the potential for partial or complete loss of funds invested. Investment in fixed income securities has the potential for the investment return and principal value of an investment to fluctuate so that an investor’s holdings, when redeemed, may be worth less than their original cost.
One cannot invest directly in an index. Index is unmanaged and index performance does not reflect deduction of fees, expenses, or taxes. Presentation of Index data does not reflect a belief by Navellier that any stock index constitutes an investment alternative to any Navellier equity strategy or is necessarily comparable to such strategies. Among the most important differences between the Indices and Navellier strategies are that the Navellier equity strategies may (1) incur material management fees, (2) concentrate its investments in relatively few stocks, industries, or sectors, (3) have significantly greater trading activity and related costs, and (4) be significantly more or less volatile than the Indices.
ETF Risk: We may invest in exchange traded funds (“ETFs”) and some of our investment strategies are generally fully invested in ETFs. Like traditional mutual funds, ETFs charge asset-based fees, but they generally do not charge initial sales charges or redemption fees and investors typically pay only customary brokerage fees to buy and sell ETF shares. The fees and costs charged by ETFs held in client accounts will not be deducted from the compensation the client pays Navellier. ETF prices can fluctuate up or down, and a client account could lose money investing in an ETF if the prices of the securities owned by the ETF go down. ETFs are subject to additional risks:
- ETF shares may trade above or below their net asset value;
- An active trading market for an ETF’s shares may not develop or be maintained;
- The value of an ETF may be more volatile than the underlying portfolio of securities the ETF is designed to track;
- The cost of owning shares of the ETF may exceed those a client would incur by directly investing in the underlying securities; and
- Trading of an ETF’s shares may be halted if the listing exchange’s officials deem it appropriate, the shares are delisted from the exchange, or the activation of market-wide “circuit breakers” (which are tied to large decreases in stock prices) halts stock trading generally.
Grader Disclosures: Investment in equity strategies involves substantial risk and has the potential for partial or complete loss of funds invested. The sample portfolio and any accompanying charts are for informational purposes only and are not to be construed as a solicitation to buy or sell any financial instrument and should not be relied upon as the sole factor in an investment making decision. As a matter of normal and important disclosures to you, as a potential investor, please consider the following: The performance presented is not based on any actual securities trading, portfolio, or accounts, and the reported performance of the A, B, C, D, and F portfolios (collectively the “model portfolios”) should be considered mere “paper” or pro forma performance results based on Navellier’s research.
Investors evaluating any of Navellier & Associates, Inc.’s, (or its affiliates’) Investment Products must not use any information presented here, including the performance figures of the model portfolios, in their evaluation of any Navellier Investment Products. Navellier Investment Products include the firm’s mutual funds and managed accounts. The model portfolios, charts, and other information presented do not represent actual funded trades and are not actual funded portfolios. There are material differences between Navellier Investment Products’ portfolios and the model portfolios, research, and performance figures presented here. The model portfolios and the research results (1) may contain stocks or ETFs that are illiquid and difficult to trade; (2) may contain stock or ETF holdings materially different from actual funded Navellier Investment Product portfolios; (3) include the reinvestment of all dividends and other earnings, estimated trading costs, commissions, or management fees; and, (4) may not reflect prices obtained in an actual funded Navellier Investment Product portfolio. For these and other reasons, the reported performances of model portfolios do not reflect the performance results of Navellier’s actually funded and traded Investment Products. In most cases, Navellier’s Investment Products have materially lower performance results than the performances of the model portfolios presented.
This report contains statements that are, or may be considered to be, forward-looking statements. All statements that are not historical facts, including statements about our beliefs or expectations, are “forward-looking statements” within the meaning of The U.S. Private Securities Litigation Reform Act of 1995. These statements may be identified by such forward-looking terminology as “expect,” “estimate,” “plan,” “intend,” “believe,” “anticipate,” “may,” “will,” “should,” “could,” “continue,” “project,” or similar statements or variations of such terms. Our forward-looking statements are based on a series of expectations, assumptions, and projections, are not guarantees of future results or performance, and involve substantial risks and uncertainty as described in Form ADV Part 2A of our filing with the Securities and Exchange Commission (SEC), which is available at www.adviserinfo.sec.gov or by requesting a copy by emailing info@navellier.com. All of our forward-looking statements are as of the date of this report only. We can give no assurance that such expectations or forward-looking statements will prove to be correct. Actual results may differ materially. You are urged to carefully consider all such factors.
FEDERAL TAX ADVICE DISCLAIMER: As required by U.S. Treasury Regulations, you are informed that, to the extent this presentation includes any federal tax advice, the presentation is not written by Navellier to be used, and cannot be used, for the purpose of avoiding federal tax penalties. Navellier does not advise on any income tax requirements or issues. Use of any information presented by Navellier is for general information only and does not represent tax advice either express or implied. You are encouraged to seek professional tax advice for income tax questions and assistance.
IMPORTANT NEWSLETTER DISCLOSURE:The hypothetical performance results for investment newsletters that are authored or edited by Louis Navellier, including Louis Navellier’s Growth Investor, Louis Navellier’s Breakthrough Stocks, Louis Navellier’s Accelerated Profits, and Louis Navellier’s Platinum Club, are not based on any actual securities trading, portfolio, or accounts, and the newsletters’ reported hypothetical performances should be considered mere “paper” or proforma hypothetical performance results and are not actual performance of real world trades. Navellier & Associates, Inc. does not have any relation to or affiliation with the owner of these newsletters. There are material differences between Navellier Investment Products’ portfolios and the InvestorPlace Media, LLC newsletter portfolios authored by Louis Navellier. The InvestorPlace Media, LLC newsletters contain hypothetical performance that do not include transaction costs, advisory fees, or other fees a client might incur if actual investments and trades were being made by an investor. As a result, newsletter performance should not be used to evaluate Navellier Investment services which are separate and different from the newsletters. The owner of the newsletters is InvestorPlace Media, LLC and any questions concerning the newsletters, including any newsletter advertising or hypothetical Newsletter performance claims, (which are calculated solely by Investor Place Media and not Navellier) should be referred to InvestorPlace Media, LLC at (800) 718-8289.
Please note that Navellier & Associates and the Navellier Private Client Group are managed completely independent of the newsletters owned and published by InvestorPlace Media, LLC and written and edited by Louis Navellier, and investment performance of the newsletters should in no way be considered indicative of potential future investment performance for any Navellier & Associates separately managed account portfolio. Potential investors should consult with their financial advisor before investing in any Navellier Investment Product.
Navellier claims compliance with Global Investment Performance Standards (GIPS). To receive a complete list and descriptions of Navellier’s composites and/or a presentation that adheres to the GIPS standards, please contact Navellier or click here. It should not be assumed that any securities recommendations made by Navellier & Associates, Inc. in the future will be profitable or equal the performance of securities made in this report.
FactSet Disclosure: Navellier does not independently calculate the statistical information included in the attached report. The calculation and the information are provided by FactSet, a company not related to Navellier. Although information contained in the report has been obtained from FactSet and is based on sources Navellier believes to be reliable, Navellier does not guarantee its accuracy, and it may be incomplete or condensed. The report and the related FactSet sourced information are provided on an “as is” basis. The user assumes the entire risk of any use made of this information. Investors should consider the report as only a single factor in making their investment decision. The report is for informational purposes only and is not intended as an offer or solicitation for the purchase or sale of a security. FactSet sourced information is the exclusive property of FactSet. Without prior written permission of FactSet, this information may not be reproduced, disseminated or used to create any financial products. All indices are unmanaged and performance of the indices include reinvestment of dividends and interest income, unless otherwise noted, are not illustrative of any particular investment and an investment cannot be made in any index. Past performance is no guarantee of future results.