by Jason Bodner
June 13, 2023
I have something to say to those who are waiting for the next market shoe to drop and are still sitting out the expected coming crash (or recession). I say: The data says you’re going to miss out on more gains.
Here’s why: As the old saying goes: “Once bitten, twice shy.”
That saying implies: “Pay attention! Don’t do that again!” It’s about getting burned and learning your lesson. But is painful experience really the best teacher?
Look at the case of Bill Haast, a renowned snake handler and scientist. He spent his life working with poisonous snakes. He led an extraordinary life dedicated to studying and working with poisonous snakes. He was famous for being fearless when handling the world’s deadliest snakes. He was bitten 173 times. Not only did he not die from it – in fact, he lived to the ripe old age of 100!
How did he do that? Well, he inoculated himself with small amounts of venom over long periods of time and thereby built up resistance to the toxins. If he followed the “Once bitten, twice shy” adage, he likely wouldn’t have pursued his passion, and most certainly wouldn’t have lived as long as he did!
As investors, we too have a choice on how to handle getting bitten. Let’s face it: Bad times happen to all investors. Show me a person who bats 1,000 and I’ll introduce to you to the next Bernie Madoff. The question is how we deal with losses and, more importantly, what will these losses teach us?
Oddly enough, right now is an excellent opportunity for self-assessment as stock investors. Apart from a very few winners, most investors got hammered sometime in the first three quarters of 2022. Many exited their positions to raise cash. Intuitively, that made sense: Protect what’s left and live to fight another day.
But right now, some regret may start to seep in. The stock market has rallied significantly from its October lows. Tech led the rally, and it has been stunning. Here are some index rallies from the lows made October 12, 2022. I’ve highlighted the top performers. The PHLX semiconductors index rallied an astonishing 62.5%! The Nasdaq 100 is up 35.75% and a couple of S&P sectors are also up over 30%.
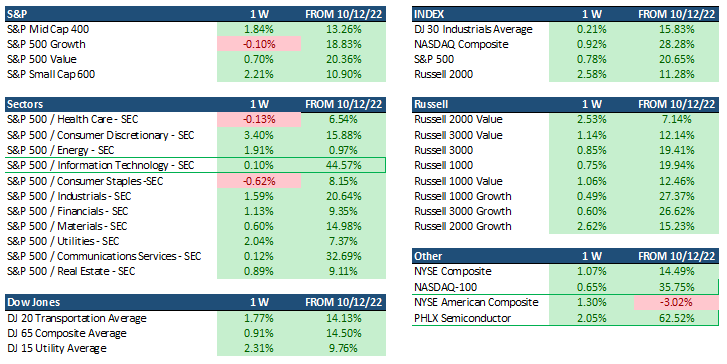
Graphs are for illustrative and discussion purposes only. Please read important disclosures at the end of this commentary.
It might have felt good to “sidestep the coming pain,” but now it’s not looking so hot. This regret invariably morphs into FOMO – which is when bears start to capitulate. “Fear of missing out” (FOMO) is a form of regret for those who said, “Once bitten, twice shy” and decided to sit out the bear market.
Like I said: those waiting it out might be making a big mistake. Let’s look at the data and see why…
I always like to start with the Big Money Index, a 25-day moving average of all unusual buy and sell signals. It gives us a great indication of big institutional money flows. It was falling for much of April and May. Despite that, the S&P 500 was rising. I explained that was due to the immense buying pressure of tech stocks. That sector single handedly propped up the market. But suddenly, the BMI is rising again.
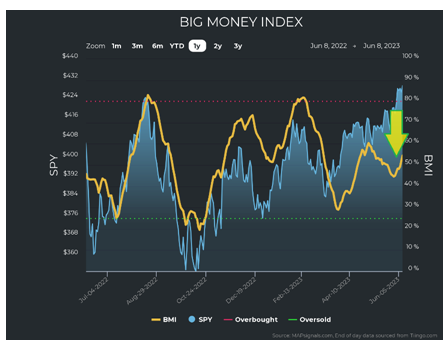
Graphs are for illustrative and discussion purposes only. Please read important disclosures at the end of this commentary.
The data has recently shifted. Selling has essentially vanished into thin air. Here we see an intensifying of buying of stocks coupled with a sudden vacuum of selling:
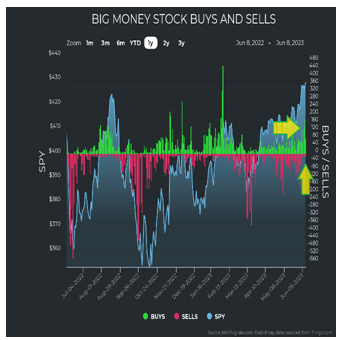
Graphs are for illustrative and discussion purposes only. Please read important disclosures at the end of this commentary.
You may be thinking: That could just be tech stocks holding the market up again. But you would be wrong. Buying in small cap stocks over the last week (as of Friday morning) has been immense.
Look at this cross section of buying (divided by market cap) and you’ll see what I mean:
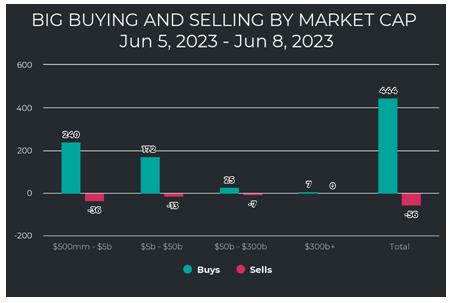
Graphs are for illustrative and discussion purposes only. Please read important disclosures at the end of this commentary.
Now let’s compare that last week’s chart to market cap buying and selling for all of May:
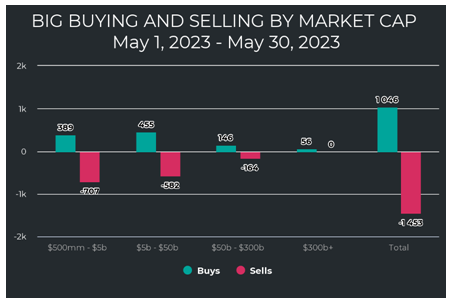
Graphs are for illustrative and discussion purposes only. Please read important disclosures at the end of this commentary.
There is a clear shift – from selling small-cap and mid-cap (in May) to buying (in June)!
Now let’s dig into the sectors to see if it’s only tech holding up this market. To spare you the suspense: It isn’t. Not only is each sector rising in price, but the buying is measurable in every sector.
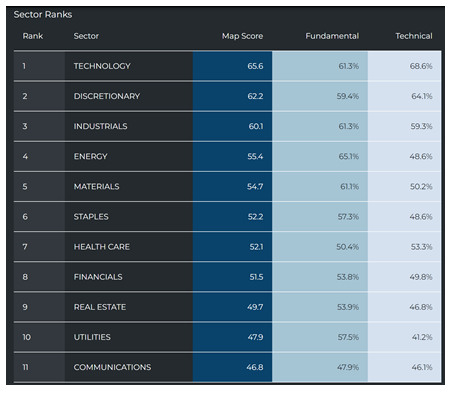
First let’s look at how they rank in our system:
Graphs are for illustrative and discussion purposes only. Please read important disclosures at the end of this commentary.
The growth sectors are still on top: Tech, Discretionary, and Industrials. There is also visible buying in each sector lately. This is inherently very constructive for a new bull market:
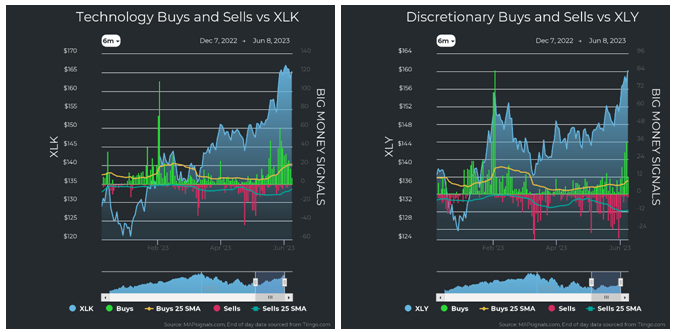
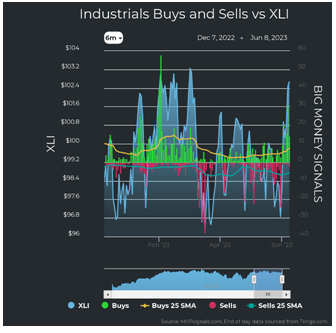
Graphs are for illustrative and discussion purposes only. Please read important disclosures at the end of this commentary.
Energy has seen a bit of a resurgence, in part due to news of the expected Saudi output reduction, along with some green buying. Materials saw immense selling, which we pointed out as a major reversion signal. And, as if on cue, the sector had a massive bounce and even exhibited new buying:
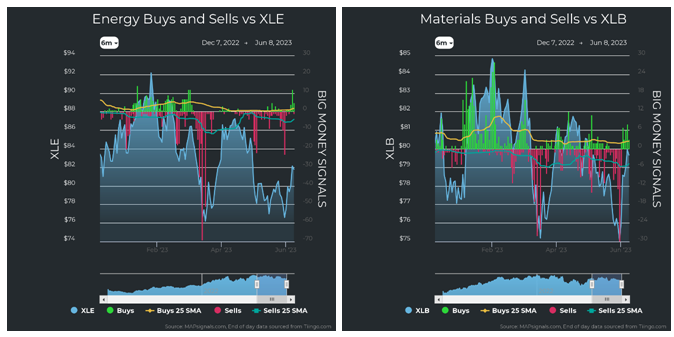
Graphs are for illustrative and discussion purposes only. Please read important disclosures at the end of this commentary.
Moving into the lower tiers of sector rankings, we see signs of buying. Staples and Health Care have been muddling along after some pressure, but suddenly we see fresh green shoots of buying even here. And remember when our global financial system was going to collapse because of our failed regional banks, back in March? Well, what didn’t seem possible in March is happening now: Buying financials stocks:
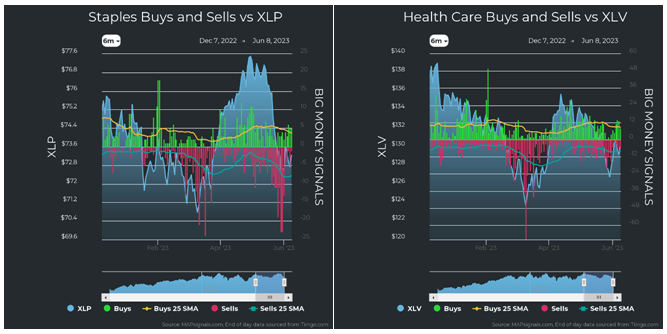
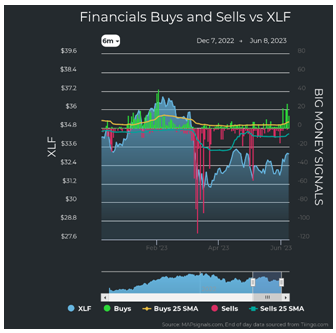
Graphs are for illustrative and discussion purposes only. Please read important disclosures at the end of this commentary.
Now as we make our way to the sector rankings basement, we still see signs of buying and, perhaps more importantly, less selling. Real Estate, Utilities, and even Communications show signs of firming up:
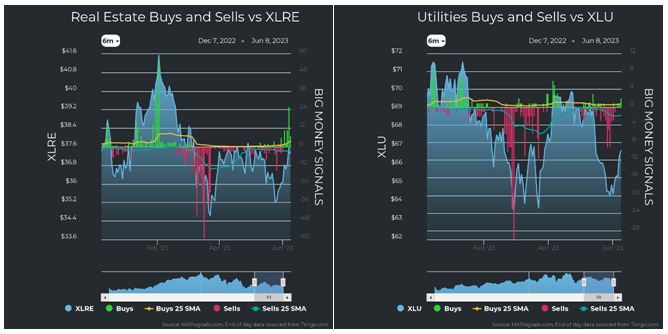
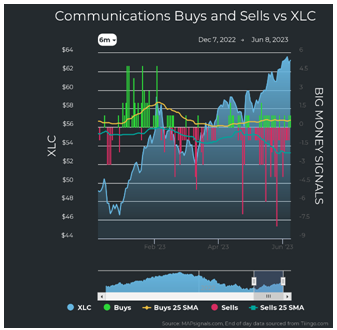
Graphs are for illustrative and discussion purposes only. Please read important disclosures at the end of this commentary.
We are seeing signs of buying under the surface across the board. Market caps that were previously under pressure are getting snatched up. And in so doing, investors are lifting nearly all the sectors. The story of Tech holding up the market could have turned to one where the market tumbled after tech cracked. But the opposite happened: Tech stayed strong and everything is running faster now, trying to catch up.
The new bull market is here, believe it or not. The data says so and so does the official definition of a bull market. Investors could continue to sit out for fear of being bitten, but our data says they’ll likely miss out on more gains. Once bitten, twice shy doesn’t work, unless you take the right precautions first.
Let’s follow Bill Haast and try what Mari Mancusi said: “Once bitten, totally smitten.”
All content above represents the opinion of Jason Bodner of Navellier & Associates, Inc.
Also In This Issue
A Look Ahead by Louis Navellier
Small Caps and Energy Stocks Still Look Good
Income Mail by Bryan Perry
Investors Taking a Year-End View Should Be Well Rewarded
Growth Mail by Gary Alexander
As Adam Smith Turns 300 (With Marx at 205 & Keynes 140), Who’s Winning?
Global Mail by Ivan Martchev
Watch Jobless Claims – and Beware Bitcoin
Sector Spotlight by Jason Bodner
Are You Still Waiting for the “Next Shoe to Drop?”
View Full Archive
Read Past Issues Here

Jason Bodner
MARKETMAIL EDITOR FOR SECTOR SPOTLIGHT
Jason Bodner writes Sector Spotlight in the weekly Marketmail publication and has authored several white papers for the company. He is also Co-Founder of Macro Analytics for Professionals which produces proprietary equity accumulation/distribution research for its clients. Previously, Mr. Bodner served as Director of European Equity Derivatives for Cantor Fitzgerald Europe in London, then moved to the role of Head of Equity Derivatives North America for the same company in New York. He also served as S.V.P. Equity Derivatives for Jefferies, LLC. He received a B.S. in business administration in 1996, with honors, from Skidmore College as a member of the Periclean Honors Society. All content of “Sector Spotlight” represents the opinion of Jason Bodner
Important Disclosures:
Jason Bodner is a co-founder and co-owner of Mapsignals. Mr. Bodner is an independent contractor who is occasionally hired by Navellier & Associates to write an article and or provide opinions for possible use in articles that appear in Navellier & Associates weekly Market Mail. Mr. Bodner is not employed or affiliated with Louis Navellier, Navellier & Associates, Inc., or any other Navellier owned entity. The opinions and statements made here are those of Mr. Bodner and not necessarily those of any other persons or entities. This is not an endorsement, or solicitation or testimonial or investment advice regarding the BMI Index or any statements or recommendations or analysis in the article or the BMI Index or Mapsignals or its products or strategies.
Although information in these reports has been obtained from and is based upon sources that Navellier believes to be reliable, Navellier does not guarantee its accuracy and it may be incomplete or condensed. All opinions and estimates constitute Navellier’s judgment as of the date the report was created and are subject to change without notice. These reports are for informational purposes only and are not a solicitation for the purchase or sale of a security. Any decision to purchase securities mentioned in these reports must take into account existing public information on such securities or any registered prospectus.To the extent permitted by law, neither Navellier & Associates, Inc., nor any of its affiliates, agents, or service providers assumes any liability or responsibility nor owes any duty of care for any consequences of any person acting or refraining to act in reliance on the information contained in this communication or for any decision based on it.
Past performance is no indication of future results. Investment in securities involves significant risk and has the potential for partial or complete loss of funds invested. It should not be assumed that any securities recommendations made by Navellier. in the future will be profitable or equal the performance of securities made in this report. Dividend payments are not guaranteed. The amount of a dividend payment, if any, can vary over time and issuers may reduce dividends paid on securities in the event of a recession or adverse event affecting a specific industry or issuer.
None of the stock information, data, and company information presented herein constitutes a recommendation by Navellier or a solicitation to buy or sell any securities. Any specific securities identified and described do not represent all of the securities purchased, sold, or recommended for advisory clients. The holdings identified do not represent all of the securities purchased, sold, or recommended for advisory clients and the reader should not assume that investments in the securities identified and discussed were or will be profitable.
Information presented is general information that does not take into account your individual circumstances, financial situation, or needs, nor does it present a personalized recommendation to you. Individual stocks presented may not be suitable for every investor. Investment in securities involves significant risk and has the potential for partial or complete loss of funds invested. Investment in fixed income securities has the potential for the investment return and principal value of an investment to fluctuate so that an investor’s holdings, when redeemed, may be worth less than their original cost.
One cannot invest directly in an index. Index is unmanaged and index performance does not reflect deduction of fees, expenses, or taxes. Presentation of Index data does not reflect a belief by Navellier that any stock index constitutes an investment alternative to any Navellier equity strategy or is necessarily comparable to such strategies. Among the most important differences between the Indices and Navellier strategies are that the Navellier equity strategies may (1) incur material management fees, (2) concentrate its investments in relatively few stocks, industries, or sectors, (3) have significantly greater trading activity and related costs, and (4) be significantly more or less volatile than the Indices.
ETF Risk: We may invest in exchange traded funds (“ETFs”) and some of our investment strategies are generally fully invested in ETFs. Like traditional mutual funds, ETFs charge asset-based fees, but they generally do not charge initial sales charges or redemption fees and investors typically pay only customary brokerage fees to buy and sell ETF shares. The fees and costs charged by ETFs held in client accounts will not be deducted from the compensation the client pays Navellier. ETF prices can fluctuate up or down, and a client account could lose money investing in an ETF if the prices of the securities owned by the ETF go down. ETFs are subject to additional risks:
- ETF shares may trade above or below their net asset value;
- An active trading market for an ETF’s shares may not develop or be maintained;
- The value of an ETF may be more volatile than the underlying portfolio of securities the ETF is designed to track;
- The cost of owning shares of the ETF may exceed those a client would incur by directly investing in the underlying securities; and
- Trading of an ETF’s shares may be halted if the listing exchange’s officials deem it appropriate, the shares are delisted from the exchange, or the activation of market-wide “circuit breakers” (which are tied to large decreases in stock prices) halts stock trading generally.
Grader Disclosures: Investment in equity strategies involves substantial risk and has the potential for partial or complete loss of funds invested. The sample portfolio and any accompanying charts are for informational purposes only and are not to be construed as a solicitation to buy or sell any financial instrument and should not be relied upon as the sole factor in an investment making decision. As a matter of normal and important disclosures to you, as a potential investor, please consider the following: The performance presented is not based on any actual securities trading, portfolio, or accounts, and the reported performance of the A, B, C, D, and F portfolios (collectively the “model portfolios”) should be considered mere “paper” or pro forma performance results based on Navellier’s research.
Investors evaluating any of Navellier & Associates, Inc.’s, (or its affiliates’) Investment Products must not use any information presented here, including the performance figures of the model portfolios, in their evaluation of any Navellier Investment Products. Navellier Investment Products include the firm’s mutual funds and managed accounts. The model portfolios, charts, and other information presented do not represent actual funded trades and are not actual funded portfolios. There are material differences between Navellier Investment Products’ portfolios and the model portfolios, research, and performance figures presented here. The model portfolios and the research results (1) may contain stocks or ETFs that are illiquid and difficult to trade; (2) may contain stock or ETF holdings materially different from actual funded Navellier Investment Product portfolios; (3) include the reinvestment of all dividends and other earnings, estimated trading costs, commissions, or management fees; and, (4) may not reflect prices obtained in an actual funded Navellier Investment Product portfolio. For these and other reasons, the reported performances of model portfolios do not reflect the performance results of Navellier’s actually funded and traded Investment Products. In most cases, Navellier’s Investment Products have materially lower performance results than the performances of the model portfolios presented.
This report contains statements that are, or may be considered to be, forward-looking statements. All statements that are not historical facts, including statements about our beliefs or expectations, are “forward-looking statements” within the meaning of The U.S. Private Securities Litigation Reform Act of 1995. These statements may be identified by such forward-looking terminology as “expect,” “estimate,” “plan,” “intend,” “believe,” “anticipate,” “may,” “will,” “should,” “could,” “continue,” “project,” or similar statements or variations of such terms. Our forward-looking statements are based on a series of expectations, assumptions, and projections, are not guarantees of future results or performance, and involve substantial risks and uncertainty as described in Form ADV Part 2A of our filing with the Securities and Exchange Commission (SEC), which is available at www.adviserinfo.sec.gov or by requesting a copy by emailing info@navellier.com. All of our forward-looking statements are as of the date of this report only. We can give no assurance that such expectations or forward-looking statements will prove to be correct. Actual results may differ materially. You are urged to carefully consider all such factors.
FEDERAL TAX ADVICE DISCLAIMER: As required by U.S. Treasury Regulations, you are informed that, to the extent this presentation includes any federal tax advice, the presentation is not written by Navellier to be used, and cannot be used, for the purpose of avoiding federal tax penalties. Navellier does not advise on any income tax requirements or issues. Use of any information presented by Navellier is for general information only and does not represent tax advice either express or implied. You are encouraged to seek professional tax advice for income tax questions and assistance.
IMPORTANT NEWSLETTER DISCLOSURE:The hypothetical performance results for investment newsletters that are authored or edited by Louis Navellier, including Louis Navellier’s Growth Investor, Louis Navellier’s Breakthrough Stocks, Louis Navellier’s Accelerated Profits, and Louis Navellier’s Platinum Club, are not based on any actual securities trading, portfolio, or accounts, and the newsletters’ reported hypothetical performances should be considered mere “paper” or proforma hypothetical performance results and are not actual performance of real world trades. Navellier & Associates, Inc. does not have any relation to or affiliation with the owner of these newsletters. There are material differences between Navellier Investment Products’ portfolios and the InvestorPlace Media, LLC newsletter portfolios authored by Louis Navellier. The InvestorPlace Media, LLC newsletters contain hypothetical performance that do not include transaction costs, advisory fees, or other fees a client might incur if actual investments and trades were being made by an investor. As a result, newsletter performance should not be used to evaluate Navellier Investment services which are separate and different from the newsletters. The owner of the newsletters is InvestorPlace Media, LLC and any questions concerning the newsletters, including any newsletter advertising or hypothetical Newsletter performance claims, (which are calculated solely by Investor Place Media and not Navellier) should be referred to InvestorPlace Media, LLC at (800) 718-8289.
Please note that Navellier & Associates and the Navellier Private Client Group are managed completely independent of the newsletters owned and published by InvestorPlace Media, LLC and written and edited by Louis Navellier, and investment performance of the newsletters should in no way be considered indicative of potential future investment performance for any Navellier & Associates separately managed account portfolio. Potential investors should consult with their financial advisor before investing in any Navellier Investment Product.
Navellier claims compliance with Global Investment Performance Standards (GIPS). To receive a complete list and descriptions of Navellier’s composites and/or a presentation that adheres to the GIPS standards, please contact Navellier or click here. It should not be assumed that any securities recommendations made by Navellier & Associates, Inc. in the future will be profitable or equal the performance of securities made in this report.
FactSet Disclosure: Navellier does not independently calculate the statistical information included in the attached report. The calculation and the information are provided by FactSet, a company not related to Navellier. Although information contained in the report has been obtained from FactSet and is based on sources Navellier believes to be reliable, Navellier does not guarantee its accuracy, and it may be incomplete or condensed. The report and the related FactSet sourced information are provided on an “as is” basis. The user assumes the entire risk of any use made of this information. Investors should consider the report as only a single factor in making their investment decision. The report is for informational purposes only and is not intended as an offer or solicitation for the purchase or sale of a security. FactSet sourced information is the exclusive property of FactSet. Without prior written permission of FactSet, this information may not be reproduced, disseminated or used to create any financial products. All indices are unmanaged and performance of the indices include reinvestment of dividends and interest income, unless otherwise noted, are not illustrative of any particular investment and an investment cannot be made in any index. Past performance is no guarantee of future results.