by Gary Alexander
April 14, 2026
“Taxation is the art of plucking the goose so as to obtain the largest amount of feathers with the least amount of hissing.”
— Jean-Baptiste Colbert, Finance Minister to King Louis XIV of France.
As if any American needs a reminder, let me state the obvious: Even if you file for an extension (as I do each year), your annual tax bill is due tomorrow, April 15 – the date of the sinking of the Titanic in 1912 and the death of Lincoln in 1865 – so forget Julius Caesar’s Ides of March and beware the Ides of April!
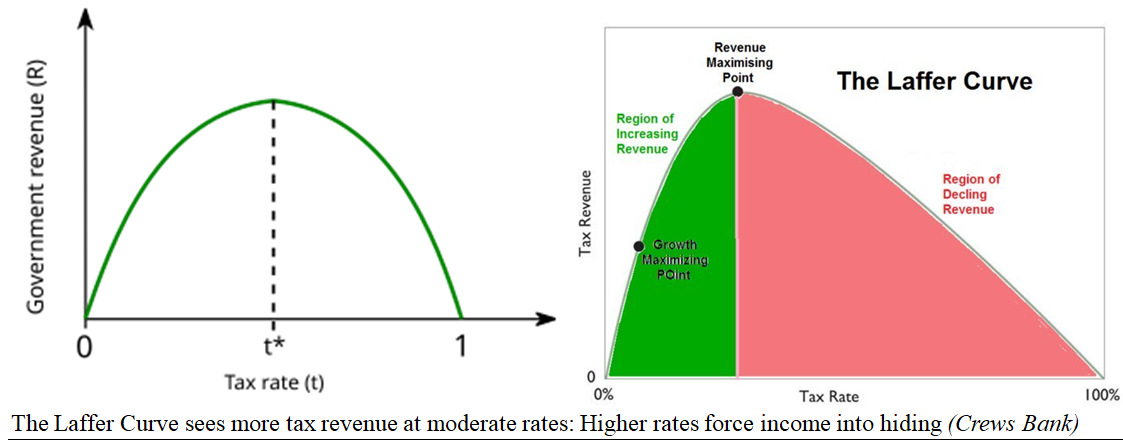
We’ve seen top marginal tax rates of 94% in the U.S. and over 100% in some European nations, but that sort of highway robbery always leads to fewer tax collections, as the best and brightest seek safe havens.
Economist Art Laffer invented the “curve” bearing his name in 1974, bearing out this correlation. There is a magic number – experience points to 25%-30% top tax rates – as the sweet spot for generating revenue.
Graphs are for illustrative and discussion purposes only. Please read important disclosures at the end of this commentary.
High Tax Rates Caused a 1960s “Brain Drain” in Britain,
Then Pushed Swedish Artists and Athletes into Exile in the 1970s
I’ve just seen a film, “What Sweden Got Right,” the third in a series I’ve reviewed for the Anthem Film Festival. The previous cases in point were Vietnam and Poland, two rapidly growing capitalist economies. (I’ve reviewed all of these films here, adding another low-tax convert, Ireland, last month in these pages.
The “Soak the Rich” crowd often cite Sweden as a model of a high-tax, high-benefit economy in Europe. Senators Bernie Sanders and Elizabeth Warren raise toasts to Sweden, but Sweden’s brief flirtation with socialism only took effect in the 1970s and 1980s, and it was a failure. Sweden actually gives us a real-life study of what happens under low or high tax rates. Sweden was a very poor nation before the 1860s, when capitalism became their national mantra. Then, from 1870 to 1913, Sweden’s per capita GDP rose 50% faster than the rest of Western Europe. By 1950, taxes were just 21% of Sweden’s GDP, lower than in the U.S. then, and about 10 percentage points below taxes in like Britain, France, and West Germany.
In the 1960s, marginal tax rates exceeded 100% in Great Britain, causing the famous “brain drain” of leading British scientists and artists, leading to our first major artistic protest: The Beatles’ Tax Man:
Let me tell you how it will be
There’s one for you, nineteen for me
‘Cause I’m the taxman
Should five per cent appear too small?
Be thankful I don’t take it all
‘Cause I’m the taxman
If you drive a car, I’ll tax the street
If you try to sit, I’ll tax your seat
If you get too cold, I’ll tax the heat
If you take a walk, I’ll tax your feet
‘Cause I’m the Taxman
Don’t ask me what I want it for
If you don’t want to pay some more
‘Cause I’m the taxman
My advice for those who die:
Declare the pennies on your eyes
‘Cause I’m the taxman!
George Harrison was the primary composer of “Taxman” (with help from John Lennon). It was released on August 6, 1966, as the opening cut on their “Revolver” album. Taxman was based on a severe tax problem facing the Beatles then: In April 1966, a report from the London accountancy firm of Bryce, Hammer, Isherwood & Co. advised them, despite the group’s immense success, “Two of you are close to being bankrupt, and the other two could soon be.” The Beatles were required to pay the 95% “super tax” devised by PM Harold Wilson’s Labour government,” hence the opening line, “one for me, 19 for you.”
Meanwhile, Sweden had become the fourth-richest country in the world, and the fifth-freest economy at that time, according to Robert Lawson and Ryan Murphy of the O’Neil Center for Global Markets and Freedom.
Then came Sweden’s failed experimentation with higher taxes, thus creating their own Brain Drain of tax avoiders. Tennis champion Bjorn Borg moved to Monaco in the 1970s. The famed film director Ingmar Bergman was slower to learn the lesson from the Beatles’ 1966 hit song. On January 30, 1976, soon after making his gorgeous film of Mozart’s opera, “The Magic Flute,” while rehearsing a play in Stockholm, he was arrested and charged with income tax evasion. These charges cut deeply, and he suffered a nervous breakdown as a result of public humiliation. He was soon hospitalized in a state of deep depression.
In short order, on March 23, 1976, prosecutors dropped all charges, but the damage was done. Bergman left the country, denying the tax man any lucrative taxes on the income they scared away. He vowed never to work in Sweden again. He closed down his studio there, suspended two announced film projects, and went into self-imposed exile in Germany. He lived 30-more years but only made two-more films.
Sweden learned from painful experience and began lowering top tax rates. In 2004, they abolished gift and inheritance taxes. This brought some former tax refugees back home. In 2013, Ingvar Kamprad, founder of IKEA, returned to Sweden (from Switzerland) 40-years after leaving to escape its high taxes.
And now Sweden now has more billionaires per capita than the United States, due to lowering tax rates.
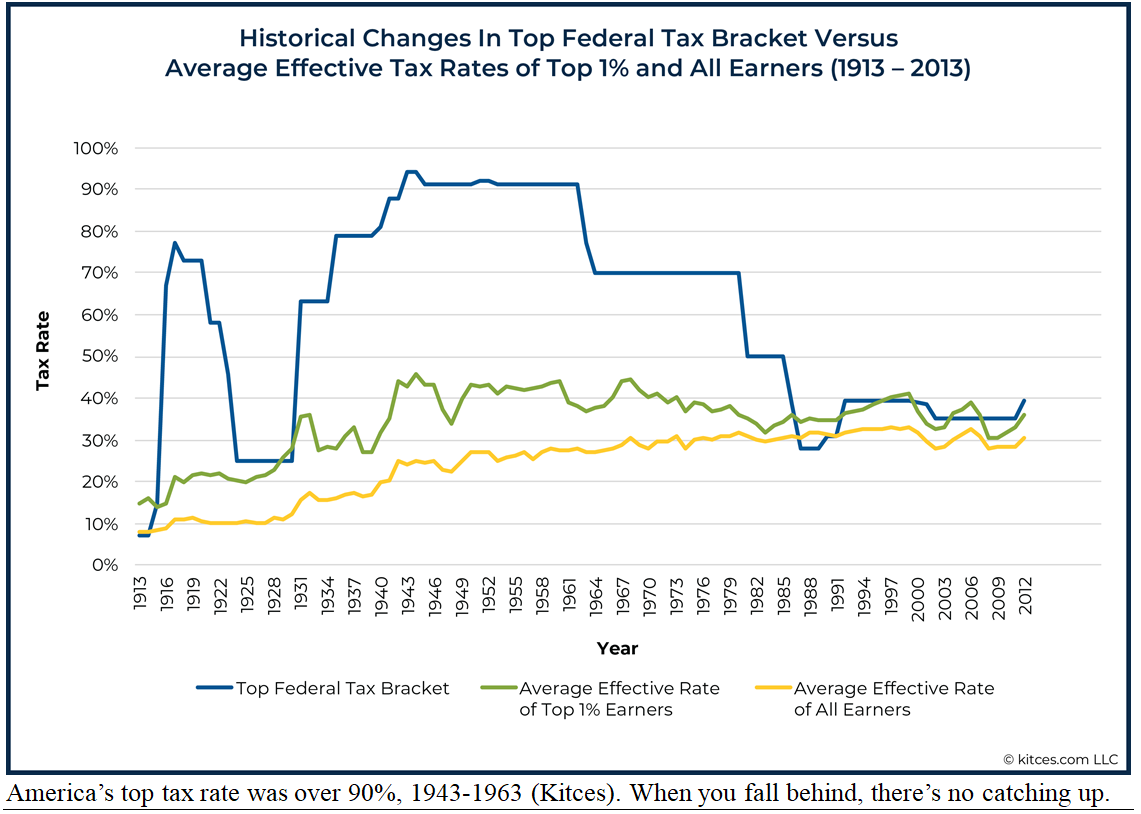
The 90% Tax Attack on Leading American Artists, 1943-1963
I can’t close this section without repeating Col. Tom Parker’s famous quote that it was his “patriotic duty to keep Elvis in the 90% tax bracket,” which was in force from 1943 to 1963. In fact, by 1973, Elvis was officially the highest individual taxpayer in America, paying the IRS $2.96-million in 1973 income taxes.
On the other side of Parker’s patriotic plan, many great musicians worked for the love of music and were cheated by accountants out of their taxes. Many big names ended in poverty, depression or early death.
- Singer Nat “King” Cole suffered from threats and penalties by the IRS (and FBI) due to unpaid taxes, contributing to his early death at age 45 in 1965.
- Comic Ernie Kovacs was so deep in debt to the IRS that it may have led to his early death, but his widow Edie Adams paid the IRS every last blood-red cent of his outrageous tax bill.
- Band-leader Woody Herman was thrown out of his home, which the IRS sold for back taxes, and had to keep his band on the road in old age to pay back taxes (I saw one of his last performances).
- Singer/songwriter Willie Nelson racked up a $30-million unpaid tax bill by 1990.
- Clarinetist Artie Shaw writes in his “Self-Portrait” (5-CD set) about his post-war tax blues:
“In 1949, I had a problem with the Internal Revenue Service, who claimed I owed them a lot of money that I didn’t feel I did. Of course I couldn’t get into a legal hassle with them, so I put together another band,” but the Big Band Era was dead, so he lost more money and fell deeper into IRS debt, so he retired for five-years, then “I had another IRS problem, and once again had to make enough money to get them off my back,” but that plan also failed.
Graphs are for illustrative and discussion purposes only. Please read important disclosures at the end of this commentary.
I could add many more stories of high marginal tax rates, scaring away high earners in a number of fields, but we face the same problem within several U.S. states now, and we’re seeing the same trend: an exodus by millions of taxpayers from high-tax states to lower-taxed states. I did this in 2004, moving from high-tax Virginia and Maryland to Washington state, the only blue state with no state income tax. In fact, our state Constitution forbids income taxes, although our greedy politicians keep trying to create them. (I must add Washington state charges high sales and property taxes, high excise taxes and business taxes).
The Laffer Curve in Action…Now, and a Century Ago
As Art Laffer says at the start of his book, “Taxes Have Consequences,” high-income earners can switch courses four ways, rapidly: “The extent of their wherewithal gives them options. High earners can readily change the location of where they earn their income, the timing as to when they receive their income, and the form in which they receive their income – not to mention how much income they choose to earn.”
Last year, the “One Big Beautiful Bill” lowered top tax rates, and some will claim big refunds this week, likely to fuel consumer spending – although the federal government refuses to cut their spending spree.
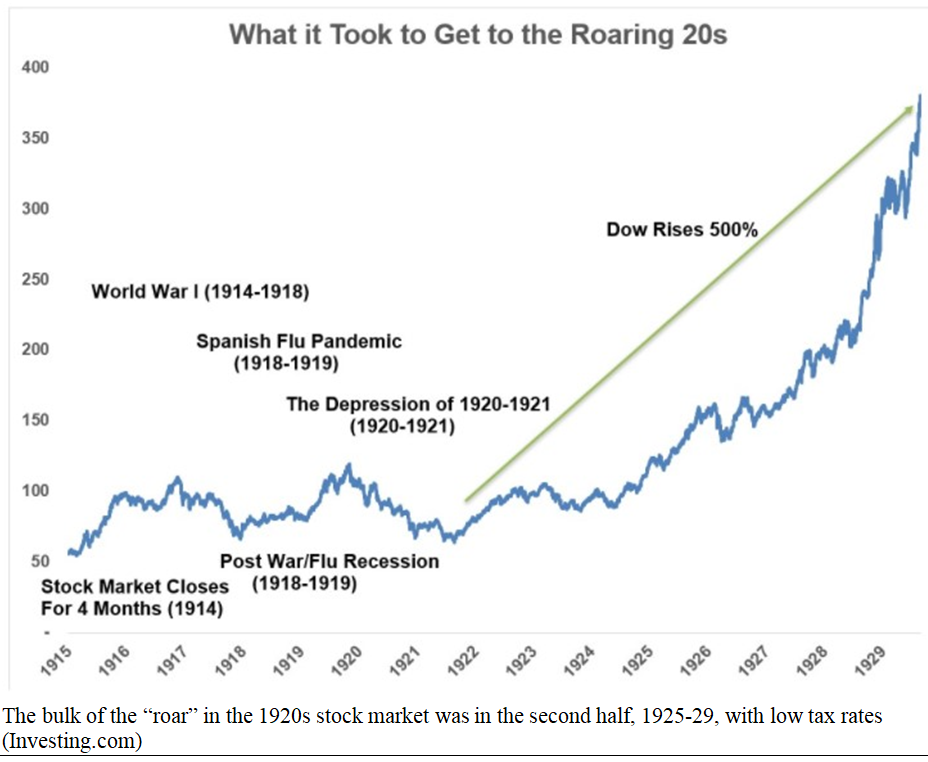
The first time a President cut taxes and spending, we saw a big boom in the Roaring 1920s. The market began its biggest rise 100 years ago, in 1926, and we could see a repeat of those Roaring 20s soon….
Graphs are for illustrative and discussion purposes only. Please read important disclosures at the end of this commentary.
This mastermind for this prosperity was Treasury Secretary Andrew Mellon, but the winning formula was repeated by Democrats in the 1960s, when President Kennedy said, in 1962, that he was about to send a comprehensive tax cut package to Congress. Speaking before the Economic Club of New York, he said,
“An economy hampered by restrictive tax rates will never produce enough revenue to balance our budget, just as it will never produce enough profits. Surely the lesson of the last decade is that budget deficits are not caused by wild-eyed spenders but by slow economic growth and periodic recessions.”
Sure enough, the 1950s were a time of frequent recessions, but there were no recessions from 1961 to 1970 after JFK and LBJ cut the top tax rate from a punitive 91% down to 70%. This act then tripled the “take home pay” of the rich (30% vs. 9%), fueling greater spending and higher tax receipts – resulting in a balanced budget in 1969. This same pattern returned in the Reagan-era tax cuts of the 1980s, which cut the top tax rate from 70% to 28%, fueling yet another boom, resulting in a doubling of tax revenues.
This Master Plan for Growth worked in the 1920s, 1960s, 1980s and in 2017 – and it can work again.
All content above represents the opinion of Gary Alexander of Navellier & Associates, Inc.
Also In This Issue
A Look Ahead by Louis Navellier
The Long-Term Outlook for Energy Prices
Income Mail by Bryan Perry
Buckle Up on the Road to a “Normal Nation State” in Iran
Growth Mail by Gary Alexander
On Taxes: The Laffer Curve in Action…and in the Arts
Global Mail by Ivan Martchev
This Ceasefire is Starting to Look Like a Failing Truce
Sector Spotlight by Jason Bodner
“Big Money” Buying Suddenly Revived Last Week
View Full Archive
Read Past Issues Here
About The Author

Gary Alexander
SENIOR EDITOR
Gary Alexander has been Senior Writer at Navellier since 2009. He edits Navellier’s weekly Marketmail and writes a weekly Growth Mail column, in which he uses market history to support the case for growth stocks. For the previous 20-years before joining Navellier, he was Senior Executive Editor at InvestorPlace Media (formerly Phillips Publishing), where he worked with several leading investment analysts, including Louis Navellier (since 1997), helping launch Louis Navellier’s Blue Chip Growth and Global Growth newsletters.
Prior to that, Gary edited Wealth Magazine and Gold Newsletter and wrote various investment research reports for Jefferson Financial in New Orleans in the 1980s. He began his financial newsletter career with KCI Communications in 1980, where he served as consulting editor for Personal Finance newsletter while serving as general manager of KCI’s Alexandria House book division. Before that, he covered the economics beat for news magazines. All content of “Growth Mail” represents the opinion of Gary Alexander
Important Disclosures:
Although information in these reports has been obtained from and is based upon sources that Navellier believes to be reliable, Navellier does not guarantee its accuracy and it may be incomplete or condensed. All opinions and estimates constitute Navellier’s judgment as of the date the report was created and are subject to change without notice. These reports are for informational purposes only and are not a solicitation for the purchase or sale of a security. Any decision to purchase securities mentioned in these reports must take into account existing public information on such securities or any registered prospectus.To the extent permitted by law, neither Navellier & Associates, Inc., nor any of its affiliates, agents, or service providers assumes any liability or responsibility nor owes any duty of care for any consequences of any person acting or refraining to act in reliance on the information contained in this communication or for any decision based on it.
Past performance is no indication of future results. Investment in securities involves significant risk and has the potential for partial or complete loss of funds invested. It should not be assumed that any securities recommendations made by Navellier. in the future will be profitable or equal the performance of securities made in this report. Dividend payments are not guaranteed. The amount of a dividend payment, if any, can vary over time and issuers may reduce dividends paid on securities in the event of a recession or adverse event affecting a specific industry or issuer.
None of the stock information, data, and company information presented herein constitutes a recommendation by Navellier or a solicitation to buy or sell any securities. Any specific securities identified and described do not represent all of the securities purchased, sold, or recommended for advisory clients. The holdings identified do not represent all of the securities purchased, sold, or recommended for advisory clients and the reader should not assume that investments in the securities identified and discussed were or will be profitable.
Information presented is general information that does not take into account your individual circumstances, financial situation, or needs, nor does it present a personalized recommendation to you. Individual stocks presented may not be suitable for every investor. Investment in securities involves significant risk and has the potential for partial or complete loss of funds invested. Investment in fixed income securities has the potential for the investment return and principal value of an investment to fluctuate so that an investor’s holdings, when redeemed, may be worth less than their original cost.
One cannot invest directly in an index. Index is unmanaged and index performance does not reflect deduction of fees, expenses, or taxes. Presentation of Index data does not reflect a belief by Navellier that any stock index constitutes an investment alternative to any Navellier equity strategy or is necessarily comparable to such strategies. Among the most important differences between the Indices and Navellier strategies are that the Navellier equity strategies may (1) incur material management fees, (2) concentrate its investments in relatively few stocks, industries, or sectors, (3) have significantly greater trading activity and related costs, and (4) be significantly more or less volatile than the Indices.
ETF Risk: We may invest in exchange traded funds (“ETFs”) and some of our investment strategies are generally fully invested in ETFs. Like traditional mutual funds, ETFs charge asset-based fees, but they generally do not charge initial sales charges or redemption fees and investors typically pay only customary brokerage fees to buy and sell ETF shares. The fees and costs charged by ETFs held in client accounts will not be deducted from the compensation the client pays Navellier. ETF prices can fluctuate up or down, and a client account could lose money investing in an ETF if the prices of the securities owned by the ETF go down. ETFs are subject to additional risks:
- ETF shares may trade above or below their net asset value;
- An active trading market for an ETF’s shares may not develop or be maintained;
- The value of an ETF may be more volatile than the underlying portfolio of securities the ETF is designed to track;
- The cost of owning shares of the ETF may exceed those a client would incur by directly investing in the underlying securities; and
- Trading of an ETF’s shares may be halted if the listing exchange’s officials deem it appropriate, the shares are delisted from the exchange, or the activation of market-wide “circuit breakers” (which are tied to large decreases in stock prices) halts stock trading generally.
Grader Disclosures: Investment in equity strategies involves substantial risk and has the potential for partial or complete loss of funds invested. The sample portfolio and any accompanying charts are for informational purposes only and are not to be construed as a solicitation to buy or sell any financial instrument and should not be relied upon as the sole factor in an investment making decision. As a matter of normal and important disclosures to you, as a potential investor, please consider the following: The performance presented is not based on any actual securities trading, portfolio, or accounts, and the reported performance of the A, B, C, D, and F portfolios (collectively the “model portfolios”) should be considered mere “paper” or pro forma performance results based on Navellier’s research.
Investors evaluating any of Navellier & Associates, Inc.’s, (or its affiliates’) Investment Products must not use any information presented here, including the performance figures of the model portfolios, in their evaluation of any Navellier Investment Products. Navellier Investment Products include the firm’s mutual funds and managed accounts. The model portfolios, charts, and other information presented do not represent actual funded trades and are not actual funded portfolios. There are material differences between Navellier Investment Products’ portfolios and the model portfolios, research, and performance figures presented here. The model portfolios and the research results (1) may contain stocks or ETFs that are illiquid and difficult to trade; (2) may contain stock or ETF holdings materially different from actual funded Navellier Investment Product portfolios; (3) include the reinvestment of all dividends and other earnings, estimated trading costs, commissions, or management fees; and, (4) may not reflect prices obtained in an actual funded Navellier Investment Product portfolio. For these and other reasons, the reported performances of model portfolios do not reflect the performance results of Navellier’s actually funded and traded Investment Products. In most cases, Navellier’s Investment Products have materially lower performance results than the performances of the model portfolios presented.
This report contains statements that are, or may be considered to be, forward-looking statements. All statements that are not historical facts, including statements about our beliefs or expectations, are “forward-looking statements” within the meaning of The U.S. Private Securities Litigation Reform Act of 1995. These statements may be identified by such forward-looking terminology as “expect,” “estimate,” “plan,” “intend,” “believe,” “anticipate,” “may,” “will,” “should,” “could,” “continue,” “project,” or similar statements or variations of such terms. Our forward-looking statements are based on a series of expectations, assumptions, and projections, are not guarantees of future results or performance, and involve substantial risks and uncertainty as described in Form ADV Part 2A of our filing with the Securities and Exchange Commission (SEC), which is available at www.adviserinfo.sec.gov or by requesting a copy by emailing info@navellier.com. All of our forward-looking statements are as of the date of this report only. We can give no assurance that such expectations or forward-looking statements will prove to be correct. Actual results may differ materially. You are urged to carefully consider all such factors.
FEDERAL TAX ADVICE DISCLAIMER: As required by U.S. Treasury Regulations, you are informed that, to the extent this presentation includes any federal tax advice, the presentation is not written by Navellier to be used, and cannot be used, for the purpose of avoiding federal tax penalties. Navellier does not advise on any income tax requirements or issues. Use of any information presented by Navellier is for general information only and does not represent tax advice either express or implied. You are encouraged to seek professional tax advice for income tax questions and assistance.
IMPORTANT NEWSLETTER DISCLOSURE:The hypothetical performance results for investment newsletters that are authored or edited by Louis Navellier, including Louis Navellier’s Growth Investor, Louis Navellier’s Breakthrough Stocks, Louis Navellier’s Accelerated Profits, and Louis Navellier’s Platinum Club, are not based on any actual securities trading, portfolio, or accounts, and the newsletters’ reported hypothetical performances should be considered mere “paper” or proforma hypothetical performance results and are not actual performance of real world trades. Navellier & Associates, Inc. does not have any relation to or affiliation with the owner of these newsletters. There are material differences between Navellier Investment Products’ portfolios and the InvestorPlace Media, LLC newsletter portfolios authored by Louis Navellier. The InvestorPlace Media, LLC newsletters contain hypothetical performance that do not include transaction costs, advisory fees, or other fees a client might incur if actual investments and trades were being made by an investor. As a result, newsletter performance should not be used to evaluate Navellier Investment services which are separate and different from the newsletters. The owner of the newsletters is InvestorPlace Media, LLC and any questions concerning the newsletters, including any newsletter advertising or hypothetical Newsletter performance claims, (which are calculated solely by Investor Place Media and not Navellier) should be referred to InvestorPlace Media, LLC at (800) 718-8289.
Please note that Navellier & Associates and the Navellier Private Client Group are managed completely independent of the newsletters owned and published by InvestorPlace Media, LLC and written and edited by Louis Navellier, and investment performance of the newsletters should in no way be considered indicative of potential future investment performance for any Navellier & Associates separately managed account portfolio. Potential investors should consult with their financial advisor before investing in any Navellier Investment Product.
Navellier claims compliance with Global Investment Performance Standards (GIPS). To receive a complete list and descriptions of Navellier’s composites and/or a presentation that adheres to the GIPS standards, please contact Navellier or click here. It should not be assumed that any securities recommendations made by Navellier & Associates, Inc. in the future will be profitable or equal the performance of securities made in this report.
FactSet Disclosure: Navellier does not independently calculate the statistical information included in the attached report. The calculation and the information are provided by FactSet, a company not related to Navellier. Although information contained in the report has been obtained from FactSet and is based on sources Navellier believes to be reliable, Navellier does not guarantee its accuracy, and it may be incomplete or condensed. The report and the related FactSet sourced information are provided on an “as is” basis. The user assumes the entire risk of any use made of this information. Investors should consider the report as only a single factor in making their investment decision. The report is for informational purposes only and is not intended as an offer or solicitation for the purchase or sale of a security. FactSet sourced information is the exclusive property of FactSet. Without prior written permission of FactSet, this information may not be reproduced, disseminated or used to create any financial products. All indices are unmanaged and performance of the indices include reinvestment of dividends and interest income, unless otherwise noted, are not illustrative of any particular investment and an investment cannot be made in any index. Past performance is no guarantee of future results.