by Jason Bodner
April 14, 2026
Octopi have three-hearts. Two-hearts pump blood to the gills. One-pumps it to the rest of the body. When they swim, the main heart actually stops beating, which is why they prefer to crawl instead of move fast.
Markets can be similar… under stress, the system slows, stalls, and looks like it cannot move forward. Then, without much warning, it starts up again, and that is what this past week looked like.
Two-weeks ago, the BMI (Big Money Index) came under pressure, falling along with the overall market.
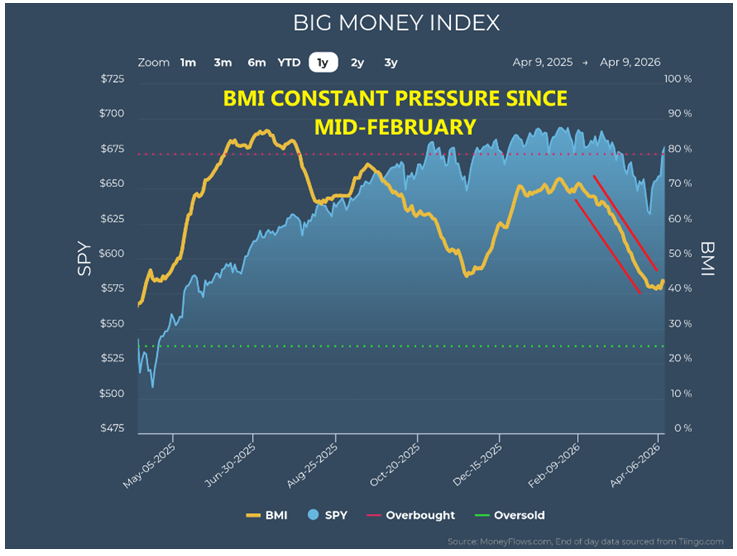
Graphs are for illustrative and discussion purposes only. Please read important disclosures at the end of this commentary.
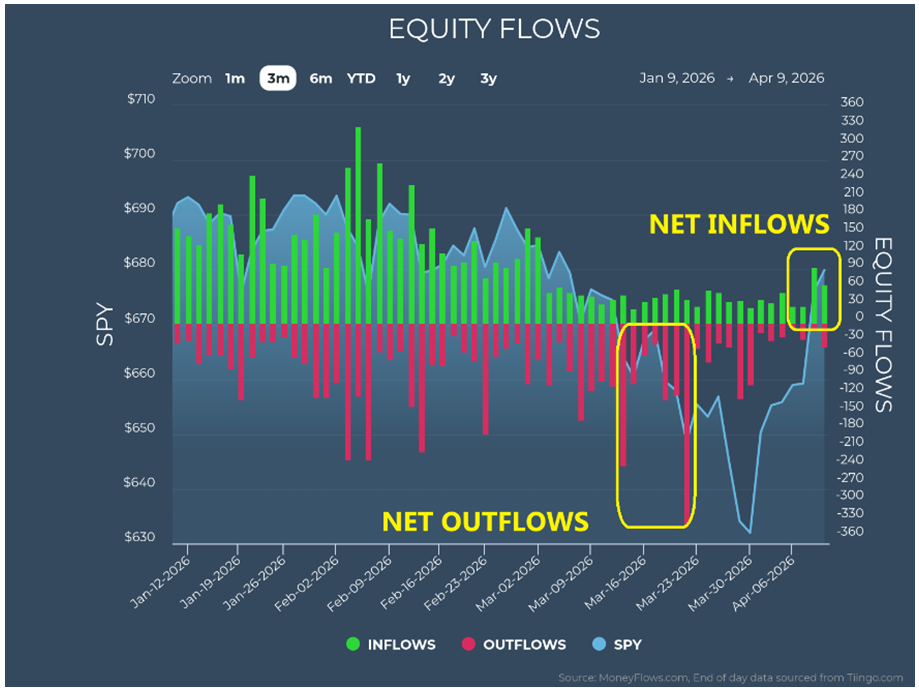
During the week of March 16-20, we saw 671-outflows (-456 net flows) driven by persistent institutional selling. March 20th alone saw -337 outflows in a single session. That was definitely not a normal day.
Then, suddenly, the tone changed. President Trump announced a cease fire for two-weeks to enable negotiations with Iran to potentially end the war. Last week (April 6-10) saw +135 net flows as of Thursday. That is a significant swing. Outflows dropped from an average -81 per day from March 16th to April 2nd to gently rising inflows. Selling stopped suddenly, and buying stepped in, right behind it.
Graphs are for illustrative and discussion purposes only. Please read important disclosures at the end of this commentary.
We can see that with a spike in ETVs (unusually large trades) coupled with a spike in the SPY:
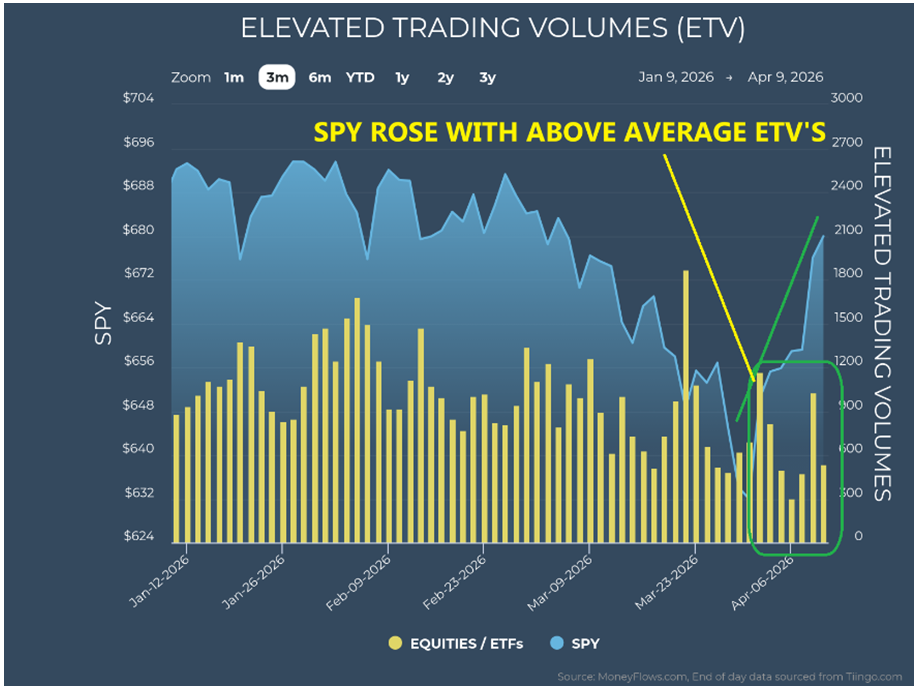
Graphs are for illustrative and discussion purposes only. Please read important disclosures at the end of this commentary.
That kind of reversal is not just retail driven… it reflects institutional flows showing up in the data.
The price action confirmed it. The S&P ETF (SPY) rose 3.6% for the week and shot up 7.5% since March 30th. At the same time, the VIX fell from 31.05 on March 27 to 19.23 on April 10. That is a 38% drop in volatility in two-weeks. Clearly, this is what we all wanted to see. When flows, price, and volatility all shift together, it usually means something changed beneath the surface.
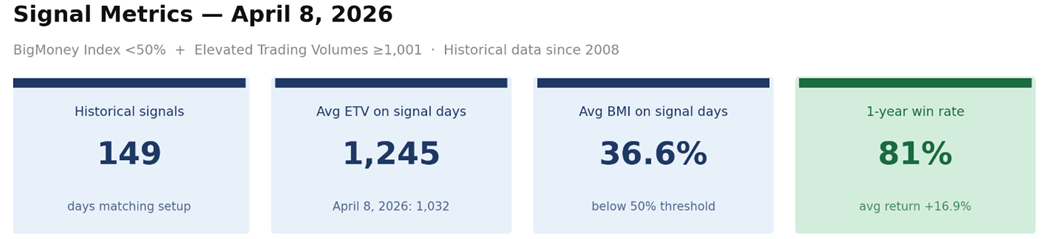
The best evidence came forth on April 8, with 94-inflows, placing it in the 85th percentile historically. Elevated Trading Volume came in at 1,032, in the 97th percentile. The day ratio was 0.879, also elevated.
Those numbers rarely line up at the same time. One can spike, two is notable, but all three is conviction.
It tells you institutions were not just “testing the waters.” They were plowing back in with size.
Now, let’s layer in the broader backdrop.
The BMI remains below 50%. Over the last 25-trading days, there has been more selling than buying.
On the surface, the market still looks weak, but that is what makes this setup look interesting.
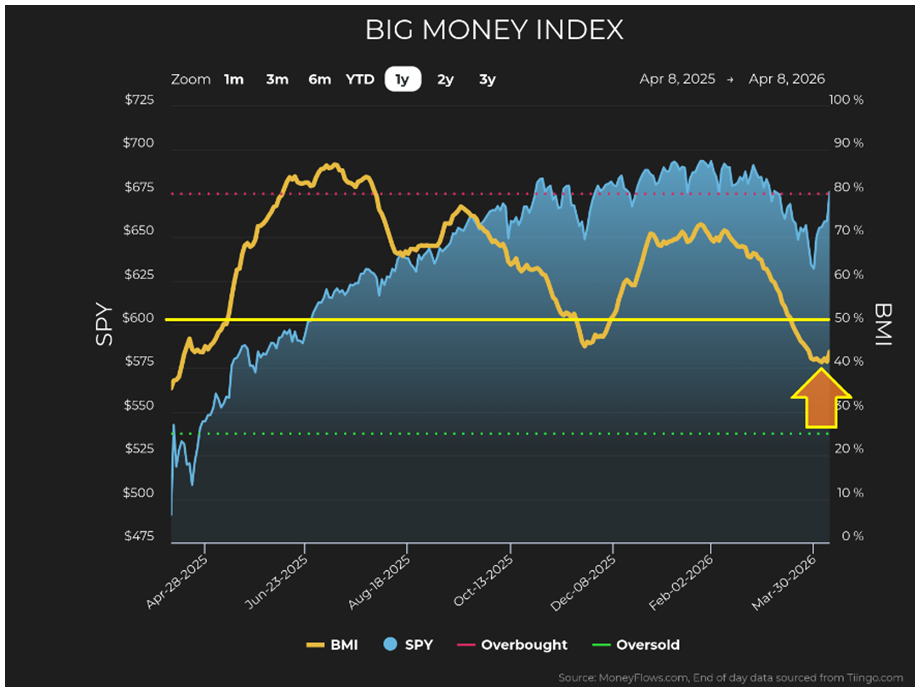
Graphs are for illustrative and discussion purposes only. Please read important disclosures at the end of this commentary.
The market was under pressure, followed by a sharp reversal, confirmed by heavy institutional activity. That combination does not show up very often. Going back to 1990, similar setups tend to cluster around periods of stress, like the financial crisis in 2008, the debt scare in 2011, the China and oil unwind in 2015 and 2016, the fourth-quarter collapse in 2018, COVID in 2020, or the rate-driven bear market in 2022.
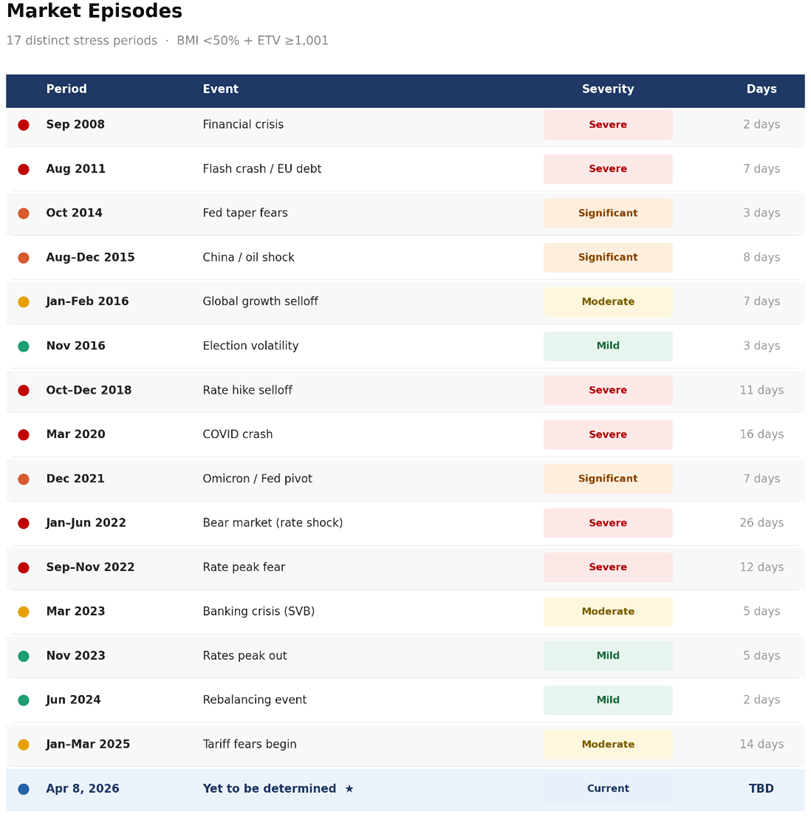
Graphs are for illustrative and discussion purposes only. Please read important disclosures at the end of this commentary.
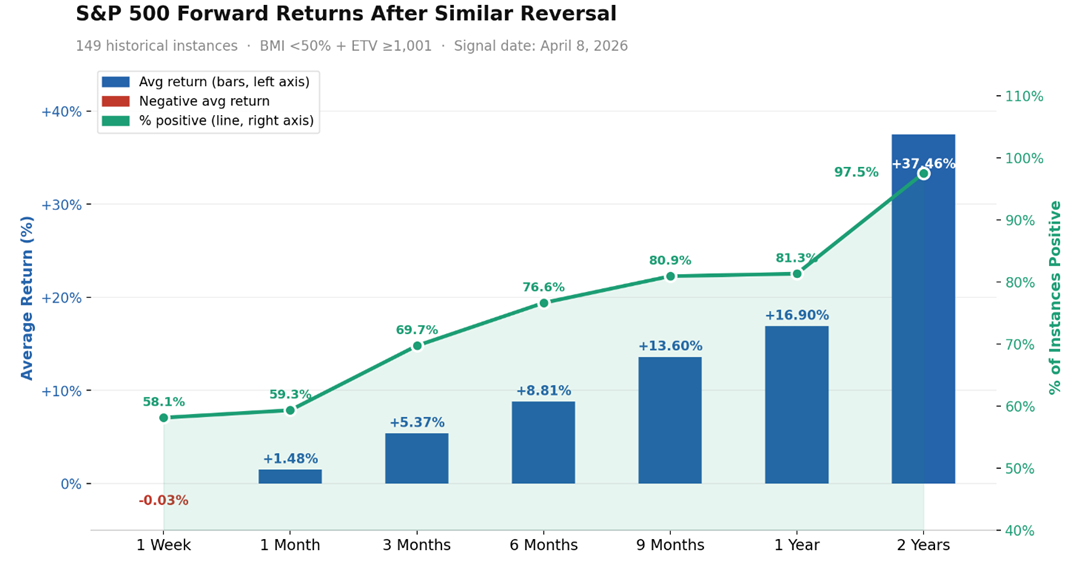
These are not comfortable environments. They are periods in which investors are uncertain and knocked off balance. Historically, the short-term behavior after these signals has not been clean. The first-week tends to be flat. Markets chop. Volatility remains elevated, as the market works through selling pressure.
But that pattern changes in short order. Three-months out, returns begin to skew positive. Six-months out, the trend strengthens. After two-years, the market is higher 98% of the time, with a median gain of 39.3%.
Graphs are for illustrative and discussion purposes only. Please read important disclosures at the end of this commentary.
That is the part of the data that stands out… The signal is strong:
Graphs are for illustrative and discussion purposes only. Please read important disclosures at the end of this commentary.
There is a caveat. The 2008 signals took longer to play out and came with deeper draw-downs along the way. That singular crisis is a reminder and warning: Strong signals do not eliminate risk in the near-term.

Which brings us back to where we are now.
Not everything is confirming this yet, but… Breadth has been slipping. The percentage of stocks above their 140-day moving average has fallen from around 64% in mid-March to the mid-40s this week. Fewer stocks are participating in the rally even as the index moves higher. That is a divergence worth watching.
So, the market is sending a mixed message: Flows suddenly turned positive and volatility collapsed. A high conviction reversal has already occurred. Breadth is weaker, and the broader trend is still stabilizing.
That tension is what makes this moment important.
The question now is straightforward, and the answer depends on how long a resolution for this Iran war drags out: Do inflows continue, or was April 8 a single burst of buying in an otherwise fragile market?
In most historical instances, institutional selling exhausts itself and is followed by aggressive buying – and the path forward tends to be higher over time.
It is not always immediate, nor smooth. But consistency is what we want to see. The opportunity is rarely obvious when it is happening, because it usually feels uncomfortable, uncertain, and incomplete.
That is exactly how this situation feels now. All eyes on flows, but with a bounce in the BMI, a vanishing of outflows, and a slight uptick in inflows, the storm might have passed.
We’ll see, but the lows are likely in.
As Jesse Livermore said, “The big money is not in the buying or the selling, but in the waiting.”
All content above represents the opinion of Jason Bodner of Navellier & Associates, Inc.
Also In This Issue
A Look Ahead by Louis Navellier
The Long-Term Outlook for Energy Prices
Income Mail by Bryan Perry
Buckle Up on the Road to a “Normal Nation State” in Iran
Growth Mail by Gary Alexander
On Taxes: The Laffer Curve in Action…and in the Arts
Global Mail by Ivan Martchev
This Ceasefire is Starting to Look Like a Failing Truce
Sector Spotlight by Jason Bodner
“Big Money” Buying Suddenly Revived Last Week
View Full Archive
Read Past Issues Here

Jason Bodner
MARKETMAIL EDITOR FOR SECTOR SPOTLIGHT
Jason Bodner writes Sector Spotlight in the weekly Marketmail publication and has authored several white papers for the company. He is also Co-Founder of Macro Analytics for Professionals which produces proprietary equity accumulation and distribution research for its clients. Previously, Mr. Bodner served as Director of European Equity Derivatives for Cantor Fitzgerald Europe in London, then moved to the role of Head of Equity Derivatives North America for the same company in New York. He also served as S.V.P. Equity Derivatives for Jefferies, LLC. He received a B.S. in business administration in 1996, with honors, from Skidmore College as a member of the Periclean Honors Society. All content of “Sector Spotlight” represents the opinion of Jason Bodner
Important Disclosures:
Jason Bodner is a co-founder and co-owner of Mapsignals. Mr. Bodner is an independent contractor who is occasionally hired by Navellier & Associates to write an article and or provide opinions for possible use in articles that appear in Navellier & Associates weekly Market Mail. Mr. Bodner is not employed or affiliated with Louis Navellier, Navellier & Associates, Inc., or any other Navellier owned entity. The opinions and statements made here are those of Mr. Bodner and not necessarily those of any other persons or entities. This is not an endorsement, or solicitation or testimonial or investment advice regarding the BMI Index or any statements or recommendations or analysis in the article or the BMI Index or Mapsignals or its products or strategies.
Although information in these reports has been obtained from and is based upon sources that Navellier believes to be reliable, Navellier does not guarantee its accuracy and it may be incomplete or condensed. All opinions and estimates constitute Navellier’s judgment as of the date the report was created and are subject to change without notice. These reports are for informational purposes only and are not a solicitation for the purchase or sale of a security. Any decision to purchase securities mentioned in these reports must take into account existing public information on such securities or any registered prospectus.To the extent permitted by law, neither Navellier & Associates, Inc., nor any of its affiliates, agents, or service providers assumes any liability or responsibility nor owes any duty of care for any consequences of any person acting or refraining to act in reliance on the information contained in this communication or for any decision based on it.
Past performance is no indication of future results. Investment in securities involves significant risk and has the potential for partial or complete loss of funds invested. It should not be assumed that any securities recommendations made by Navellier. in the future will be profitable or equal the performance of securities made in this report. Dividend payments are not guaranteed. The amount of a dividend payment, if any, can vary over time and issuers may reduce dividends paid on securities in the event of a recession or adverse event affecting a specific industry or issuer.
None of the stock information, data, and company information presented herein constitutes a recommendation by Navellier or a solicitation to buy or sell any securities. Any specific securities identified and described do not represent all of the securities purchased, sold, or recommended for advisory clients. The holdings identified do not represent all of the securities purchased, sold, or recommended for advisory clients and the reader should not assume that investments in the securities identified and discussed were or will be profitable.
Information presented is general information that does not take into account your individual circumstances, financial situation, or needs, nor does it present a personalized recommendation to you. Individual stocks presented may not be suitable for every investor. Investment in securities involves significant risk and has the potential for partial or complete loss of funds invested. Investment in fixed income securities has the potential for the investment return and principal value of an investment to fluctuate so that an investor’s holdings, when redeemed, may be worth less than their original cost.
One cannot invest directly in an index. Index is unmanaged and index performance does not reflect deduction of fees, expenses, or taxes. Presentation of Index data does not reflect a belief by Navellier that any stock index constitutes an investment alternative to any Navellier equity strategy or is necessarily comparable to such strategies. Among the most important differences between the Indices and Navellier strategies are that the Navellier equity strategies may (1) incur material management fees, (2) concentrate its investments in relatively few stocks, industries, or sectors, (3) have significantly greater trading activity and related costs, and (4) be significantly more or less volatile than the Indices.
ETF Risk: We may invest in exchange traded funds (“ETFs”) and some of our investment strategies are generally fully invested in ETFs. Like traditional mutual funds, ETFs charge asset-based fees, but they generally do not charge initial sales charges or redemption fees and investors typically pay only customary brokerage fees to buy and sell ETF shares. The fees and costs charged by ETFs held in client accounts will not be deducted from the compensation the client pays Navellier. ETF prices can fluctuate up or down, and a client account could lose money investing in an ETF if the prices of the securities owned by the ETF go down. ETFs are subject to additional risks:
- ETF shares may trade above or below their net asset value;
- An active trading market for an ETF’s shares may not develop or be maintained;
- The value of an ETF may be more volatile than the underlying portfolio of securities the ETF is designed to track;
- The cost of owning shares of the ETF may exceed those a client would incur by directly investing in the underlying securities and;
- Trading of an ETF’s shares may be halted if the listing exchange’s officials deem it appropriate, the shares are delisted from the exchange, or the activation of market-wide “circuit breakers” (which are tied to large decreases in stock prices) halts stock trading generally.
Grader Disclosures: Investment in equity strategies involves substantial risk and has the potential for partial or complete loss of funds invested. The sample portfolio and any accompanying charts are for informational purposes only and are not to be construed as a solicitation to buy or sell any financial instrument and should not be relied upon as the sole factor in an investment making decision. As a matter of normal and important disclosures to you, as a potential investor, please consider the following: The performance presented is not based on any actual securities trading, portfolio, or accounts, and the reported performance of the A, B, C, D, and F portfolios (collectively the “model portfolios”) should be considered mere “paper” or pro forma performance results based on Navellier’s research.
Investors evaluating any of Navellier & Associates, Inc.’s, (or its affiliates’) Investment Products must not use any information presented here, including the performance figures of the model portfolios, in their evaluation of any Navellier Investment Products. Navellier Investment Products include the firm’s mutual funds and managed accounts. The model portfolios, charts, and other information presented do not represent actual funded trades and are not actual funded portfolios. There are material differences between Navellier Investment Products’ portfolios and the model portfolios, research, and performance figures presented here. The model portfolios and the research results (1) may contain stocks or ETFs that are illiquid and difficult to trade; (2) may contain stock or ETF holdings materially different from actual funded Navellier Investment Product portfolios; (3) include the reinvestment of all dividends and other earnings, estimated trading costs, commissions, or management fees; and, (4) may not reflect prices obtained in an actual funded Navellier Investment Product portfolio. For these and other reasons, the reported performances of model portfolios do not reflect the performance results of Navellier’s actually funded and traded Investment Products. In most cases, Navellier’s Investment Products have materially lower performance results than the performances of the model portfolios presented.
This report contains statements that are, or may be considered to be, forward-looking statements. All statements that are not historical facts, including statements about our beliefs or expectations, are “forward-looking statements” within the meaning of The U.S. Private Securities Litigation Reform Act of 1995. These statements may be identified by such forward-looking terminology as “expect,” “estimate,” “plan,” “intend,” “believe,” “anticipate,” “may,” “will,” “should,” “could,” “continue,” “project,” or similar statements or variations of such terms. Our forward-looking statements are based on a series of expectations, assumptions, and projections, are not guarantees of future results or performance, and involve substantial risks and uncertainty as described in Form ADV Part 2A of our filing with the Securities and Exchange Commission (SEC), which is available at www.adviserinfo.sec.gov or by requesting a copy by emailing info@navellier.com. All of our forward-looking statements are as of the date of this report only. We can give no assurance that such expectations or forward-looking statements will prove to be correct. Actual results may differ materially. You are urged to carefully consider all such factors.
FEDERAL TAX ADVICE DISCLAIMER: As required by U.S. Treasury Regulations, you are informed that, to the extent this presentation includes any federal tax advice, the presentation is not written by Navellier to be used, and cannot be used, for the purpose of avoiding federal tax penalties. Navellier does not advise on any income tax requirements or issues. Use of any information presented by Navellier is for general information only and does not represent tax advice either express or implied. You are encouraged to seek professional tax advice for income tax questions and assistance.
IMPORTANT NEWSLETTER DISCLOSURE:The hypothetical performance results for investment newsletters that are authored or edited by Louis Navellier, including Louis Navellier’s Growth Investor, Louis Navellier’s Breakthrough Stocks, Louis Navellier’s Accelerated Profits, and Louis Navellier’s Platinum Club, are not based on any actual securities trading, portfolio, or accounts, and the newsletters’ reported hypothetical performances should be considered mere “paper” or proforma hypothetical performance results and are not actual performance of real world trades. Navellier & Associates, Inc. does not have any relation to or affiliation with the owner of these newsletters. There are material differences between Navellier Investment Products’ portfolios and the InvestorPlace Media, LLC newsletter portfolios authored by Louis Navellier. The InvestorPlace Media, LLC newsletters contain hypothetical performance that do not include transaction costs, advisory fees, or other fees a client might incur if actual investments and trades were being made by an investor. As a result, newsletter performance should not be used to evaluate Navellier Investment services which are separate and different from the newsletters. The owner of the newsletters is InvestorPlace Media, LLC and any questions concerning the newsletters, including any newsletter advertising or hypothetical Newsletter performance claims, (which are calculated solely by Investor Place Media and not Navellier) should be referred to InvestorPlace Media, LLC at (800) 718-8289.
Please note that Navellier & Associates and the Navellier Private Client Group are managed completely independent of the newsletters owned and published by InvestorPlace Media, LLC and written and edited by Louis Navellier, and investment performance of the newsletters should in no way be considered indicative of potential future investment performance for any Navellier & Associates separately managed account portfolio. Potential investors should consult with their financial advisor before investing in any Navellier Investment Product.
Navellier claims compliance with Global Investment Performance Standards (GIPS). To receive a complete list and descriptions of Navellier’s composites and/or a presentation that adheres to the GIPS standards, please contact Navellier or click here. It should not be assumed that any securities recommendations made by Navellier & Associates, Inc. in the future will be profitable or equal the performance of securities made in this report.
FactSet Disclosure: Navellier does not independently calculate the statistical information included in the attached report. The calculation and the information are provided by FactSet, a company not related to Navellier. Although information contained in the report has been obtained from FactSet and is based on sources Navellier believes to be reliable, Navellier does not guarantee its accuracy, and it may be incomplete or condensed. The report and the related FactSet sourced information are provided on an “as is” basis. The user assumes the entire risk of any use made of this information. Investors should consider the report as only a single factor in making their investment decision. The report is for informational purposes only and is not intended as an offer or solicitation for the purchase or sale of a security. FactSet sourced information is the exclusive property of FactSet. Without prior written permission of FactSet, this information may not be reproduced, disseminated or used to create any financial products. All indices are unmanaged and performance of the indices include reinvestment of dividends and interest income, unless otherwise noted, are not illustrative of any particular investment and an investment cannot be made in any index. Past performance is no guarantee of future results.