
by Gary Alexander
October 13, 2026
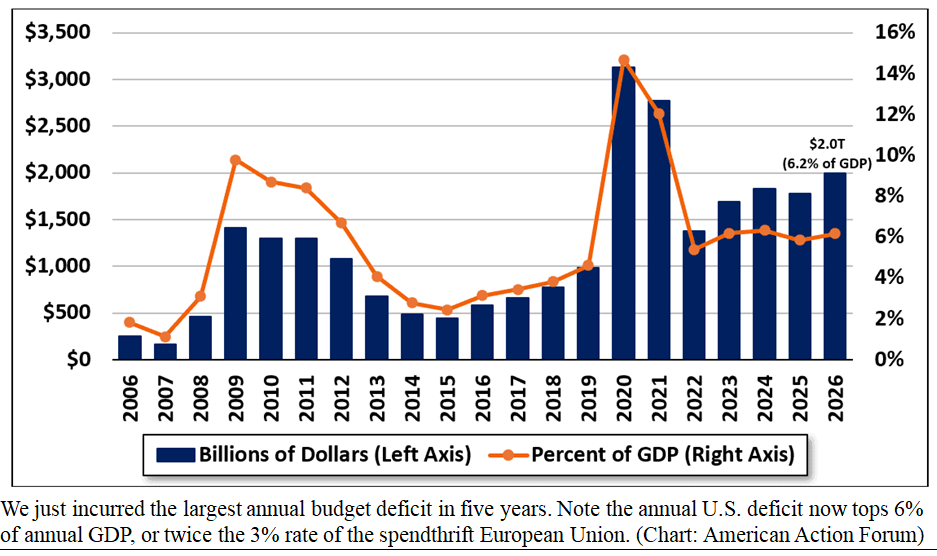
Numbers are funny things. We rely on them without understanding how they are constructed, especially when it comes to the most important national measurements. In early October, we learned U.S. economic growth, counting business spending, raced ahead at a 5% rate in the second quarter, about double the officially reported GDP that quarter. That’s the good news. The bad news is that the fiscal year deficit for 2026 (ending September 30) was 1.993 trillion, just a hair short of $2 trillion, officially, but the deficit in fact was closer to $2.5 trillion, if you count the full growth in federal debt levels over the last 12-months.
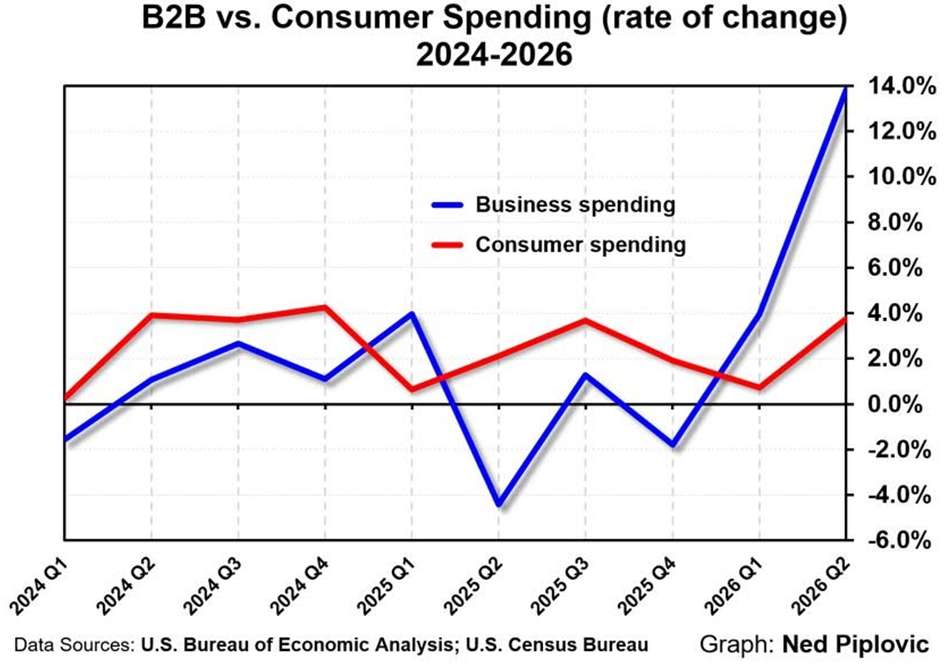
First, let’s celebrate the good news. An expanded measure of economic growth reached a 5% annual rate in the second-quarter. Although the consumer-based GDP only rose by 2.2% in the second-quarter, the second-quarter Gross Output (GO) measure grew 5% in real terms, and B2B spending grew nearly 14%:
Graphs are for illustrative and discussion purposes only. Please read important disclosures at the end of this commentary.
Business-to-business spending grew 13.8% in the second-quarter of 2026, the fastest growth in business activity (excluding the post-CoVID rebound) since the BEA started measuring the GO statistic in 2005.
Writing in the October 1 edition of The Wall Street Journal, Mark Skousen explained the value of “GO”:
“Business spending in the supply chain is much bigger and more volatile than final consumption and does a better job of measuring the ups and downs of the business cycle,” and Gross Output shows “business activity is quickly changing this year and is exploding upward…. GO is suddenly growing faster than GDP, a significant positive trend, and one that suggests real GDP in the third-quarter could be explosive.”
In simple terms, GDP measures the final sale of all goods and services, hence the common refrain that “consumers account for 70% of GDP.” True, but misleading, since that definition identifies both the flaws of GDP as well as the overrated power of the consumer, as business-to-business stages of production are essential in forecasting the underlying health of an economy. GDP leaves out the supply chain – all the spending required to get a usable good or service to the customer. We have to go back to Adam Smith to see this process in perspective, as Smith wrote (in 1776), “…capital may be employed in four different ways. The first,” he said, was “cultivation of lands, mines, or fisheries; in the second, those of all master manufacturers; in the third, those of all wholesale merchants; and in the fourth, those of all retailers.”
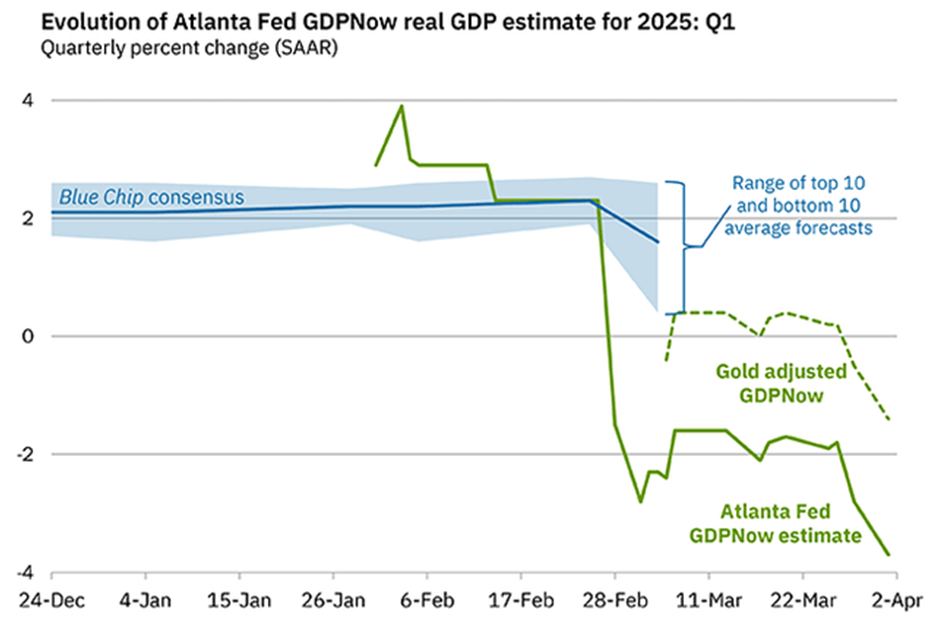
GDP focuses on the final stage, putting the consumer on the statistical pedestal. I would also say the GDP calculus is compromised by two archaic trade measures – the “favorable” (export over import) balance of trade, and over-rating gold trades between nations by the influential Atlanta Fed GDPNow statistic.
As Louis Navellier reports in this week’s Marketmail, “The Commerce Department reported on Tuesday that the trade deficit surged 13.7% in August to $105.6 billion. Imports rose 4.3% to $420.8 billion while exports rose 1.4% to $315.2 billion, but he added, “The higher the trade deficit rises, the more downward pressure it puts on GDP calculations, so do not be surprised if there is a downward revision.”
Two-years ago, in late 2024, after President Trump was elected President but before he took the oath of office, America imported a huge hoard of gold, which caused a surge in U.S. gold imports, which quickly rose from a typical $1-to-$3-billion per month to $34 billion in January 2025. In January 2025, a record 151 metric tons (nearly five-million troy ounces) of gold was shipped from London to the U.S., while Swiss exports to America hit their highest level in over a decade, driven by fears of Trump-driven tariffs.
As it turns out, gold doubled in price over the next year $2,700 to $5,400 – a real bonanza for America, but this gold surge distorted GDPNow’s real-time GDP estimates, prompting the Federal Reserve Bank of Atlanta to introduce a “gold‑adjusted” model (discounting gold’s impact) to reflect the economy’s true internal growth rate. After all, it’s a “domestic” growth measure, not a measure of global gold flows.
Graphs are for illustrative and discussion purposes only. Please read important disclosures at the end of this commentary.
So, the recent 5% growth in Gross Output is the good news, but the bad news comes from the debt side:
The “Real” Fiscal Year 2026 Budget Deficit Topped $2.5 (Not $1.99) Trillion
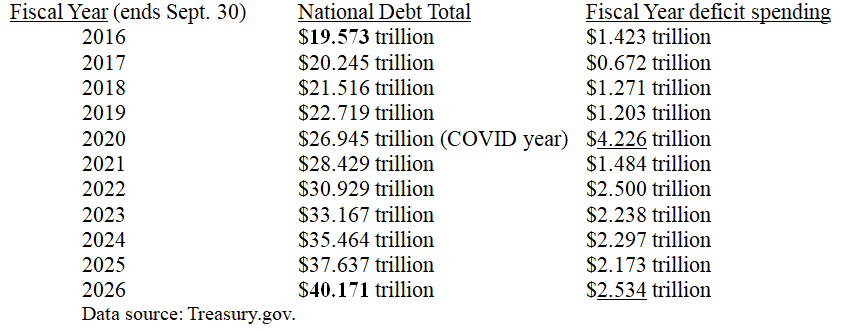
Last week, the Congressional Budget Office (CBO) reported $1.993 trillion in red ink for the 2026 federal fiscal year, ending September 30. That’s darn close to $2 trillion, but the bad news is that the true number is a bit over $2.5 trillion, as the accumulated federal debt keeps rising about 25% faster than the official deficits. In FY’26, the federal government spent $7.4 trillion ($20 billion a day) while debt grew by $7 billion a day. Total U.S. federal debt closed fiscal year 2026 at $40.1 trillion — up $2.5 trillion (+6.5%) from the $37.6 trillion debt at the end of FY25, so where did that extra $500 billion in red ink come from?
Several sources tell the same sad tale. The $2.5 trillion in new debt is the “run‑rate” of federal borrowing for the year. The difference between the $2.5 trillion run‑rate and the official $1.99 trillion deficit comes from how debt is measured. The $40 trillion in accumulated debt is made up of about $32 trillion owed to the public (including institutions and foreign governments) and $8 trillion in government-held debt, but interest on intragovernmental bonds is not counted, even though this involves real debt increases, and real costs in servicing debt, so $2.5 trillion is the real rise in 2026 debt, not the official report of $1.99 trillion.
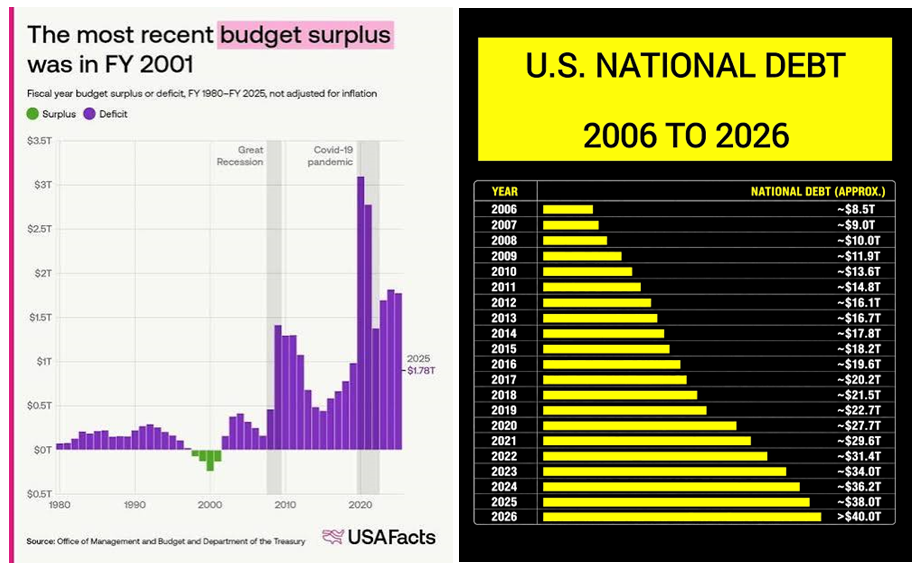
We don’t need to play CBO word games here. We can calculate the real deficit by comparing the national debt totals at the end of each fiscal year. By that calculation, the 2026 deficit totaled $2.534 trillion. As it turns out, total federal debt doubled in the last decade, from under $20 trillion in 2016 to $40 trillion now:
Graphs are for illustrative and discussion purposes only. Please read important disclosures at the end of this commentary.
This doubling of the national debt since 2016 came in a time of strong economic growth – except for that single down quarter in early 2020. What will happen if we enter a decade of slow growth, or recessions?
Here are the official budget deficits, but this chart understates the real (total) increase in the national debt:
Graphs are for illustrative and discussion purposes only. Please read important disclosures at the end of this commentary.
The sad truth is politicians of both major parties are not interested in making major budget cuts, especially in the last 25-years. Our national debt was barely $5 trillion in 2001, when the CBO predicted we could pay off the entire national debt by 2011, but instead higher spending following 9/11 doomed that prospect.
Both parties are to blame, so electing one party or another to run Congress this November offers us little hope for cost cutting. Trump and his Republican Congress are clearly responsible for this year’s five-year high in red ink (the worst year since COVID struck in 2020-21), but the Democrats and lifelong federal workers are also to blame for establishing untouchable departments with their super-high bloated budgets.
President Trump’s first term was not this spendthrift, partly since he stayed out of any new wars or major new spending programs. From 2017 to 2019, Trump averaged about $1 trillion a year in red ink, before Covid crippled our national economy. By comparison, deficits in the three full Biden years (2022 to 2024) averaged $2.34 trillion a year. Trump’s recent 2026 deficit is largely due to increased defense spending for his new wars, plus higher interest costs on the national debt, and relentlessly rising entitlement costs.
The last budget surplus came 25-years ago, in 2001, and since 2008 our national debt has quadrupled.
Graphs are for illustrative and discussion purposes only. Please read important disclosures at the end of this commentary.
Since cost-cutting is now a lost art in Washington DC, we will likely continue to see $2 trillion or more in budget deficits each year, and now those deficits must be financed at the highest interest rates since 2002.
Aren’t big numbers fun? (And they’re about to get much bigger).
All content above represents the opinion of Gary Alexander of Navellier & Associates, Inc.
Also In This Issue
A Look Ahead by Louis Navellier
France is Falling Apart – Is the EU Next?
Income Mail by Bryan Perry
What Will (or Won’t) Generate A Bullish Year End Rally
Growth Mail by Gary Alexander
U.S. Growth is Better than Expected… But Debt is Worse
Global Mail by Ivan Martchev
More New Highs for Stocks
Sector Spotlight by Jason Bodner
The Market Resembles Two Rivers – Light and Dark – Running in Tandem
View Full Archive
Read Past Issues Here
Important Disclosures:
Although information in these reports has been obtained from and is based upon sources that Navellier believes to be reliable, Navellier does not guarantee its accuracy and it may be incomplete or condensed. All opinions and estimates constitute the authors opinions as of the date the report was created and are subject to change without notice. These reports are for informational purposes only and are not a solicitation for the purchase or sale of any securities or financial services. Any decision to purchase securities mentioned in these reports must take into account existing public information on such securities or any registered prospectus. To the extent permitted by law, neither Navellier & Associates, Inc., nor any of its affiliates, agents, or service providers are providing any investment advice herein and do not assume any liability or responsibility for the readers’ decisions if any. No reader should act or refrain from acting in reliance on the information contained in this communication or for any decision based on it.
None of the stock information, data, or company information presented herein constitutes investment advice or a recommendation by Navellier or a solicitation to buy or sell any securities. Any specific securities identified and described herein do not represent any investment advice.
Information presented is general information that does not take into account your individual circumstances, financial situation, or needs, nor does it present a personalized recommendation to you. Individual stocks presented may not be suitable for every investor. Investment in securities involves significant risk and has the potential for partial or complete loss of funds invested. Investment in fixed income securities has the potential for the investment return and principal value of an investment to fluctuate so that an investor’s holdings, when redeemed, may be worth less than their original cost.
- This report contains statements that are, or may be considered to be, forward-looking statements. All statements that are not historical facts, including statements about our beliefs or expectations, are “forward-looking statements” within the meaning of The U.S. Private Securities Litigation Reform Act of 1995. These statements may be identified by such forward-looking terminology as “expect,” “estimate,” “plan,” “intend,” “believe,” “anticipate,” “may,” “will,” “should,” “could,” “continue,” “project,” or similar statements or variations of such terms. Our forward-looking statements are based on a series of expectations, assumptions, and projections, are not investment advice. All of our forward-looking statements are as of the date of this report only.
- Federal Tax Advice Disclaimer: As required by U.S. Treasury Regulations, you are informed that, to the extent this presentation mentions any federal taxes, Navellier is not presenting any tax advice and should not be used or relied on as tax advice. Navellier does not advise on any income tax requirements or issues. Use of any information presented by Navellier is for general information only and does not represent tax advice either express or implied. You are encouraged to seek professional tax advice for income tax questions and assistance.
- FactSet Disclosure: Navellier does not independently calculate the statistical information included in the attached report. The calculation and the information are provided by FactSet, a company not related to Navellier. Although information contained in the report has been obtained from FactSet and is based on sources Navellier believes to be reliable, Navellier does not guarantee its accuracy, and it may be inaccurate, incomplete or condensed. The report and the related FactSet sourced information is for general information purposes only.