
by Ivan Martchev
October 13, 2026
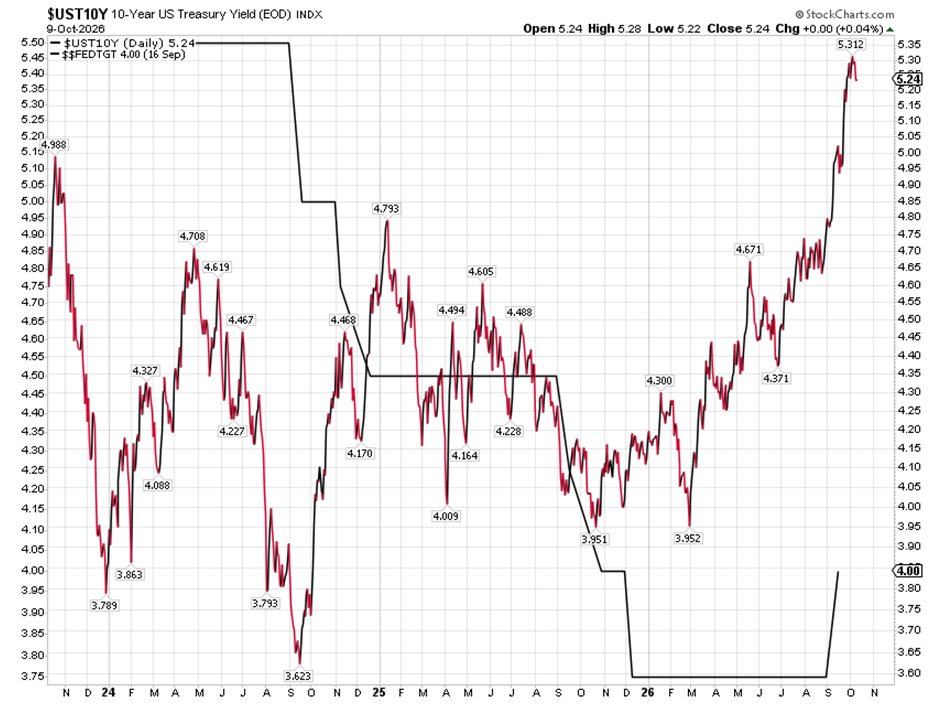
For the first time in this interest rate cycle, the stock market ignored surging yields last Monday and made fresh all-time highs on the S&P 500. Then, we saw another marginal new high for 2026 on the 10-year Treasury yield on Wednesday at 5.36% with no palpable pressure on stocks. From this, one can draw the conclusion that the stock market is itching to go higher and is feeling some type of top in interest rates.
Without escalation in Iran and with good 3Q earnings growth expected in reports, starting this week, one can see further appreciation in equities. Suffice to say that if it were not for the Iran war the stock market would have been at least 10% higher based on 30+% EPS growth expected for the whole of 2026.
Graphs are for illustrative and discussion purposes only. Please read important disclosures at the end of this commentary.
Rounding the numbers, the S&P forward P/E went from 22 at the beginning of 2026 to about 19, which would be normal with surging Treasury yields. We probably would have seen some rise in Treasury yields with an accelerating economy without the Iran war, but most likely not to this extent. The surge began on the day the war started, and it would be too simplistic to say that it would end the day the war ends.
I view the Iran war as a catalyst for the drama in the global bond markets and not necessarily the main cause of that drama. If the war were to end suddenly or soon, including an end to the deteriorating situation in Yemen, which imposes a second chokehold on global oil flows via the problematic Red Sea route, we would likely see an intermediate term top in U.S. Treasury yields.
The Fed is likely to deliver one more rate hike in December as October is too close to the election and we have yet to see events that would force the Fed’s hand to move on rates this month. The 2-year note closed Friday at 4.80%. This short term fixed-income instrument is well-known to lead Fed policy moves, and it strongly suggests one more Fed rate hike in 2026. If the elusive Iran peace breaks out, I suspect 2-year yields will move closer to the fed funds rate rather than the fed funds rate chasing the 2-year yield.
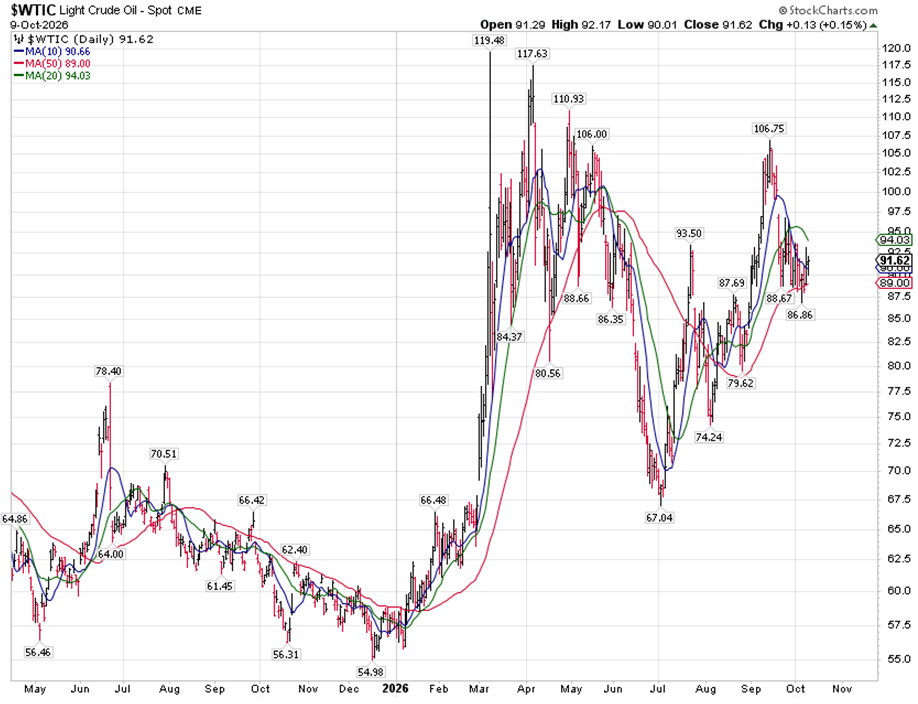
Right now, the pattern has been stocks rising and oil prices retreating. If there is a return to the Memo of Understanding (MOU) type negotiations, I think that would be enough. They say the Houthis in Yemen are an Iranian proxy, but they will immediately go dormant the minute Iranians begin to negotiate.
I wouldn’t make that assumption. Furthermore, the WTI price of crude oil is highly misleading. This is oil for delivery in Oklahoma. Oil has very different costs depending on where it originates and where it is going. Because of the situation in the Strait of Hormuz and Bab-el-Mandeb (the Red Sea route), you can safely add about $30 per barrel to either Brent or WTI crude oil in shipping costs/insurance.
Graphs are for illustrative and discussion purposes only. Please read important disclosures at the end of this commentary.
Then there is diesel fuel, which is hovering near all-time highs, where the Ukraine war also plays a role.
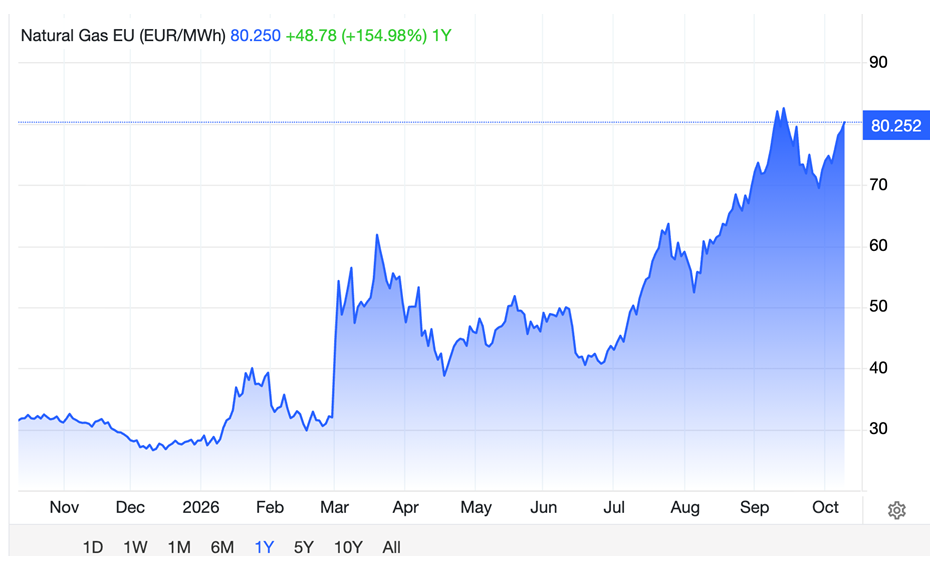
And finally, there is spot LNG, where the flows from Qatar have been severely interrupted.
Graphs are for illustrative and discussion purposes only. Please read important disclosures at the end of this commentary.
EU Natural gas (pictured above) is quoted in euros per megawatt hours (EUR/MWh), so it is a different system compared to the American dollars per million BTU (USD/mmBTU). If we were to put them both on the same basis, in U.S. dollars, the Friday close for the European benchmark of natural gas was $26.38/mmBTU while the U.S. close was $3.20/mmBTU, more than 8-fold more expensive in Europe.
This price differential is horrendous, and it has been as high as 10X in Europe last month depending on the headlines. The difference now is that U.S. natural gas is not affected at all by the Iran war and tends to rise slightly as the weather gets colder, while EU natural gas is affected dramatically by spot LNG flows and is significantly more volatile as EU underground storage is well below last year’s or 5-year average levels. Suffice to say the situation in EU natural gas can get a lot worse if the Iran war does not end soon.
The AI Battle over “Open Weight” Models
Geopolitical considerations aside, the U.S. stock market is more or less being held up by the U.S. AI capex spending boom. If it were not for data centers, U.S. GDP growth would be less than half what is reported. Treasury yields would also be lower as the competition for capital from hyperscalers and neoclouds would not be as extreme, so when the Financial Times ran a story, “OpenAI annualized revenues $20bn less than previously signaled” last Thursday, the NASDAQ 100 Index dramatically reacted.
No one bothered to consider the simple explanation between gross and net revenues, but they sold first and asked questions later. Both OpenAI and Anthropic are burning through capital and money. At some point, many stock market participants will remember what happened in the years 1999 to 2000.
Graphs are for illustrative and discussion purposes only. Please read important disclosures at the end of this commentary.
I don’t think one marginal FT story will stop the AI data center spending spree, but it could surely urge OpenAI to time its IPO better and use Anthropic as a lab rat to test the waters with its IPO later in 2026.
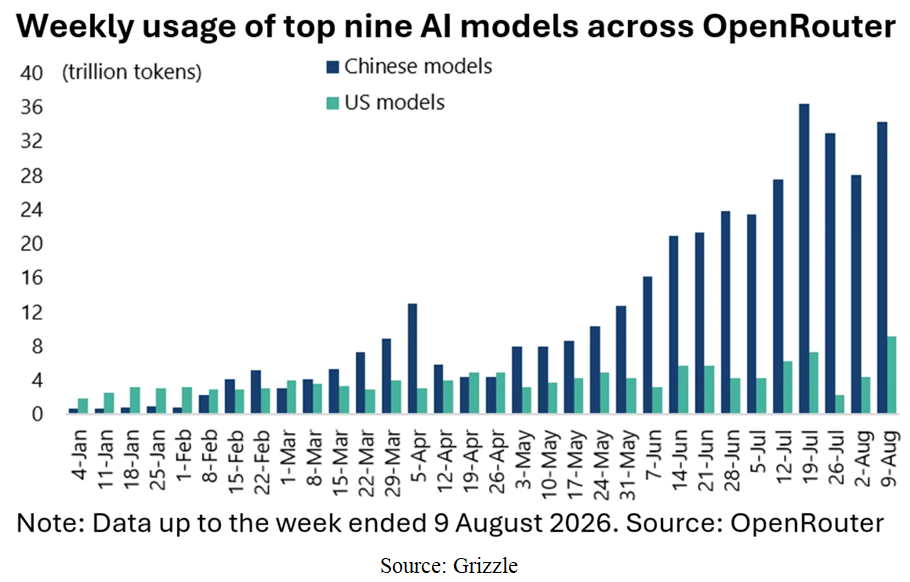
The fact remains that open-weight (a little different than open-source) Chinese AI models are gaining traction and the cost of AI has become a legitimate concern to corporations.
What I really want to know is where Chinese AI models would be without distillation, so I put that question to Chat GPT, and here is how “it” concluded its answer:
- If Chinese models are generating training examples for other models, that activity can increase token counts.
- If developers are switching everyday AI workloads to cheaper Chinese models, that also increases their token share.
- If AI agents perform more steps per task, token volume can grow even without a comparable increase in users.
OpenRouter’s data supports the second and third explanations directly, particularly for the 2026 surge. It does not quantify how much of the increase is attributable to distillation-data generation.
My conclusion: Distillation is an important part of the Chinese AI competitive strategy, but the evidence points more directly to low inference prices, competitive model quality and rapidly expanding agentic usage as the principal explanations for the surge in OpenRouter token volume.
Distillation may help create the models that make that growth possible; it is not, on the available evidence, the demonstrated primary cause of the token surge itself.
“It” sure can think.
All content above represents the opinion of Ivan Martchev of Navellier & Associates, Inc.
Also In This Issue
A Look Ahead by Louis Navellier
France is Falling Apart – Is the EU Next?
Income Mail by Bryan Perry
What Will (or Won’t) Generate A Bullish Year End Rally
Growth Mail by Gary Alexander
U.S. Growth is Better than Expected… But Debt is Worse
Global Mail by Ivan Martchev
More New Highs for Stocks
Sector Spotlight by Jason Bodner
The Market Resembles Two Rivers – Light and Dark – Running in Tandem
View Full Archive
Read Past Issues Here
Important Disclosures:
Although information in these reports has been obtained from and is based upon sources that Navellier believes to be reliable, Navellier does not guarantee its accuracy and it may be incomplete or condensed. All opinions and estimates constitute the authors opinions as of the date the report was created and are subject to change without notice. These reports are for informational purposes only and are not a solicitation for the purchase or sale of any securities or financial services. Any decision to purchase securities mentioned in these reports must take into account existing public information on such securities or any registered prospectus. To the extent permitted by law, neither Navellier & Associates, Inc., nor any of its affiliates, agents, or service providers are providing any investment advice herein and do not assume any liability or responsibility for the readers’ decisions if any. No reader should act or refrain from acting in reliance on the information contained in this communication or for any decision based on it.
None of the stock information, data, or company information presented herein constitutes investment advice or a recommendation by Navellier or a solicitation to buy or sell any securities. Any specific securities identified and described herein do not represent any investment advice.
Information presented is general information that does not take into account your individual circumstances, financial situation, or needs, nor does it present a personalized recommendation to you. Individual stocks presented may not be suitable for every investor. Investment in securities involves significant risk and has the potential for partial or complete loss of funds invested. Investment in fixed income securities has the potential for the investment return and principal value of an investment to fluctuate so that an investor’s holdings, when redeemed, may be worth less than their original cost.
- This report contains statements that are, or may be considered to be, forward-looking statements. All statements that are not historical facts, including statements about our beliefs or expectations, are “forward-looking statements” within the meaning of The U.S. Private Securities Litigation Reform Act of 1995. These statements may be identified by such forward-looking terminology as “expect,” “estimate,” “plan,” “intend,” “believe,” “anticipate,” “may,” “will,” “should,” “could,” “continue,” “project,” or similar statements or variations of such terms. Our forward-looking statements are based on a series of expectations, assumptions, and projections, are not investment advice. All of our forward-looking statements are as of the date of this report only.
- Federal Tax Advice Disclaimer: As required by U.S. Treasury Regulations, you are informed that, to the extent this presentation mentions any federal taxes, Navellier is not presenting any tax advice and should not be used or relied on as tax advice. Navellier does not advise on any income tax requirements or issues. Use of any information presented by Navellier is for general information only and does not represent tax advice either express or implied. You are encouraged to seek professional tax advice for income tax questions and assistance.
- FactSet Disclosure: Navellier does not independently calculate the statistical information included in the attached report. The calculation and the information are provided by FactSet, a company not related to Navellier. Although information contained in the report has been obtained from FactSet and is based on sources Navellier believes to be reliable, Navellier does not guarantee its accuracy, and it may be inaccurate, incomplete or condensed. The report and the related FactSet sourced information is for general information purposes only.