by Ivan Martchev
June 9, 2026
“Told you so” does not work in financial markets. Nobody knows ahead of time the precise date when an index will top out, or the precise date it will bottom. All we can do is recognize extremes – both to the upside and the downside – and then look for signs of a top or a bottom and act accordingly.
We must always beware of false signals along the way. Such is the nature of markets.
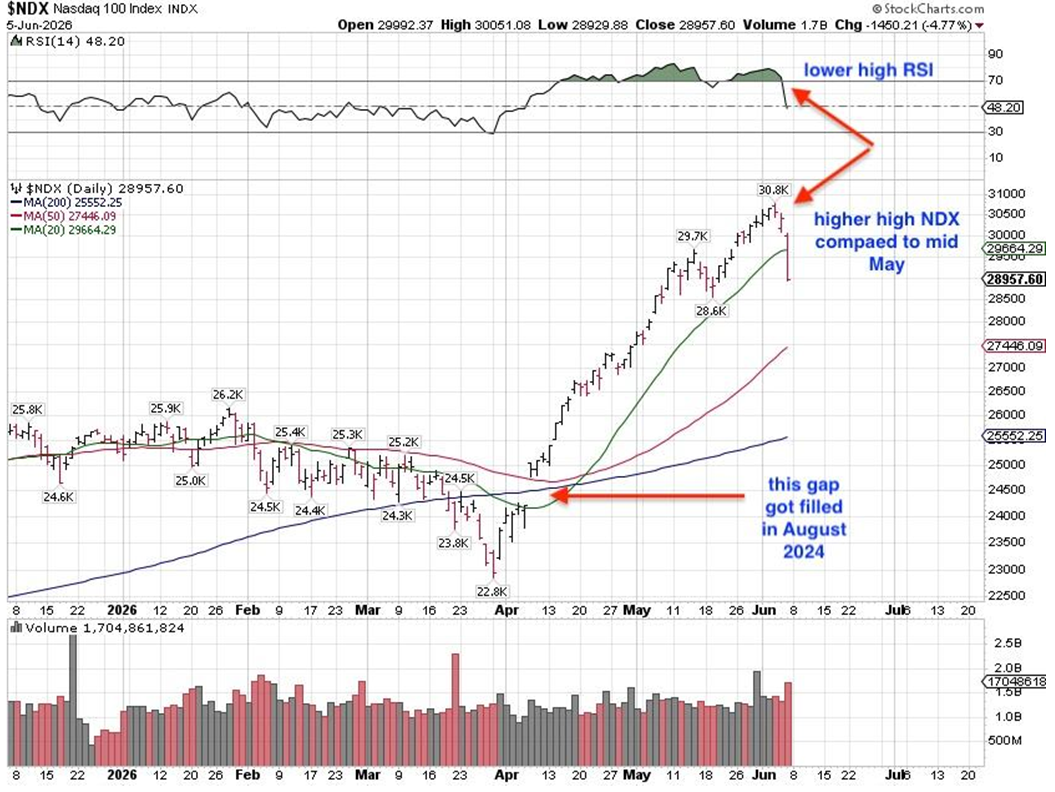
Realizing these caveats, I did go into detail as to why the stock market became the most overbought since the bull market began in October 2022. The NASDAQ 100 index was even more overbought last month than in June-July 2024; the previous extreme overbought reading (see 5-19-26: Quantifying a “Normal” Correction. I did not know when an intermediate top would come – all I knew was that we were close).
Graphs are for illustrative and discussion purposes only. Please read important disclosures at the end of this commentary.
The RSI oscillator made a lower high as the index made a higher high last week and one of the triggers was Broadcom (AVGO), whose CEO was not seen as being super bullish on the conference call, despite being positive about their spectacular earnings. As far as I am concerned, being restrained does not justify panic sales. Caution or restraint is a sign of prudence in a CEO, but the market has other ideas. Go figure.
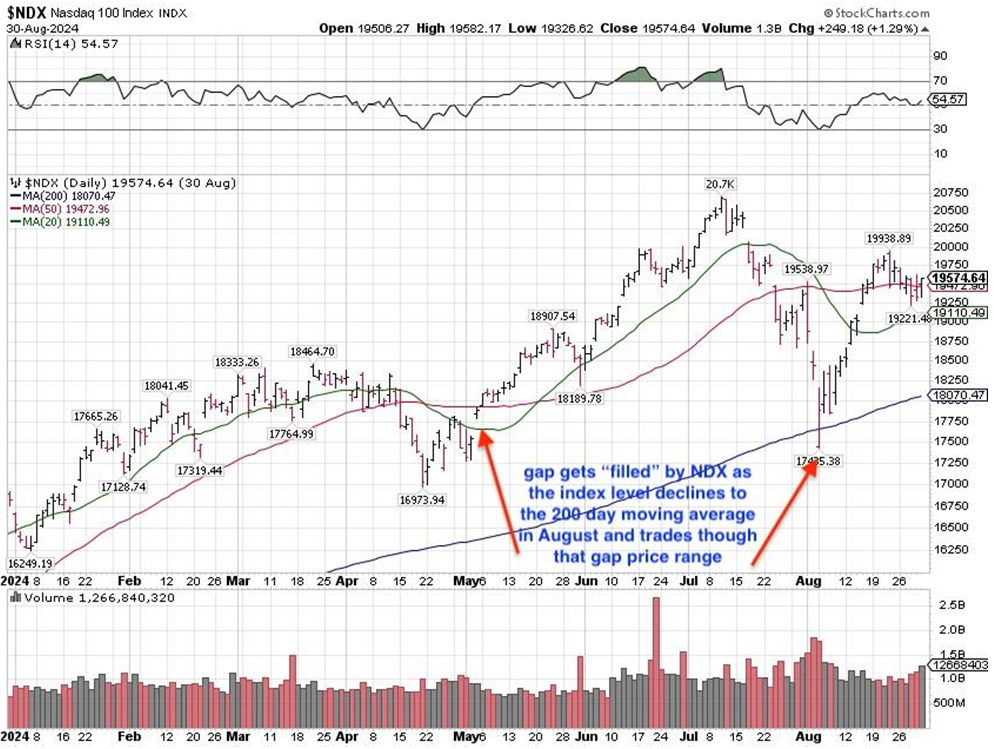
We had a similar lower high on the RSI and a higher high on NASDAQ 100 (NDX) in 2024 (see below).
Graphs are for illustrative and discussion purposes only. Please read important disclosures at the end of this commentary.
As I said before: Ask ChatGPT ‘What is RSI when it comes to stocks’ and you will get a pretty good answer. That way I will have more time going through my base-case, best-case and worst-case scenarios.
Sell-offs happen because stocks can rise too fast before they mean-revert to a more sustainable growth rate. Stock prices appreciate over time as earnings and revenues grow (see the S&P’s EPS chart in last week’s post). If stock prices dramatically rise above sustainable revenue and earnings multiples, then prices tend to mean-revert more violently. We are experiencing such a violent mean reversion now.
As I wrote recently, I thought the SpaceX IPO would mark the short-term top. Instead, it was Broadcom, with the CEO’s restrained (not overly bullish) comments. Despite that apparent trigger, the sell-off can still be partially driven by SpaceX, as investors needed to raise money to get into that IPO this Friday.
Someone said it would be no problem for SpaceX to raise $75-billion, as Google just raised $80-billion in a secondary offering. If that isn’t the proverbial apples-and-oranges fallacy, I don’t know what is. Google is a well-established company with massive cash-flows. It is spectacularly profitable and has a massive 15% stake in Anthropic to boot – in addition to its own very well-executed AI initiatives.
Google does not trade at crazy P/E or revenue multipoles, as SpaceX will when it debuts on Friday. The IPO take-in is right now $75-billion, and the implied market cap is about $1.75-trillion at that price. No matter how high SPCX stock rises above that price, I would not touch it with the proverbial 10-foot pole.
Most IPOs decline below the IPO price at 3, 6 or 12-month intervals after their debut. I don’t know if the same will happen with SPCX, but high-multiple stocks in the middle of a correction tend to become lower-multiple stocks. I think SpaceX will be successful, but I also expect it to trade at crazy multiples with very high volatility, both up and down, for years before it builds its first base on the Moon or Mars.
Because the S&P committee declined to put SpaceX in the S&P 500 before it completed the necessary profitability metrics, I must cite the explosive gains in Tesla before it entered the S&P 500, not after. The reason for those explosive gains is that it debuted as a small-cap company and grew after going public.
Now, here is an interesting comparison (via Google’s Gemini):
At its initial public offering (IPO) price of $17 per share in June 2010, Tesla’s market capitalization was approximately $1.7-billion. The IPO offered 13.3-million shares and raised roughly $226-million, resulting in an initial fully diluted valuation of roughly $1.6 to $1.7-billion at the offering price.
$1.7-billion (Tesla) versus $1.75-trillion (SpaceX) is quite the difference. I have no problem with people buying SPCX and holding it while Elon makes Mars his permanent residence, but not this Friday and not if the IPO rises dramatically above its IPO price of $135 in the middle of an intermediate-term correction.
Graphs are for illustrative and discussion purposes only. Please read important disclosures at the end of this commentary.
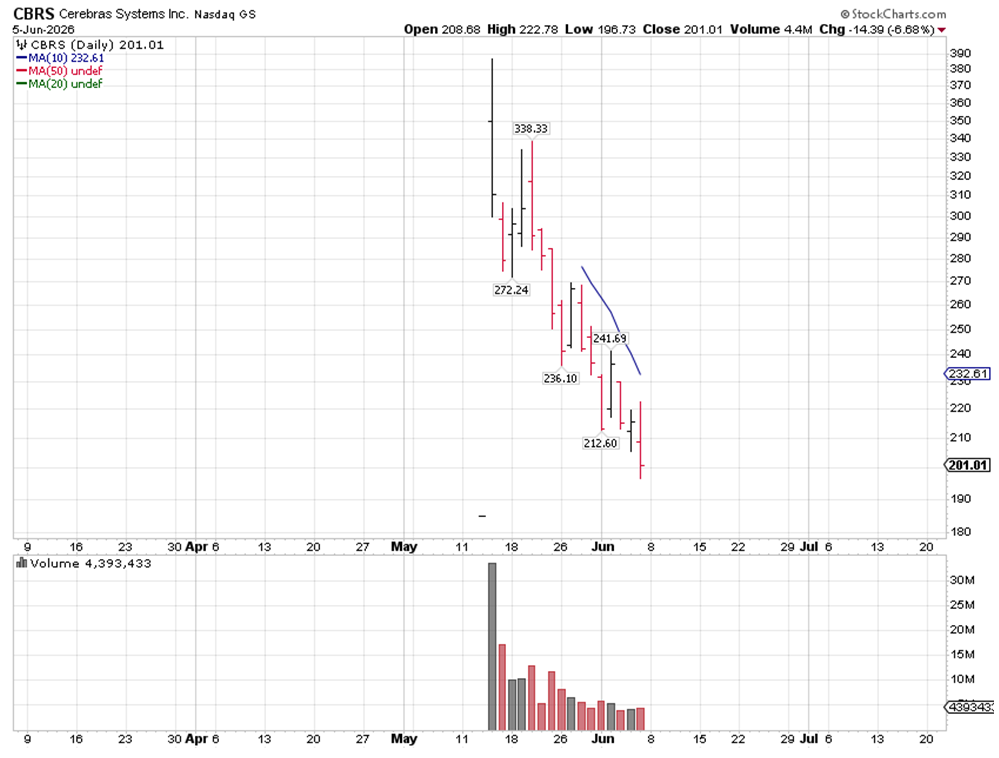
Cerebras Systems (CBRS) is an extreme example of a smaller company that had (and still has!) an insanely high revenue multiple at the time of the IPO, and it illustrates the point well. Its IPO price was $185 per share on May 13 and it reached $386.34 on the first day of trading. Last Friday it traded back down to $196.73. I think the odds are at least 75% that it will break below its IPO price before this correction in the market is over, which is to say sometime in June. I will update this chart at the end of June to see by how much it declines below the $185 IPO price – and I think the same can happen to SPCX .
With all those caveats in mind, here are three scenarios – my base-case, best-case and worst-case scenarios for the stock market and NASDAQ 100 Index – the favorite of index for many investors.
Base-case: The Iran war temporarily reignites, sending oil and bond yields higher, pushing indexes lower for 2-3 weeks. The key is the Iran war not going out of control – and being settled during June.
Best-case: Most of the decline is behind us and we stabilize this week or next due to an Iran peace deal. Oil and bond yields will decline. The lows of this sell-off will be capped near the May lows.
Worst-case: The Iran war goes out of control, oil begins to trade above $120 per barrel and the 10-year Treasury bond yield reaches or breaches 5%. In that case, the whole rally unravels.
I don’t believe the White House wants to see this worst case war scenario, but I am pretty sure Israel would rather go that route, based on their recent statements, and Iran may be considering it. Israel views Iran as an existential threat and would rather do more damage now when so much U.S. firepower is in the Persian Gulf (see New York Times June 6, “Pentagon Sees Growing Espionage Threat from Israel”).
I am inclined to lean toward the base-case scenario, as I can see the Iranians dragging their feet and the Israelis itching to go after their more localized threat, the Hezbollah in Lebanon (an Iranian proxy which is not playing ball). Iran knows the mathematics of oil and knows the longer the Strait of Hormuz is mostly blocked, with oil not flowing at a maximum rate, the pressure on the U.S. will keep increasing.
It is a high-stakes geopolitical game of chicken that has trillions of dollars of investor assets on the line. Factset reported Q1 EPS growth at 28.8% for the S&P 500. For Q2 EPS growth is estimated right now to come in at 21.7%. If we do not get a worst-case scenario derailing the U.S. economy, that kind of earnings growth will help the stock market recover – and then some.
Navellier & Associates; own Alphabet Inc. Class A (GOOGL) and Broadcom (AVGO) in managed accounts. A few accounts own Tesla (TSLA) per client request. We do not own Cerebras Systems (CBRS). Ivan Martchev does not own Alphabet Inc. Class A (GOOGL), Broadcom (AVGO), Tesla (TSLA), or Cerebras Systems CBRS) personally.
All content above represents the opinion of Ivan Martchev of Navellier & Associates, Inc.
Also In This Issue
A Look Ahead by Louis Navellier
The Bears Were Caught Short in This Booming Market
Income Mail by Bryan Perry
Mr. Market Is Sorely Misreading the Employment Data
Growth Mail by Gary Alexander
Gold is Down $1,000 Since January: Is the Gold Bull Market Over?
Global Mail by Ivan Martchev
Friday’s Sell-off Was Bound to Happen – What’s Next?
Sector Spotlight by Jason Bodner
When Sidelined Cash Goes Looking for a Home
View Full Archive
Read Past Issues Here

Ivan Martchev
INVESTMENT STRATEGIST
Ivan Martchev is an investment strategist with Navellier. Previously, Ivan served as editorial director at InvestorPlace Media. Ivan was editor of Louis Rukeyser’s Mutual Funds and associate editor of Personal Finance. Ivan is also co-author of The Silk Road to Riches (Financial Times Press). The book provided analysis of geopolitical issues and investment strategy in natural resources and emerging markets with an emphasis on Asia. The book also correctly predicted the collapse in the U.S. real estate market, the rise of precious metals, and the resulting increased investor interest in emerging markets. Ivan’s commentaries have been published by MSNBC, The Motley Fool, MarketWatch, and others. All content of “Global Mail” represents the opinion of Ivan Martchev
Important Disclosures:
Although information in these reports has been obtained from and is based upon sources that Navellier believes to be reliable, Navellier does not guarantee its accuracy and it may be incomplete or condensed. All opinions and estimates constitute Navellier’s judgment as of the date the report was created and are subject to change without notice. These reports are for informational purposes only and are not a solicitation for the purchase or sale of a security. Any decision to purchase securities mentioned in these reports must take into account existing public information on such securities or any registered prospectus.To the extent permitted by law, neither Navellier & Associates, Inc., nor any of its affiliates, agents, or service providers assumes any liability or responsibility nor owes any duty of care for any consequences of any person acting or refraining to act in reliance on the information contained in this communication or for any decision based on it.
Past performance is no indication of future results. Investment in securities involves significant risk and has the potential for partial or complete loss of funds invested. It should not be assumed that any securities recommendations made by Navellier. in the future will be profitable or equal the performance of securities made in this report. Dividend payments are not guaranteed. The amount of a dividend payment, if any, can vary over time and issuers may reduce dividends paid on securities in the event of a recession or adverse event affecting a specific industry or issuer.
None of the stock information, data, and company information presented herein constitutes a recommendation by Navellier or a solicitation to buy or sell any securities. Any specific securities identified and described do not represent all of the securities purchased, sold, or recommended for advisory clients. The holdings identified do not represent all of the securities purchased, sold, or recommended for advisory clients and the reader should not assume that investments in the securities identified and discussed were or will be profitable.
Information presented is general information that does not take into account your individual circumstances, financial situation, or needs, nor does it present a personalized recommendation to you. Individual stocks presented may not be suitable for every investor. Investment in securities involves significant risk and has the potential for partial or complete loss of funds invested. Investment in fixed income securities has the potential for the investment return and principal value of an investment to fluctuate so that an investor’s holdings, when redeemed, may be worth less than their original cost.
One cannot invest directly in an index. Index is unmanaged and index performance does not reflect deduction of fees, expenses, or taxes. Presentation of Index data does not reflect a belief by Navellier that any stock index constitutes an investment alternative to any Navellier equity strategy or is necessarily comparable to such strategies. Among the most important differences between the Indices and Navellier strategies are that the Navellier equity strategies may (1) incur material management fees, (2) concentrate its investments in relatively few stocks, industries, or sectors, (3) have significantly greater trading activity and related costs, and (4) be significantly more or less volatile than the Indices.
ETF Risk: We may invest in exchange traded funds (“ETFs”) and some of our investment strategies are generally fully invested in ETFs. Like traditional mutual funds, ETFs charge asset-based fees, but they generally do not charge initial sales charges or redemption fees and investors typically pay only customary brokerage fees to buy and sell ETF shares. The fees and costs charged by ETFs held in client accounts will not be deducted from the compensation the client pays Navellier. ETF prices can fluctuate up or down, and a client account could lose money investing in an ETF if the prices of the securities owned by the ETF go down. ETFs are subject to additional risks:
- ETF shares may trade above or below their net asset value;
- An active trading market for an ETF’s shares may not develop or be maintained;
- The value of an ETF may be more volatile than the underlying portfolio of securities the ETF is designed to track;
- The cost of owning shares of the ETF may exceed those a client would incur by directly investing in the underlying securities; and
- Trading of an ETF’s shares may be halted if the listing exchange’s officials deem it appropriate, the shares are delisted from the exchange, or the activation of market-wide “circuit breakers” (which are tied to large decreases in stock prices) halts stock trading generally.
Grader Disclosures: Investment in equity strategies involves substantial risk and has the potential for partial or complete loss of funds invested. The sample portfolio and any accompanying charts are for informational purposes only and are not to be construed as a solicitation to buy or sell any financial instrument and should not be relied upon as the sole factor in an investment making decision. As a matter of normal and important disclosures to you, as a potential investor, please consider the following: The performance presented is not based on any actual securities trading, portfolio, or accounts, and the reported performance of the A, B, C, D, and F portfolios (collectively the “model portfolios”) should be considered mere “paper” or pro forma performance results based on Navellier’s research.
Investors evaluating any of Navellier & Associates, Inc.’s, (or its affiliates’) Investment Products must not use any information presented here, including the performance figures of the model portfolios, in their evaluation of any Navellier Investment Products. Navellier Investment Products include the firm’s mutual funds and managed accounts. The model portfolios, charts, and other information presented do not represent actual funded trades and are not actual funded portfolios. There are material differences between Navellier Investment Products’ portfolios and the model portfolios, research, and performance figures presented here. The model portfolios and the research results (1) may contain stocks or ETFs that are illiquid and difficult to trade; (2) may contain stock or ETF holdings materially different from actual funded Navellier Investment Product portfolios; (3) include the reinvestment of all dividends and other earnings, estimated trading costs, commissions, or management fees; and, (4) may not reflect prices obtained in an actual funded Navellier Investment Product portfolio. For these and other reasons, the reported performances of model portfolios do not reflect the performance results of Navellier’s actually funded and traded Investment Products. In most cases, Navellier’s Investment Products have materially lower performance results than the performances of the model portfolios presented.
This report contains statements that are, or may be considered to be, forward-looking statements. All statements that are not historical facts, including statements about our beliefs or expectations, are “forward-looking statements” within the meaning of The U.S. Private Securities Litigation Reform Act of 1995. These statements may be identified by such forward-looking terminology as “expect,” “estimate,” “plan,” “intend,” “believe,” “anticipate,” “may,” “will,” “should,” “could,” “continue,” “project,” or similar statements or variations of such terms. Our forward-looking statements are based on a series of expectations, assumptions, and projections, are not guarantees of future results or performance, and involve substantial risks and uncertainty as described in Form ADV Part 2A of our filing with the Securities and Exchange Commission (SEC), which is available at www.adviserinfo.sec.gov or by requesting a copy by emailing info@navellier.com. All of our forward-looking statements are as of the date of this report only. We can give no assurance that such expectations or forward-looking statements will prove to be correct. Actual results may differ materially. You are urged to carefully consider all such factors.
FEDERAL TAX ADVICE DISCLAIMER: As required by U.S. Treasury Regulations, you are informed that, to the extent this presentation includes any federal tax advice, the presentation is not written by Navellier to be used, and cannot be used, for the purpose of avoiding federal tax penalties. Navellier does not advise on any income tax requirements or issues. Use of any information presented by Navellier is for general information only and does not represent tax advice either express or implied. You are encouraged to seek professional tax advice for income tax questions and assistance.
IMPORTANT NEWSLETTER DISCLOSURE:The hypothetical performance results for investment newsletters that are authored or edited by Louis Navellier, including Louis Navellier’s Growth Investor, Louis Navellier’s Breakthrough Stocks, Louis Navellier’s Accelerated Profits, and Louis Navellier’s Platinum Club, are not based on any actual securities trading, portfolio, or accounts, and the newsletters’ reported hypothetical performances should be considered mere “paper” or proforma hypothetical performance results and are not actual performance of real world trades. Navellier & Associates, Inc. does not have any relation to or affiliation with the owner of these newsletters. There are material differences between Navellier Investment Products’ portfolios and the InvestorPlace Media, LLC newsletter portfolios authored by Louis Navellier. The InvestorPlace Media, LLC newsletters contain hypothetical performance that do not include transaction costs, advisory fees, or other fees a client might incur if actual investments and trades were being made by an investor. As a result, newsletter performance should not be used to evaluate Navellier Investment services which are separate and different from the newsletters. The owner of the newsletters is InvestorPlace Media, LLC and any questions concerning the newsletters, including any newsletter advertising or hypothetical Newsletter performance claims, (which are calculated solely by Investor Place Media and not Navellier) should be referred to InvestorPlace Media, LLC at (800) 718-8289.
Please note that Navellier & Associates and the Navellier Private Client Group are managed completely independent of the newsletters owned and published by InvestorPlace Media, LLC and written and edited by Louis Navellier, and investment performance of the newsletters should in no way be considered indicative of potential future investment performance for any Navellier & Associates separately managed account portfolio. Potential investors should consult with their financial advisor before investing in any Navellier Investment Product.
Navellier claims compliance with Global Investment Performance Standards (GIPS). To receive a complete list and descriptions of Navellier’s composites and/or a presentation that adheres to the GIPS standards, please contact Navellier or click here. It should not be assumed that any securities recommendations made by Navellier & Associates, Inc. in the future will be profitable or equal the performance of securities made in this report.
FactSet Disclosure: Navellier does not independently calculate the statistical information included in the attached report. The calculation and the information are provided by FactSet, a company not related to Navellier. Although information contained in the report has been obtained from FactSet and is based on sources Navellier believes to be reliable, Navellier does not guarantee its accuracy, and it may be incomplete or condensed. The report and the related FactSet sourced information are provided on an “as is” basis. The user assumes the entire risk of any use made of this information. Investors should consider the report as only a single factor in making their investment decision. The report is for informational purposes only and is not intended as an offer or solicitation for the purchase or sale of a security. FactSet sourced information is the exclusive property of FactSet. Without prior written permission of FactSet, this information may not be reproduced, disseminated or used to create any financial products. All indices are unmanaged and performance of the indices include reinvestment of dividends and interest income, unless otherwise noted, are not illustrative of any particular investment and an investment cannot be made in any index. Past performance is no guarantee of future results.