by Bryan Perry
June 9, 2026
There is no question Friday was ugly. The market was crushed on Friday because two forces hit simultaneously – first, a violent AI‑chip unwind and then a macro shock from the labor market that blew up the “rate‑cuts‑are-coming” narrative. This wasn’t a random air‑pocket, it was cascade of selling pressure led by overleveraged traders who were massively overweight AI: All hit the sell button at once.
To me, this looks more like a violent shakeout than a red flag for the AI super cycle. The fundamental AI build-out story (capex, GPU demand, cloud AI revenue) is intact, but the market was extremely crowded in big technology names, which dominate index weighting as selling momentum fed on itself all day Friday.
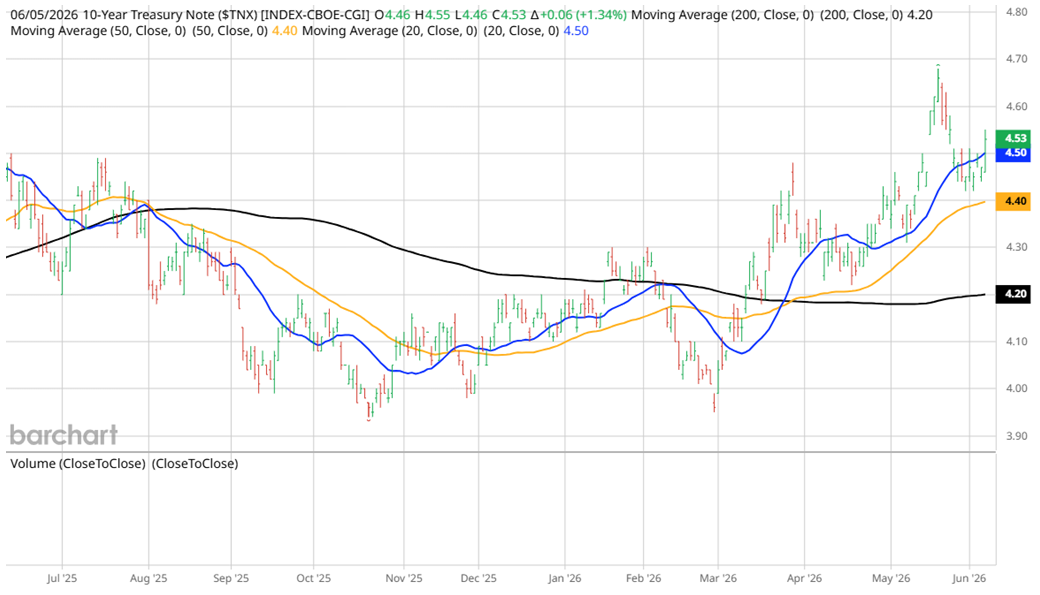
Putting the sell-off into perspective, the yield on the benchmark 10-year Treasury moved up only six-basis points to 4.53% even though sentiment shifted to the notion of another rate hike by year end.
The underlying jobs data was considerably more nuanced than the headline payroll number suggested.
Graphs are for illustrative and discussion purposes only. Please read important disclosures at the end of this commentary.
Average hourly earnings rose just 0.3% for the month and 3.4% year-over-year, both exactly in line with Wall Street consensus. This is the number the Fed watches most closely for inflation pass-through, and it gave no new inflationary signal. The jobless rate stayed at 4.3%, unchanged for three-straight months.
Turning to the all-important details, the bulk of job gains came from just two-sectors: (1) leisure and hospitality (70,000), mostly in food services and bars, and (2) local government (55,000). In third place came healthcare, with 35,000. Financial job totals actually declined. With most jobs coming from two sectors – the low-wage leisure sector, and government – this does not reflect broad-based labor demand.
At a historic low of 61.8%, the labor force participation was flat, and the employment-population ratio barely moved. Long-term unemployment is quietly deteriorating. The number of people unemployed for 27-weeks or longer is up to 524,000 over the past year and now accounts for 27.5% of all jobless, the highest in this cycle. This is a low-hire, low-fire market: steady if you have a job, hard if you’ve lost one.
The headline total was genuinely strong and hard to dismiss, but wages were weak, and the composition of job growth was soft. The market’s aggressive reaction, sending rate-sensitive AI and technology stocks down by 4.2% arguably overshot over-estimated the overall inflation picture from the details of the report.
Outplacement firm Challenger, Gray & Christmas said there were 38,242 high-paying technology-sector job eliminations in May, a level not seen since August 2024. Through the first five-months of 2026, no other industry came close to technology’s 123,653 announced cuts, a 66% rise from the same months in 2025.
Artificial intelligence was cited as the top reason for layoffs across all industries for the third consecutive month. AI-related cuts reached 40% of all announced cuts, the highest monthly total since Challenger began tracking industries in 2023. That share has climbed from 7% in January to 26% in April. For the year-to-date, AI has led to 87,714 cuts, already surpassing the 54,836 cuts attributed to all of 2025.
The broader trend is even more substantial in scope. According to the Bureau of Labor Statistics, employment within information technology is off 11% from its peak in 2022. Technology layoffs topped 100,000 in the first five-months of 2026, with companies explicitly citing AI as the driver of restructuring.
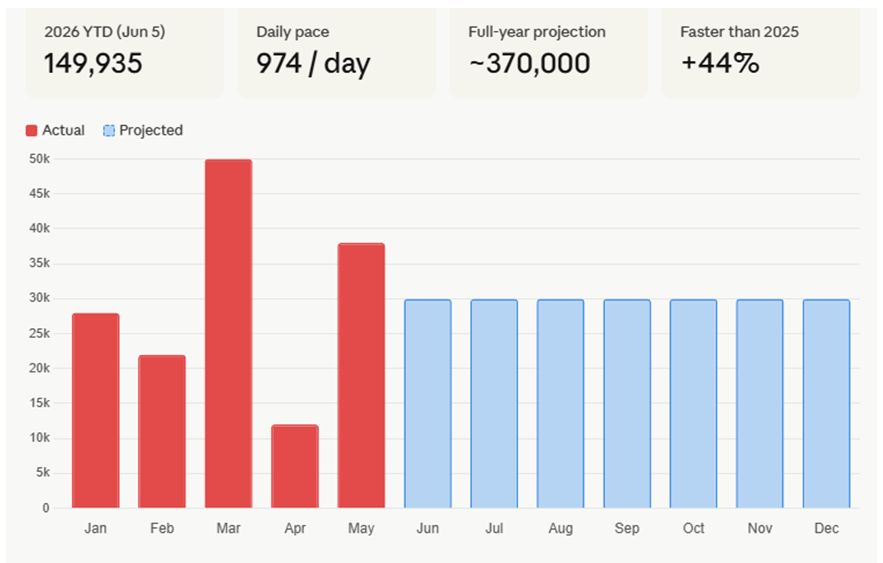
The actual rundown of the biggest technology layoffs in 2026 so far totals over 142,000 cuts in the first five-months of 2026, representing a 33% increase over the same period last year, even as the same employers post record revenues and commit to the largest concentrated infrastructure build-out in technology history.
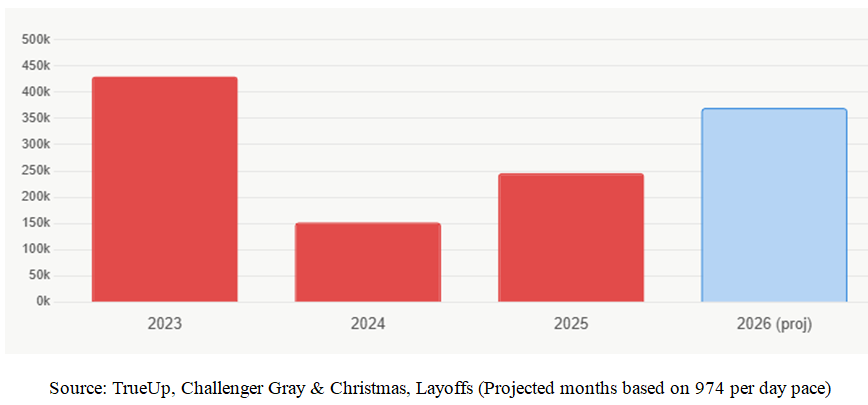
The milestone, tracked by workforce analytics firm TrueUp, puts the industry on pace for a full-year total that could approach 370,000 – a figure that would rival the post-pandemic record of 430,000 set in 2023.
Graphs are for illustrative and discussion purposes only. Please read important disclosures at the end of this commentary.
This adds an important layer of data to the May jobs report. The high-technology sector, associated with rising productivity and innovation, is shedding jobs at an accelerating pace. That doesn’t reflect broad economic strength but structural reallocation. AI capex is soaring but the human workforce is contracting to fund it.
For the Fed rate hike narrative, this bifurcation implies the hot headline number overstates true labor demand considerably. A laid-off tech worker in 2026 loses an estimated $14,400 per month in salary and benefits. The average total compensation package including equity and benefits runs $185,000 annually.
With an estimated 142,000 workers laid off, direct annual compensation loss amounts to $26.3-billion with monthly income removed from the economy estimated at $2.2-billion. Then there is a multiplier effect. Technology workers are economically disproportionate for a specific reason: each high-paying technology job creates an estimated 4 to 5 local service jobs in restaurants, retail, childcare, home services and the like.
This local job multiplier effect is particularly powerful for high-income earners because they spend a larger dollar amount locally even if their savings rate is higher. Applying a conservative multiplier of 4x to the direct income loss means lost economic activity destroys approximately $105-billion annually.
If this 142,000 job loss becomes 370,000 by year end, it becomes structurally significant. If the jobs report pattern holds, tech shedding high-compensation roles while leisure, hospitality, and government absorb the headline number, the economy is replacing roughly $68.5-billion in annual technology wages with jobs paying an average of around $45,000, generating perhaps $16.7-billion in replacement wages.
That’s a net annual consumer spending power loss of roughly $51.8-billion just on direct wages, before the multiplier, which brings total economic losses to $274-billion per year this trend plays out. That is roughly the same economic output as the total GDP of prosperous states like Nevada or Connecticut.
The rehire rate matters enormously. If 80% of displaced workers land new jobs within 3 to 6-months at 80% of prior wages, the permanent GDP drag shrinks dramatically. The worry is that this cycle is structurally different, since general software engineer job postings are now 49% below pre-pandemic baseline, and the new AI-adjacent jobs being created will likely number far fewer than those being eliminated.
The irony embedded in those statistics is hard to overstate. The companies building AI are simultaneously responsible for cratering the highest paying layer of the job market. This is probably why bond investors didn’t panic on Friday – like stock investors did. The headline number triggered a “sell first, ask questions later” blow off, but in reality, it also presented a compelling pullback for those looking under the surface.
All content above represents the opinion of Bryan Perry of Navellier & Associates, Inc.
Also In This Issue
A Look Ahead by Louis Navellier
The Bears Were Caught Short in This Booming Market
Income Mail by Bryan Perry
Mr. Market Is Sorely Misreading the Employment Data
Growth Mail by Gary Alexander
Gold is Down $1,000 Since January: Is the Gold Bull Market Over?
Global Mail by Ivan Martchev
Friday’s Sell-off Was Bound to Happen – What’s Next?
Sector Spotlight by Jason Bodner
When Sidelined Cash Goes Looking for a Home
View Full Archive
Read Past Issues Here

Bryan Perry
SENIOR DIRECTOR
Bryan Perry is a Senior Director with Navellier Private Client Group, advising and facilitating high net worth investors in the pursuit of their financial goals.
Bryan’s financial services career spanning the past three decades includes over 20-years of wealth management experience with Wall Street firms that include Bear Stearns, Lehman Brothers and Paine Webber, working with both retail and institutional clients. Bryan earned a B.A. in Political Science from Virginia Polytechnic Institute & State University and currently holds a Series 65 license. All content of “Income Mail” represents the opinion of Bryan Perry
Important Disclosures:
Although information in these reports has been obtained from and is based upon sources that Navellier believes to be reliable, Navellier does not guarantee its accuracy and it may be incomplete or condensed. All opinions and estimates constitute Navellier’s judgment as of the date the report was created and are subject to change without notice. These reports are for informational purposes only and are not a solicitation for the purchase or sale of a security. Any decision to purchase securities mentioned in these reports must take into account existing public information on such securities or any registered prospectus.To the extent permitted by law, neither Navellier & Associates, Inc., nor any of its affiliates, agents, or service providers assumes any liability or responsibility nor owes any duty of care for any consequences of any person acting or refraining to act in reliance on the information contained in this communication or for any decision based on it.
Past performance is no indication of future results. Investment in securities involves significant risk and has the potential for partial or complete loss of funds invested. It should not be assumed that any securities recommendations made by Navellier. in the future will be profitable or equal the performance of securities made in this report. Dividend payments are not guaranteed. The amount of a dividend payment, if any, can vary over time and issuers may reduce dividends paid on securities in the event of a recession or adverse event affecting a specific industry or issuer.
None of the stock information, data, and company information presented herein constitutes a recommendation by Navellier or a solicitation to buy or sell any securities. Any specific securities identified and described do not represent all of the securities purchased, sold, or recommended for advisory clients. The holdings identified do not represent all of the securities purchased, sold, or recommended for advisory clients and the reader should not assume that investments in the securities identified and discussed were or will be profitable.
Information presented is general information that does not take into account your individual circumstances, financial situation, or needs, nor does it present a personalized recommendation to you. Individual stocks presented may not be suitable for every investor. Investment in securities involves significant risk and has the potential for partial or complete loss of funds invested. Investment in fixed income securities has the potential for the investment return and principal value of an investment to fluctuate so that an investor’s holdings, when redeemed, may be worth less than their original cost.
One cannot invest directly in an index. Index is unmanaged and index performance does not reflect deduction of fees, expenses, or taxes. Presentation of Index data does not reflect a belief by Navellier that any stock index constitutes an investment alternative to any Navellier equity strategy or is necessarily comparable to such strategies. Among the most important differences between the Indices and Navellier strategies are that the Navellier equity strategies may (1) incur material management fees, (2) concentrate its investments in relatively few stocks, industries, or sectors, (3) have significantly greater trading activity and related costs, and (4) be significantly more or less volatile than the Indices.
ETF Risk: We may invest in exchange traded funds (“ETFs”) and some of our investment strategies are generally fully invested in ETFs. Like traditional mutual funds, ETFs charge asset-based fees, but they generally do not charge initial sales charges or redemption fees and investors typically pay only customary brokerage fees to buy and sell ETF shares. The fees and costs charged by ETFs held in client accounts will not be deducted from the compensation the client pays Navellier. ETF prices can fluctuate up or down, and a client account could lose money investing in an ETF if the prices of the securities owned by the ETF go down. ETFs are subject to additional risks:
- ETF shares may trade above or below their net asset value;
- An active trading market for an ETF’s shares may not develop or be maintained;
- The value of an ETF may be more volatile than the underlying portfolio of securities the ETF is designed to track;
- The cost of owning shares of the ETF may exceed those a client would incur by directly investing in the underlying securities; and
- Trading of an ETF’s shares may be halted if the listing exchange’s officials deem it appropriate, the shares are delisted from the exchange, or the activation of market-wide “circuit breakers” (which are tied to large decreases in stock prices) halts stock trading generally.
Grader Disclosures: Investment in equity strategies involves substantial risk and has the potential for partial or complete loss of funds invested. The sample portfolio and any accompanying charts are for informational purposes only and are not to be construed as a solicitation to buy or sell any financial instrument and should not be relied upon as the sole factor in an investment making decision. As a matter of normal and important disclosures to you, as a potential investor, please consider the following: The performance presented is not based on any actual securities trading, portfolio, or accounts, and the reported performance of the A, B, C, D, and F portfolios (collectively the “model portfolios”) should be considered mere “paper” or pro forma performance results based on Navellier’s research.
Investors evaluating any of Navellier & Associates, Inc.’s, (or its affiliates’) Investment Products must not use any information presented here, including the performance figures of the model portfolios, in their evaluation of any Navellier Investment Products. Navellier Investment Products include the firm’s mutual funds and managed accounts. The model portfolios, charts, and other information presented do not represent actual funded trades and are not actual funded portfolios. There are material differences between Navellier Investment Products’ portfolios and the model portfolios, research, and performance figures presented here. The model portfolios and the research results (1) may contain stocks or ETFs that are illiquid and difficult to trade; (2) may contain stock or ETF holdings materially different from actual funded Navellier Investment Product portfolios; (3) include the reinvestment of all dividends and other earnings, estimated trading costs, commissions, or management fees; and, (4) may not reflect prices obtained in an actual funded Navellier Investment Product portfolio. For these and other reasons, the reported performances of model portfolios do not reflect the performance results of Navellier’s actually funded and traded Investment Products. In most cases, Navellier’s Investment Products have materially lower performance results than the performances of the model portfolios presented.
This report contains statements that are, or may be considered to be, forward-looking statements. All statements that are not historical facts, including statements about our beliefs or expectations, are “forward-looking statements” within the meaning of The U.S. Private Securities Litigation Reform Act of 1995. These statements may be identified by such forward-looking terminology as “expect,” “estimate,” “plan,” “intend,” “believe,” “anticipate,” “may,” “will,” “should,” “could,” “continue,” “project,” or similar statements or variations of such terms. Our forward-looking statements are based on a series of expectations, assumptions, and projections, are not guarantees of future results or performance, and involve substantial risks and uncertainty as described in Form ADV Part 2A of our filing with the Securities and Exchange Commission (SEC), which is available at www.adviserinfo.sec.gov or by requesting a copy by emailing info@navellier.com. All of our forward-looking statements are as of the date of this report only. We can give no assurance that such expectations or forward-looking statements will prove to be correct. Actual results may differ materially. You are urged to carefully consider all such factors.
FEDERAL TAX ADVICE DISCLAIMER: As required by U.S. Treasury Regulations, you are informed that, to the extent this presentation includes any federal tax advice, the presentation is not written by Navellier to be used, and cannot be used, for the purpose of avoiding federal tax penalties. Navellier does not advise on any income tax requirements or issues. Use of any information presented by Navellier is for general information only and does not represent tax advice either express or implied. You are encouraged to seek professional tax advice for income tax questions and assistance.
IMPORTANT NEWSLETTER DISCLOSURE:The hypothetical performance results for investment newsletters that are authored or edited by Louis Navellier, including Louis Navellier’s Growth Investor, Louis Navellier’s Breakthrough Stocks, Louis Navellier’s Accelerated Profits, and Louis Navellier’s Platinum Club, are not based on any actual securities trading, portfolio, or accounts, and the newsletters’ reported hypothetical performances should be considered mere “paper” or proforma hypothetical performance results and are not actual performance of real world trades. Navellier & Associates, Inc. does not have any relation to or affiliation with the owner of these newsletters. There are material differences between Navellier Investment Products’ portfolios and the InvestorPlace Media, LLC newsletter portfolios authored by Louis Navellier. The InvestorPlace Media, LLC newsletters contain hypothetical performance that do not include transaction costs, advisory fees, or other fees a client might incur if actual investments and trades were being made by an investor. As a result, newsletter performance should not be used to evaluate Navellier Investment services which are separate and different from the newsletters. The owner of the newsletters is InvestorPlace Media, LLC and any questions concerning the newsletters, including any newsletter advertising or hypothetical Newsletter performance claims, (which are calculated solely by Investor Place Media and not Navellier) should be referred to InvestorPlace Media, LLC at (800) 718-8289.
Please note that Navellier & Associates and the Navellier Private Client Group are managed completely independent of the newsletters owned and published by InvestorPlace Media, LLC and written and edited by Louis Navellier, and investment performance of the newsletters should in no way be considered indicative of potential future investment performance for any Navellier & Associates separately managed account portfolio. Potential investors should consult with their financial advisor before investing in any Navellier Investment Product.
Navellier claims compliance with Global Investment Performance Standards (GIPS). To receive a complete list and descriptions of Navellier’s composites and/or a presentation that adheres to the GIPS standards, please contact Navellier or click here. It should not be assumed that any securities recommendations made by Navellier & Associates, Inc. in the future will be profitable or equal the performance of securities made in this report.
FactSet Disclosure: Navellier does not independently calculate the statistical information included in the attached report. The calculation and the information are provided by FactSet, a company not related to Navellier. Although information contained in the report has been obtained from FactSet and is based on sources Navellier believes to be reliable, Navellier does not guarantee its accuracy, and it may be incomplete or condensed. The report and the related FactSet sourced information are provided on an “as is” basis. The user assumes the entire risk of any use made of this information. Investors should consider the report as only a single factor in making their investment decision. The report is for informational purposes only and is not intended as an offer or solicitation for the purchase or sale of a security. FactSet sourced information is the exclusive property of FactSet. Without prior written permission of FactSet, this information may not be reproduced, disseminated or used to create any financial products. All indices are unmanaged and performance of the indices include reinvestment of dividends and interest income, unless otherwise noted, are not illustrative of any particular investment and an investment cannot be made in any index. Past performance is no guarantee of future results.