
by Jason Bodner
September 22, 2026
When the light is low, our eyes shift from cones to rods. While our cones handle all colors in brightly lit conditions, our rods take over in the dark. Known as the Purkinje Effect, vivid reds nearly disappear, and blues and greens become more visible. Your eyes are working fine, but the light conditions change.
What you see depends on how your eyes reflect the same reality – not just what is (objectively) “there.”
Many investors look at the major indexes – now within 3% of all-time highs – and assume everything looks fine. But if you scan 5,000+ individual stocks, as I do each week, a very different picture emerges.
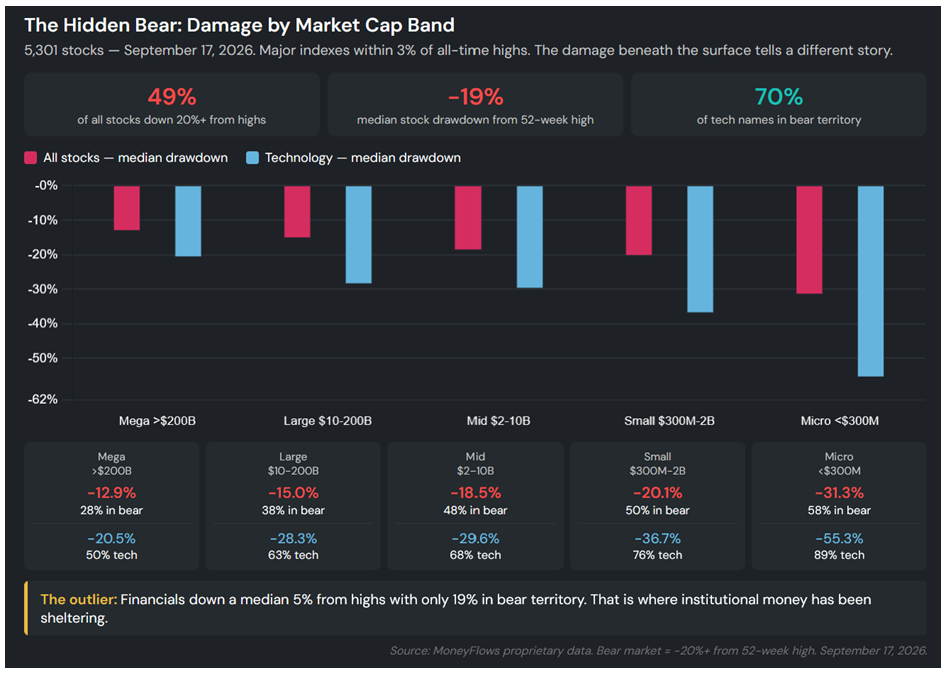
Our “cones” see indications of a stealth bear market threat, as 49% of the publicly traded companies in my universe are down 20% or more from their 52-week highs. That is a bear market (for those stocks), by definition. Thursday’s relief rally barely moved the needle, shaving the number by roughly one and a half percentage points. A quiet bear is coming awake, but you need night vision to see it. The average stock is 19% off its high. A cap-weighted index is up nearly 20%, year-to-date, but the median stock is up just 5%.
The damage resembles a staircase (charted below). Bigger companies have fallen less. Smaller companies are hit harder. Mega-caps are down a median 13% from their highs, with 28% in bear market territory. Large-caps are down 15%, with 38% down 20% or more. Mid-caps are down 18%, with near half in bear markets. Small-caps are down 20%, half below the threshold. Micro-caps are down 31%, with 58% in bear territory. Technology is worse: 70% of technology names are in bear markets, with the median technology stock -34%.
Graphs are for illustrative and discussion purposes only. Please read important disclosures at the end of this commentary.
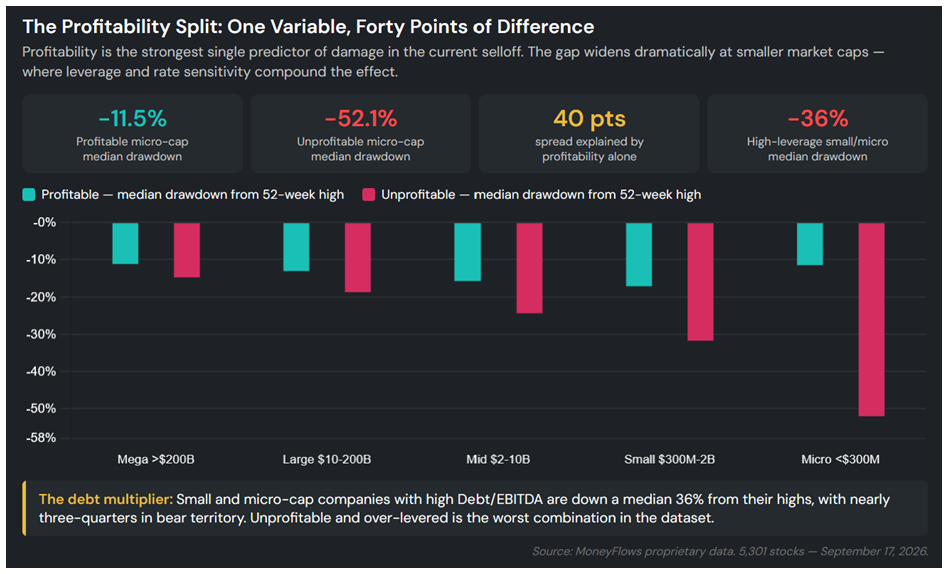
Two fundamentals indicate some market damage ahead. Profitability matters most: profitable micro-caps are down by an average 11% from their highs, while unprofitable micro-caps are down 52%, a 40-point spread driven mostly by whether the business makes money. Debt compounds the loss: Small and micro-cap companies with high leverage are down a median 36%, with nearly three-quarters in bear territory.
Graphs are for illustrative and discussion purposes only. Please read important disclosures at the end of this commentary.
Financials are down less, by a median 5%, with only 19% in bear market territory. Financials, energy, and healthcare are where institutional money has been hiding. Most other sectors have been quietly suffering.
September’s Internal Market Moves
Since August 31st, eight of 14-sessions produced 100+ outflows, the biggest cluster of extreme selling since the March capitulation. In March, a similar bout ran 12-sessions before the March 20 low, which produced 337 outflows and marked the exact bottom. But…the S&P 500 was 9% higher one-month later.
The Big Money Index (BMI) differs somewhat from the decline before March 20th. Then, the BMI fell from 65% to 42%. Now, it has dropped less, from 69% to 51%. That’s still painful, but above the typical bear-market threshold. This might be why the major indexes haven’t cracked yet.
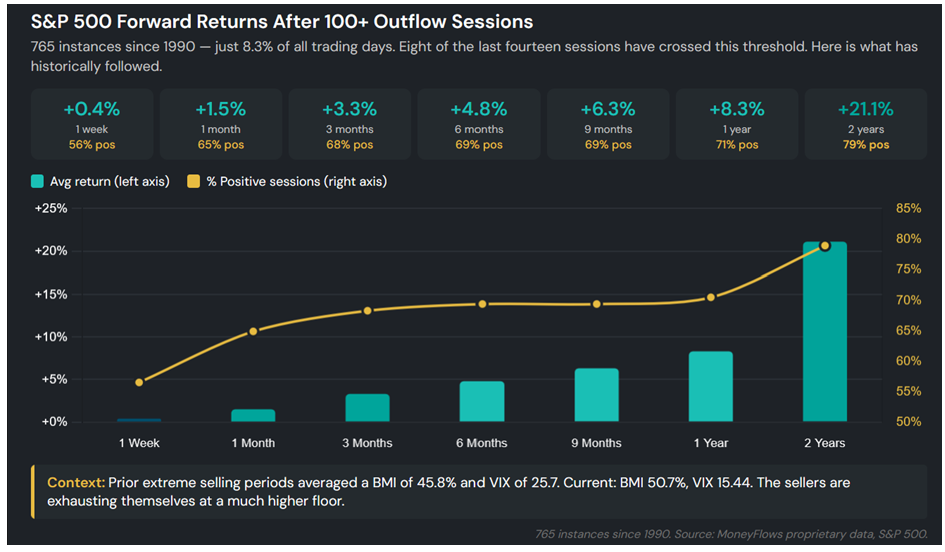
Since 1990, there were 765-sessions with 100 or more institutional outflows. That’s just once each 12-days, or 8.3% of all trading days in 36-years. Forward returns are positive at every horizon: one-week later, one-month, three-months, six-months, one-year and two-years. The two-year average return is 21%.
This historical record says any pain has usually been temporary; and recovery has usually followed.
Graphs are for illustrative and discussion purposes only. Please read important disclosures at the end of this commentary.
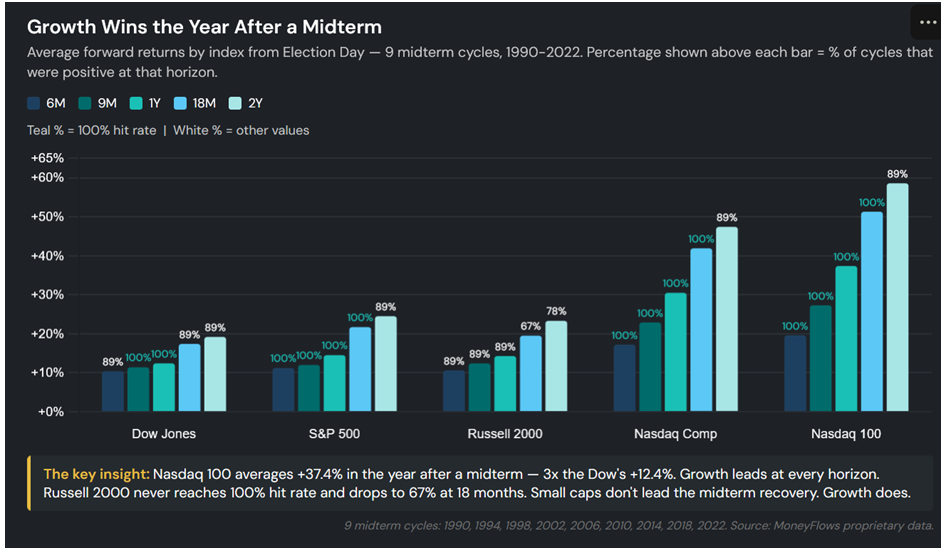
History also shows what index (and sector) comes back the fastest. Across nine midterm election cycles since 1990, the NASDAQ 100 averaged +37.4% in the year following Election Day – more than double the Dow’s 12.4% and well ahead of the S&P 500’s 14.5%. Growth leads the recovery. Every time.
The stocks most beaten up today are rate-sensitive, but fundamentally sound stocks provide the profile that has snapped back the hardest when midterm uncertainty clears. Growth leads. It is not even close.
Graphs are for illustrative and discussion purposes only. Please read important disclosures at the end of this commentary.
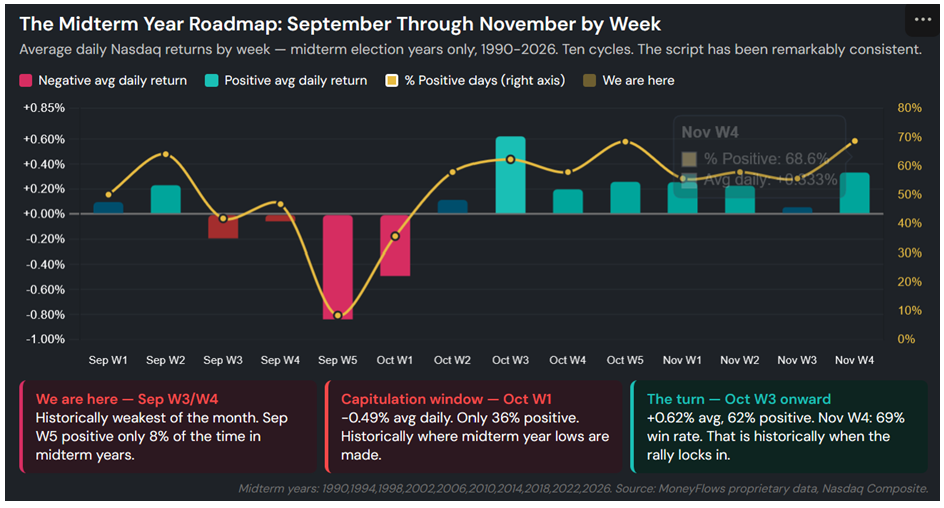
Our 36-years of daily data show which weeks carry most weight in midterm years. Late September (weeks #3 and #4) are the weakest, with negative average daily returns, with less than 47% of days positive. We are in that bottom-fishing window right now. Then, things could get worse, short-term:
October’s first week is historically the worst week of October, with a negative 0.49% average, positive only 36% of the time. That is typically when midterm year lows are made, but October’s third-week is the strongest, with a +0.62% average move. The turn happens fast. November in midterm years has been positive across all four-weeks, with week #4 averaging a 69% win rate. That is when the rally locks in.
Graphs are for illustrative and discussion purposes only. Please read important disclosures at the end of this commentary.
The prediction markets now price the chances of a Democratic Senate at 60% on Polymarket and 55% on Kalshi. This is the first time Democrats have led the polls on either platform. A year ago, Republicans had an 80% chance to hold the Senate. (Take these numbers with a grain of salt. Polymarket gave the next Pope a 0.3% probability just before he was announced – so a 60% reading seven-weeks from Election Day is a forecast, not a verdict). What matters for markets is not who wins, but that nobody knows yet. Uncertainty is what Wall Street prices (and hates). Resolution is what historically unlocks the Q4 rally.
Major Money Flows Last Week
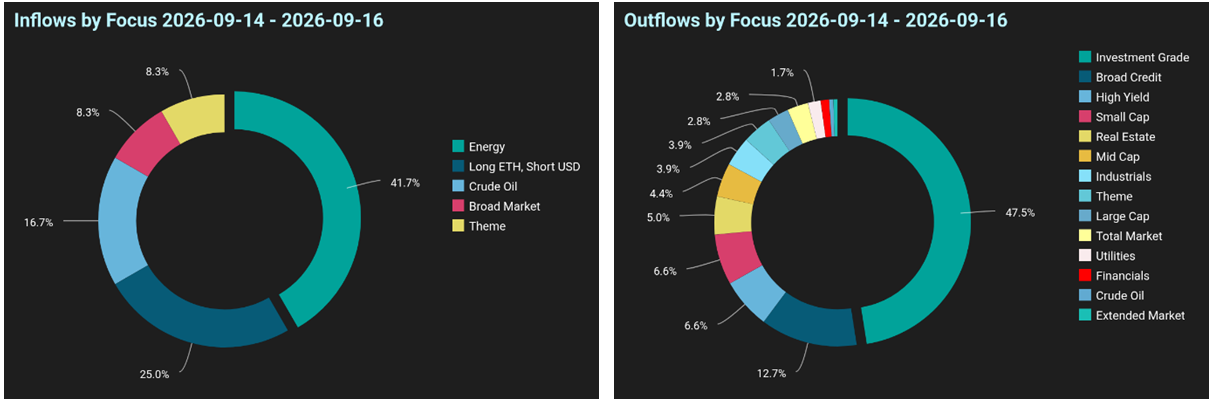
Energy was the only positive S&P sector last week, its second-straight week as the sole net buyer. Eight of 14 sessions since August 31 had 100-plus outflows. Sellers are everywhere, but they are getting tired.
Over 120-fixed income ETFs saw outflows, and 60+ equity ETFs were sold. Only energy, cybersecurity, crypto, and mega-cap technology attracted buyers last week. The market is not rotating. It is sheltering.
Graphs are for illustrative and discussion purposes only. Please read important disclosures at the end of this commentary.
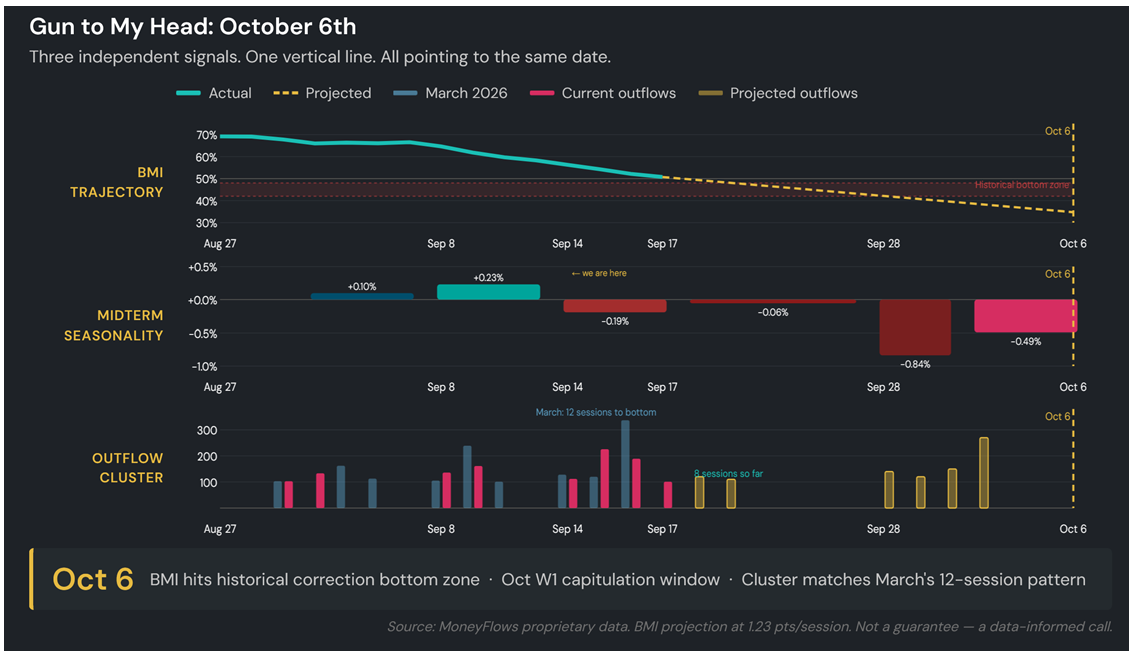
When will the market bottom before the election? I’ll forecast October 6th, when three independent signals converge: (1) The BMI is dropping roughly 1.5 points per session. At that pace it hits the 42-48% range, where prior mid-bull corrections have bottomed (including March 20th) in the first week of October; (2) 36-years of seasonality says October Week 1 is the worst week of a midterm year, and (3) the current cluster of 100+ outflow days is now at eight sessions. The March cluster ran 12 before the bottom.
All three indicators point to the same window. October 6th is a Tuesday. The market opens. Sellers have all sold. The historical data hints that two-weeks from today is where this mini-correction ends.
Graphs are for illustrative and discussion purposes only. Please read important disclosures at the end of this commentary.
Sorry, wife (October 6 is our anniversary), but this is our Purkinje moment. Our eyes are adjusting in the dark, but that condition is temporary. When light normalizes, normal vision returns and colors come back.
The hidden bear is real. The breadth damage is real. The oil shock, rate pressure and political uncertainty are real. We’re in the historically most volatile stretch of the four-year presidential cycle, but history says early October is the capitulation window. Week #3 is where it flips. November is when we make money.
“We cannot choose our external circumstances, but we can always choose how we respond to them.”
– Epictetus
Examining the data is our rational response now. The data knows where this market goes next.
All content above represents the opinion of Jason Bodner of Navellier & Associates, Inc.
Also In This Issue
A Look Ahead by Louis Navellier
Is Canada Splitting Up – or Joining the European Union?
Income Mail by Bryan Perry
What’s Working and What’s Not in the Current Market Landscape
Growth Mail by Gary Alexander
Fed Chair Warsh Delivers a Fresh, Clear Perspective
Global Mail by Ivan Martchev
Most Markets Expect More Rate Hikes
Sector Spotlight by Jason Bodner
When Lights are Low, Our Vision Must Adjust
View Full Archive
Read Past Issues Here
Important Disclosures:
Although information in these reports has been obtained from and is based upon sources that Navellier believes to be reliable, Navellier does not guarantee its accuracy and it may be incomplete or condensed. All opinions and estimates constitute the authors opinions as of the date the report was created and are subject to change without notice. These reports are for informational purposes only and are not a solicitation for the purchase or sale of any securities or financial services. Any decision to purchase securities mentioned in these reports must take into account existing public information on such securities or any registered prospectus. To the extent permitted by law, neither Navellier & Associates, Inc., nor any of its affiliates, agents, or service providers are providing any investment advice herein and do not assume any liability or responsibility for the readers’ decisions if any. No reader should act or refrain from acting in reliance on the information contained in this communication or for any decision based on it.
None of the stock information, data, or company information presented herein constitutes investment advice or a recommendation by Navellier or a solicitation to buy or sell any securities. Any specific securities identified and described herein do not represent any investment advice.
Information presented is general information that does not take into account your individual circumstances, financial situation, or needs, nor does it present a personalized recommendation to you. Individual stocks presented may not be suitable for every investor. Investment in securities involves significant risk and has the potential for partial or complete loss of funds invested. Investment in fixed income securities has the potential for the investment return and principal value of an investment to fluctuate so that an investor’s holdings, when redeemed, may be worth less than their original cost.
- This report contains statements that are, or may be considered to be, forward-looking statements. All statements that are not historical facts, including statements about our beliefs or expectations, are “forward-looking statements” within the meaning of The U.S. Private Securities Litigation Reform Act of 1995. These statements may be identified by such forward-looking terminology as “expect,” “estimate,” “plan,” “intend,” “believe,” “anticipate,” “may,” “will,” “should,” “could,” “continue,” “project,” or similar statements or variations of such terms. Our forward-looking statements are based on a series of expectations, assumptions, and projections, are not investment advice. All of our forward-looking statements are as of the date of this report only.
- Federal Tax Advice Disclaimer: As required by U.S. Treasury Regulations, you are informed that, to the extent this presentation mentions any federal taxes, Navellier is not presenting any tax advice and should not be used or relied on as tax advice. Navellier does not advise on any income tax requirements or issues. Use of any information presented by Navellier is for general information only and does not represent tax advice either express or implied. You are encouraged to seek professional tax advice for income tax questions and assistance.
- FactSet Disclosure: Navellier does not independently calculate the statistical information included in the attached report. The calculation and the information are provided by FactSet, a company not related to Navellier. Although information contained in the report has been obtained from FactSet and is based on sources Navellier believes to be reliable, Navellier does not guarantee its accuracy, and it may be inaccurate, incomplete or condensed. The report and the related FactSet sourced information is for general information purposes only.
- Mapsignals Disclosure: Jason Bodner is a co-founder and co-owner of Mapsignals.com, a Developed Factor Model for isolating outlier stocks using its proprietary quantitative equity selection methodology. Mapsignals was founded in 2014. Data used by Mapsignals, for periods prior to its founding in 2014, is data derived from Factset. Mr. Bodner is an independent contractor who is occasionally hired to write articles and provide his editorial comments and opinions. Mr. Bodner is not employed by Navellier & Associates, Inc., or any other Navellier owned entity. The opinions and statements made in this article are those of Mr. Bodner and not necessarily those of any other persons or entities. Jason Bodner is a co-founder and co-owner of Mapsignals. Mr. Bodner is an independent contractor who is occasionally hired by Navellier & Associates to write an article and or provide opinions for possible use in articles that appear in Navellier & Associates weekly Market Mail. Mr. Bodner is not employed or affiliated with Louis Navellier, Navellier & Associates, Inc., or any other Navellier owned entity. The opinions and statements made here are those of Mr. Bodner and not necessarily those of any other persons or entities. This is not an endorsement, or solicitation or testimonial or investment advice regarding the BMI Index or any statements or recommendations or analysis in the article or the BMI Index or Mapsignals or its products or strategies.