
by Bryan Perry
September 22, 2026
A common question making the rounds these days is examining what market sectors are most likely to hold value and gain in the current market landscape of rising bond yields, a tighter Fed monetary policy, the ongoing war with Iran, soaring federal debt, rising oil prices, an AI backlash, and midterm elections!
While this set of conditions might, at first glance, seem like a toxic formula, let’s also include record sales and earnings for the S&P 500, giving investors a good reason to maintain a high level of confidence in how the market will trade during the fourth-quarter of 2026. Also, the AI boom is still booming, which translates into incredible gains in productivity – which are driving the current digital industrial revolution.
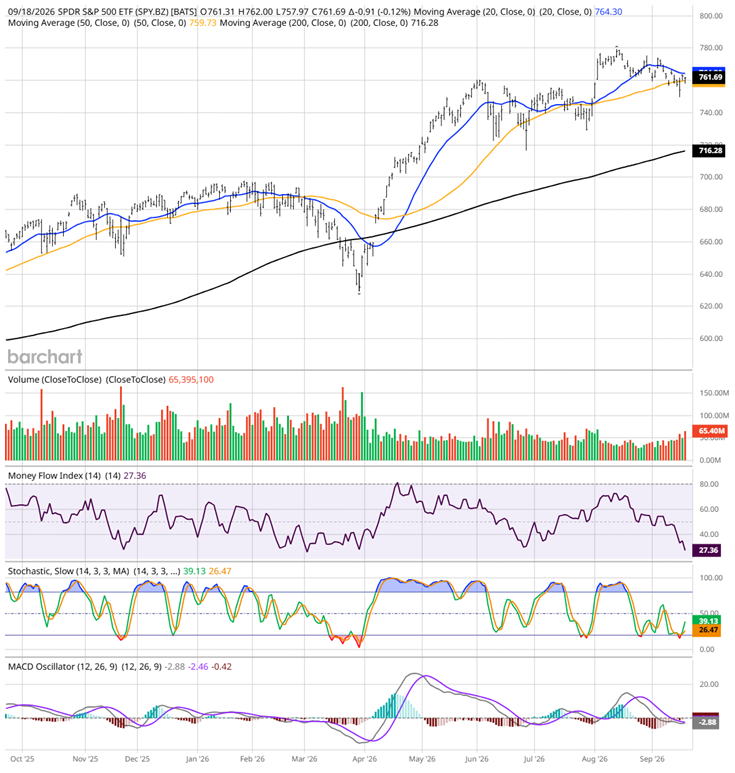
Graphs are for illustrative and discussion purposes only. Please read important disclosures at the end of this commentary.
Record sales and earnings serve as the ultimate engine for stock prices over the long run, but macro conditions (such as yields, oil prices and fiscal policy) constantly wage a tug-of-war on P/E ratios. Macro conditions act as multipliers (or contractors) on earnings, determining how much investors are willing to pay for each dollar of corporate profit, and which sectors stand to keep those profits moving up.
In a macro environment characterized by rising yields, oil supply shocks, election uncertainty and a need for massive Treasury debt, capital typically rotates out of high-valuation growth assets into defensive, cash-flow-rich inflation-hedged sectors. This may explain why we’ve seen constant downward pressure on P/E ratios of companies with soaring sales but tepid profit growth, with many in the technology sector.
Coming to the end of Q3 and moving into Q4 next week, there are some standout pockets of strength within larger market sectors displaying strong relative strength and bullish fund flows, most of which address and benefit from uncertainty. Instead of fighting the tape, which happens when investors are complacent about their holdings, it pays to be proactive and lean into areas where tailwinds are stiff.
Take the war in Iran; integrated oil, exploration and production, pure-play refiners and shipping stocks are the leading sub-sectors of the energy sector, and for good reason. The ongoing conflict creates significant uncertainty across global markets. When multi-front geopolitical conflicts drag on, markets adjust by shifting focus from short-term panic to long-term structural supply-chain realignments.
Benchmark assessments from the Baltic Exchange confirm Very Large Crude Carrier (VLCC) spot rates on key routes from the Arabian Gulf to Asia have surged past $1.03 million to $1.2 million+ per day. To put this in perspective, typical pre-war baseline daily VLCC rates were between $25,000 and $45,000.
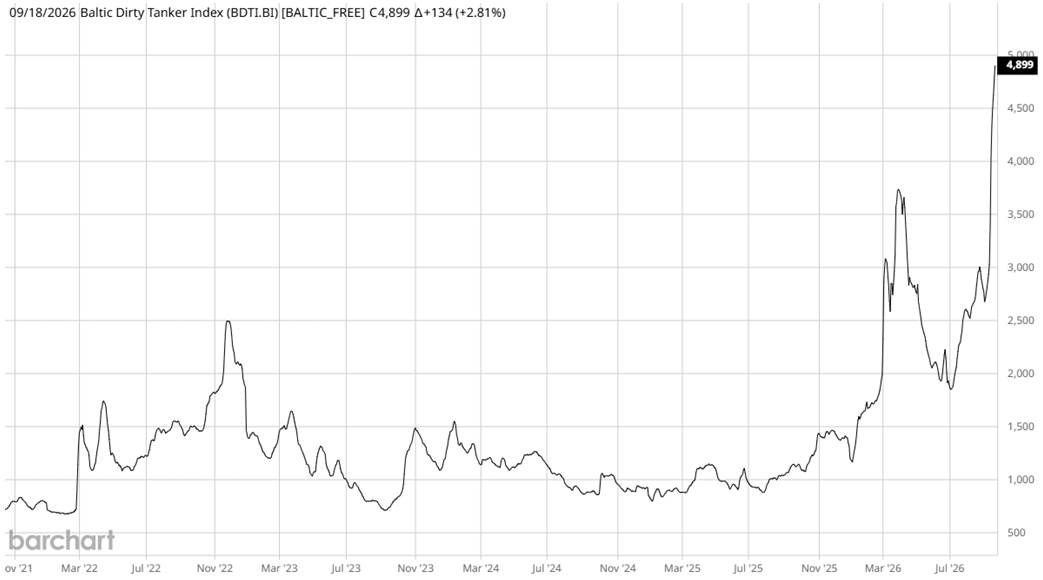
Graphs are for illustrative and discussion purposes only. Please read important disclosures at the end of this commentary.
Rather than waiting for a definitive resolution, institutional capital generally reallocates toward tangible real assets, where supply disruptions are acute. Agriculture, industrial metals, and broad commodity baskets act as natural shock absorbers against geopolitically driven inflation the Fed cannot control.
In a protracted war scenario, high borrowing costs and elevated expenses compress profit margins for weaker firms. As such, institutional investors focus heavily on balance sheet quality. Companies with substantial cash flow rely less on debt, protecting them from high refinancing rates caused by heavy Treasury issuance. Hence, the recent rotation back into the Magnificent Seven to previous all-time highs.
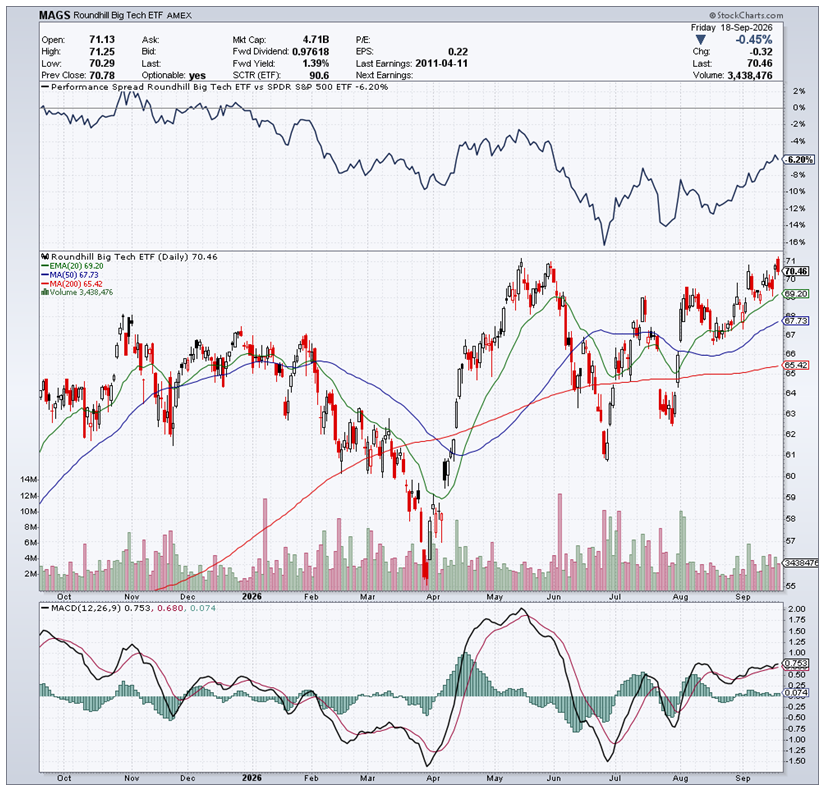
Graphs are for illustrative and discussion purposes only. Please read important disclosures at the end of this commentary.
The threat of AI getting into the wrong hands and creating havoc in information systems has put a bid under cybersecurity stocks. Whereas multiple former Wall Street-darling software stocks were crushed to multi-year lows, shares of leading cybersecurity companies are moving higher in a more dangerous world.
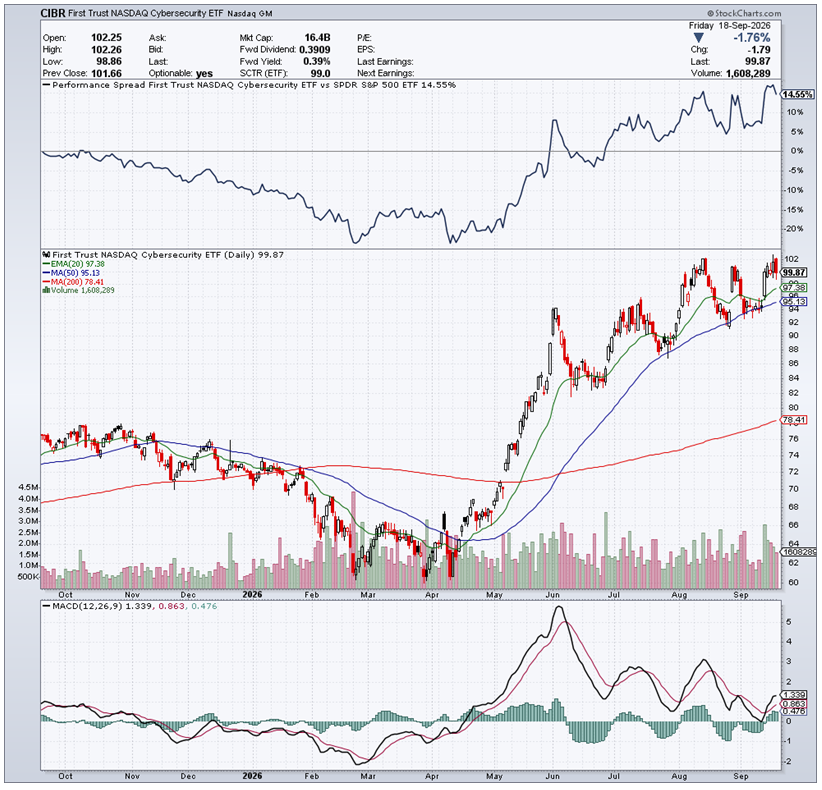
Graphs are for illustrative and discussion purposes only. Please read important disclosures at the end of this commentary.
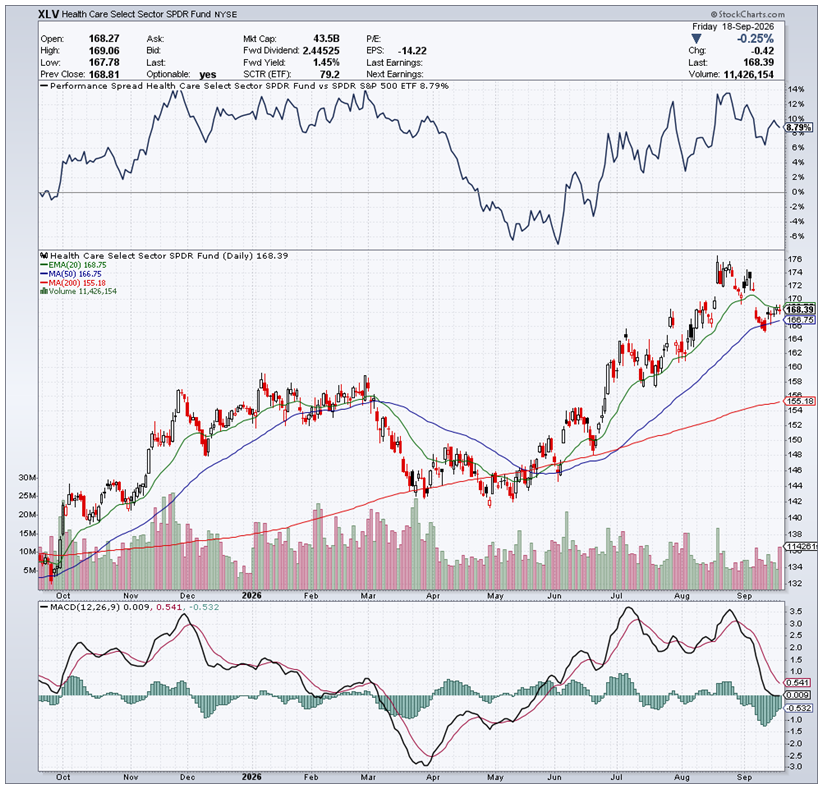
Lastly, the bunker mentality is leading money into healthcare, where big pharma, biopharma, pharmacy benefits and insurance companies are trading at all-time highs even as populist-socialist movements target this sector. But for now, without a clear-cut blueprint of how healthcare should be done at a national level, the biggest and best names that provide therapies, treatments, and services are in rally mode.
Graphs are for illustrative and discussion purposes only. Please read important disclosures at the end of this commentary.
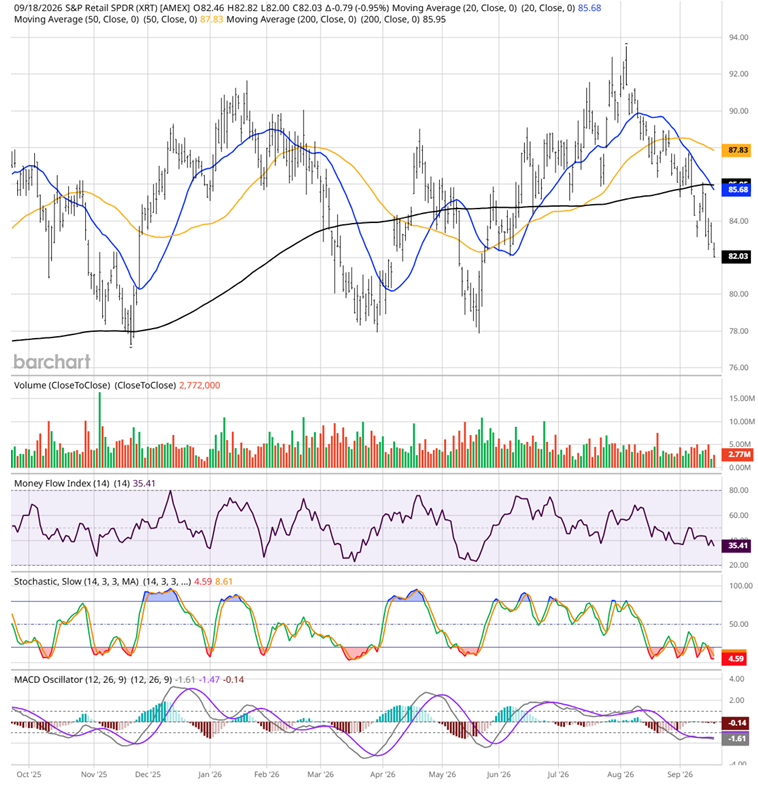
What is not working is glaring. Luxury retail stocks are getting hammered, as are most broadline retail stocks, home improvement, home furnishing, automotive retail, and sporting goods. The divergence between strong headline macroeconomic data, such as August top-line retail sales surging 1.2% according to the U.S. Census Bureau and falling equity prices across retail stocks, is a classic market disconnect.
Official headline retail sales measure nominal spending, actual dollars spent, not volume in units sold. A significant portion of August’s jump was driven by a 3.1% surge in gas station receipts caused by rising crude prices and supply disruptions. When consumers spend $100 more at the pump to buy the exact same gallons of gas, headline retail sales go up, but consumer discretionary purchasing power suffers.
According to KPMG senior economists, part of August’s strength came from consumers buying auto parts, electronics, and goods up-front to get ahead of impending tariff increases and Middle East-driven energy price hikes.This pulls future sales forward rather than indicating sustainable consumer health.
Headline retail sales reflect what consumers spent last month, largely inflated by energy costs. Retail stock prices reflect what Wall Street expects retailers to profit next year. When sticky inflation and rising bond yields threaten future profit margins, stock prices fall even while headline sales reach record levels.
Graphs are for illustrative and discussion purposes only. Please read important disclosures at the end of this commentary.
There are other notable winning and losing sectors I could list, but these areas stand out the most, given the backdrop of all that is happening and which seems to matter most to market professionals.
All content above represents the opinion of Bryan Perry of Navellier & Associates, Inc.
Also In This Issue
A Look Ahead by Louis Navellier
Is Canada Splitting Up – or Joining the European Union?
Income Mail by Bryan Perry
What’s Working and What’s Not in the Current Market Landscape
Growth Mail by Gary Alexander
Fed Chair Warsh Delivers a Fresh, Clear Perspective
Global Mail by Ivan Martchev
Most Markets Expect More Rate Hikes
Sector Spotlight by Jason Bodner
When Lights are Low, Our Vision Must Adjust
View Full Archive
Read Past Issues Here
Important Disclosures:
Although information in these reports has been obtained from and is based upon sources that Navellier believes to be reliable, Navellier does not guarantee its accuracy and it may be incomplete or condensed. All opinions and estimates constitute the authors opinions as of the date the report was created and are subject to change without notice. These reports are for informational purposes only and are not a solicitation for the purchase or sale of any securities or financial services. Any decision to purchase securities mentioned in these reports must take into account existing public information on such securities or any registered prospectus. To the extent permitted by law, neither Navellier & Associates, Inc., nor any of its affiliates, agents, or service providers are providing any investment advice herein and do not assume any liability or responsibility for the readers’ decisions if any. No reader should act or refrain from acting in reliance on the information contained in this communication or for any decision based on it.
None of the stock information, data, or company information presented herein constitutes investment advice or a recommendation by Navellier or a solicitation to buy or sell any securities. Any specific securities identified and described herein do not represent any investment advice.
Information presented is general information that does not take into account your individual circumstances, financial situation, or needs, nor does it present a personalized recommendation to you. Individual stocks presented may not be suitable for every investor. Investment in securities involves significant risk and has the potential for partial or complete loss of funds invested. Investment in fixed income securities has the potential for the investment return and principal value of an investment to fluctuate so that an investor’s holdings, when redeemed, may be worth less than their original cost.
- This report contains statements that are, or may be considered to be, forward-looking statements. All statements that are not historical facts, including statements about our beliefs or expectations, are “forward-looking statements” within the meaning of The U.S. Private Securities Litigation Reform Act of 1995. These statements may be identified by such forward-looking terminology as “expect,” “estimate,” “plan,” “intend,” “believe,” “anticipate,” “may,” “will,” “should,” “could,” “continue,” “project,” or similar statements or variations of such terms. Our forward-looking statements are based on a series of expectations, assumptions, and projections, are not investment advice. All of our forward-looking statements are as of the date of this report only.
- Federal Tax Advice Disclaimer: As required by U.S. Treasury Regulations, you are informed that, to the extent this presentation mentions any federal taxes, Navellier is not presenting any tax advice and should not be used or relied on as tax advice. Navellier does not advise on any income tax requirements or issues. Use of any information presented by Navellier is for general information only and does not represent tax advice either express or implied. You are encouraged to seek professional tax advice for income tax questions and assistance.
- FactSet Disclosure: Navellier does not independently calculate the statistical information included in the attached report. The calculation and the information are provided by FactSet, a company not related to Navellier. Although information contained in the report has been obtained from FactSet and is based on sources Navellier believes to be reliable, Navellier does not guarantee its accuracy, and it may be inaccurate, incomplete or condensed. The report and the related FactSet sourced information is for general information purposes only.