
by Ivan Martchev
September 22, 2026
Be they stocks, bonds or commodities, the financial markets apparently want more of Kevin Warsh.
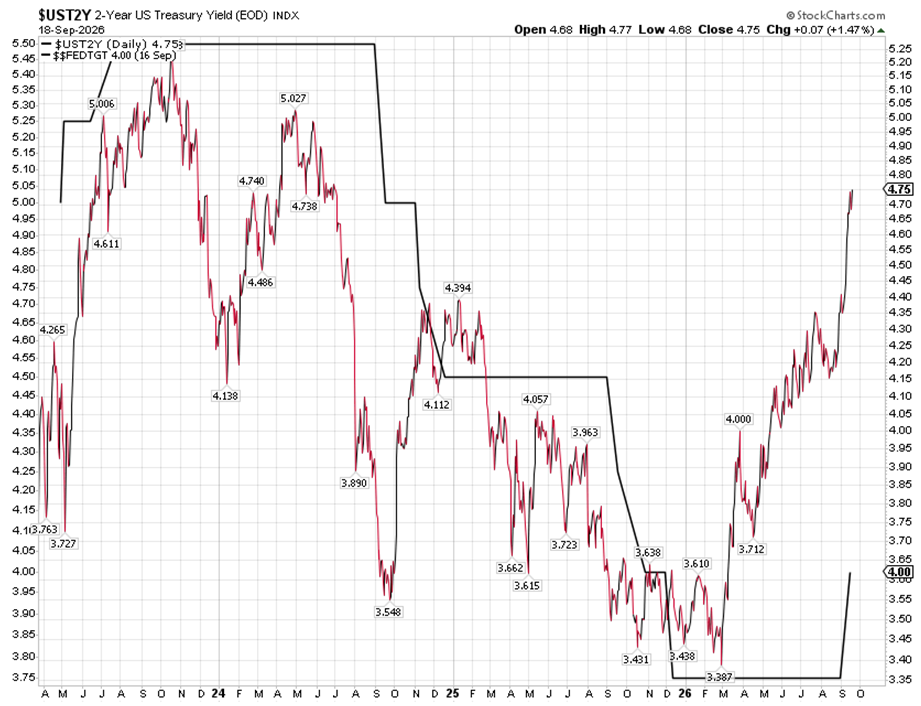
The legendary 2-year Treasury note – where investors tend to estimate what the Fed is likely to do – ended last week near 4.75%, not registering any drop in yield despite a 25 bp rate hike last Wednesday, and 4.75% is precisely three 25 bp rate hikes above the upper end of the Fed funds target range of 4%.
Graphs are for illustrative and discussion purposes only. Please read important disclosures at the end of this commentary.
As things stand now, I don’t think the Fed will hike interest rates three more times, as the end of the war would alleviate a lot of the reasons for the Fed rate hikes, but I do think the Fed will hike rates at least one more time in 2026, and that begs the question: Will that happen in October or December? My answer: Treasury yields permitting, it should be in December, because of the November elections one-week after the late-October meeting. Then, the main question is, Will Treasury yields stay contained or march higher?
I find it refreshing, and rather telling, that all three of the Warsh-era FOMC statements were just half the length of the Powell-era Fed, and all three ended with, “The Committee will drive price stability.” The two statements before last week were nearly identical in wording. Needless to say, this wording is deliberate, and it seeks to enforce the notion that Warsh won’t be a Trump pawn but his own independent Fed leader.
Due mostly to the war in Iran, diesel prices are at all-time highs, globally. In addition, EU natural gas is at 10-times the U.S. price because of problematic Strait of Hormuz LNG flows. Other industrial commodity prices depend on issues in either Hormuz or Bab-el-Mandeb, but if the war were to end tomorrow, which does not seem likely as of the time of this writing, a lot will change for the global inflation outlook.
I am monitoring the Bab el Mandeb Red Sea chokepoint, as over the past week it has delivered bad news. One positive report described how Saudi Arabia reached out to China to get their assistance on reining in the Houthis in Yemen, who have not stopped advancing and continued bombing all the way to Riyadh.
For the Houthis to stop there, we need to see some sort of closure on the Iran war, like resumed peace talks, as they are a major point of leverage previously not appreciated by the Trump administration.
Graphs are for illustrative and discussion purposes only. Please read important disclosures at the end of this commentary.
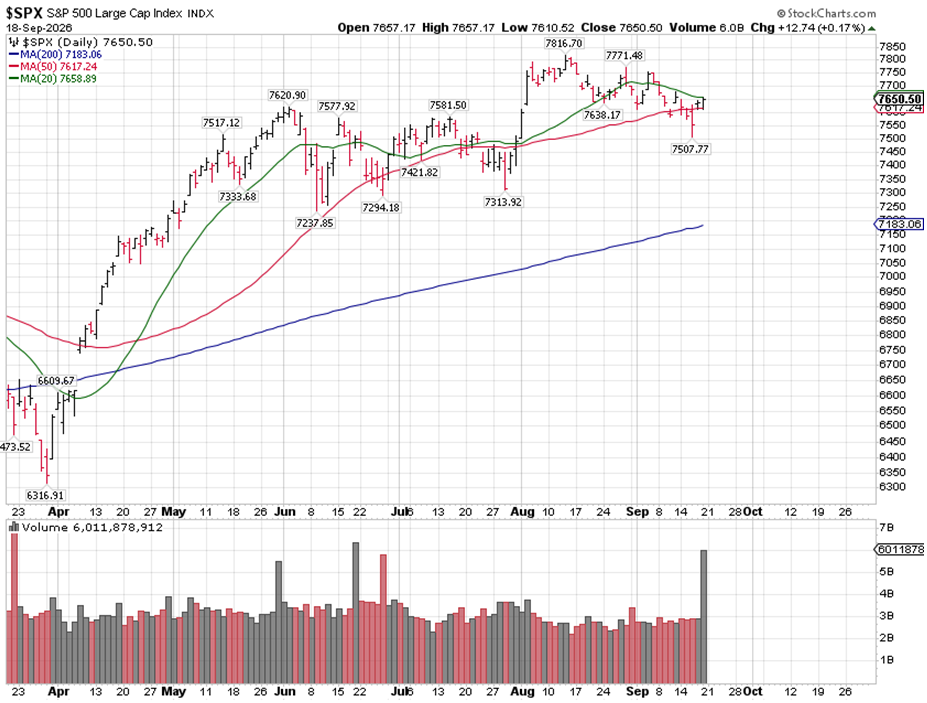
In this geopolitical mess, the stock market has done well, considering the gravity of the situation. When oil was $67, if you had asked me where the stock market would be if oil got back to $100 and the 10-year Treasury yield got to 5%, I don’t think I would have guessed S&P 7,650. I would have said 7,000, if that.
The reason for this resilience is extraordinarily high earnings growth, where rising Treasury yields cause the forward P/E ratio to shrink below 19 while the S&P EPS is up over 25% for the year. It does not take a genius to expect the market to explode higher if the war ends, as a major restraint would be alleviated.
Based on recent trends, my working assumption is the war won’t end before the November elections, which leaves the possibility of a much higher oil price and higher Treasury yields. The situation in Iran does not have to get worse when the Houthis can do so much damage in Saudi Arabia that a spike in the oil price may come anyway. The oil price may stay elevated if the damage cannot be swiftly repaired. All those are “unknowables,” where positive developments can create big moves higher – and vice versa.
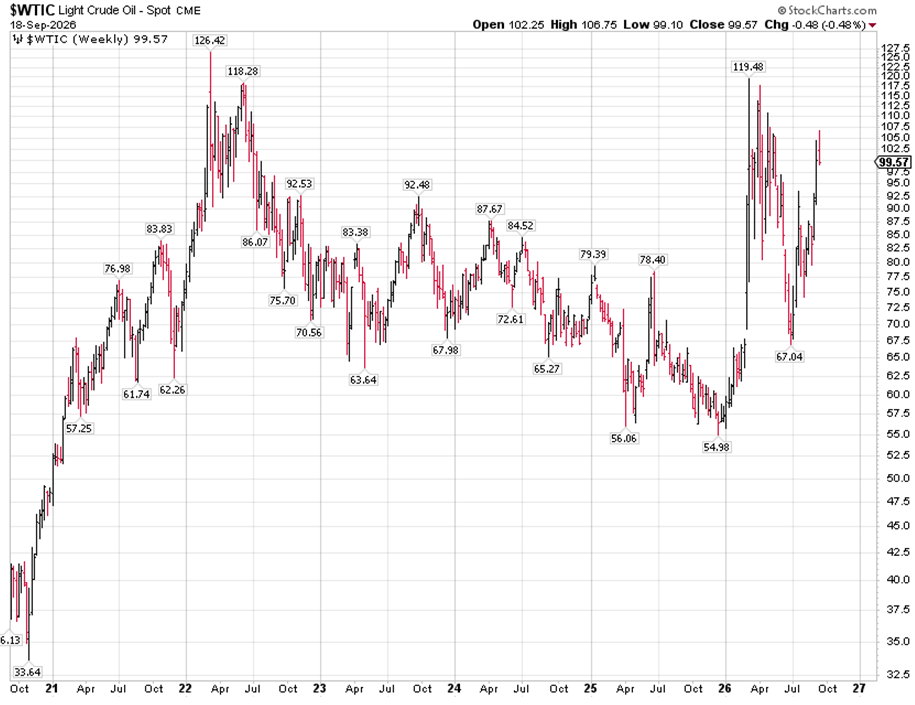
I think the chance the price of oil gets to $120 or higher on the WTI futures contract making a fresh high above the March high is better than 50% based on the deteriorating recent trends on the battlefield. The Ukrainians over the weekend launched their largest ever attack on Moscow, so it is fair to say that both wars in the world at present are moving in the wrong direction. How is crude oil going to decline in this environment with depleted buffer inventories despite the negative seasonality?
Graphs are for illustrative and discussion purposes only. Please read important disclosures at the end of this commentary.
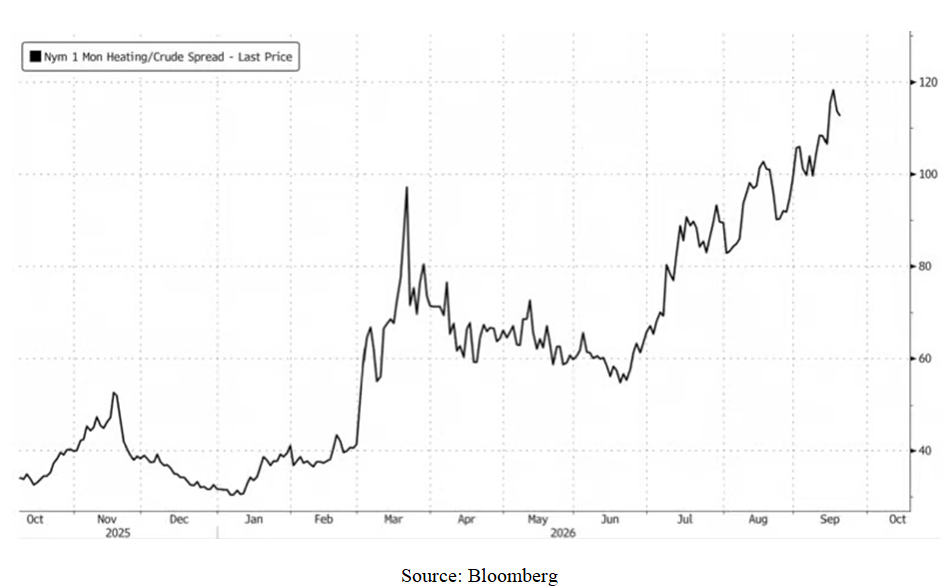
Keep in mind WTI crude oil futures price on their own can be highly misleading. The global diesel shortage is demonstrated better by the heating oil crack spread – a measure of the refining margin from a barrel of crude oil. That heating oil crack spread reached an all-time high of $117 a barrel last week.
Graphs are for illustrative and discussion purposes only. Please read important disclosures at the end of this commentary.
The crack spread took out its March high in August and is right now headed higher. While it would be overly simplistic to equate the two, that refining margin for heating oil, diesel and users of other similar distillates is like crude oil trading at $217 per barrel (crack spread plus the crude oil price).
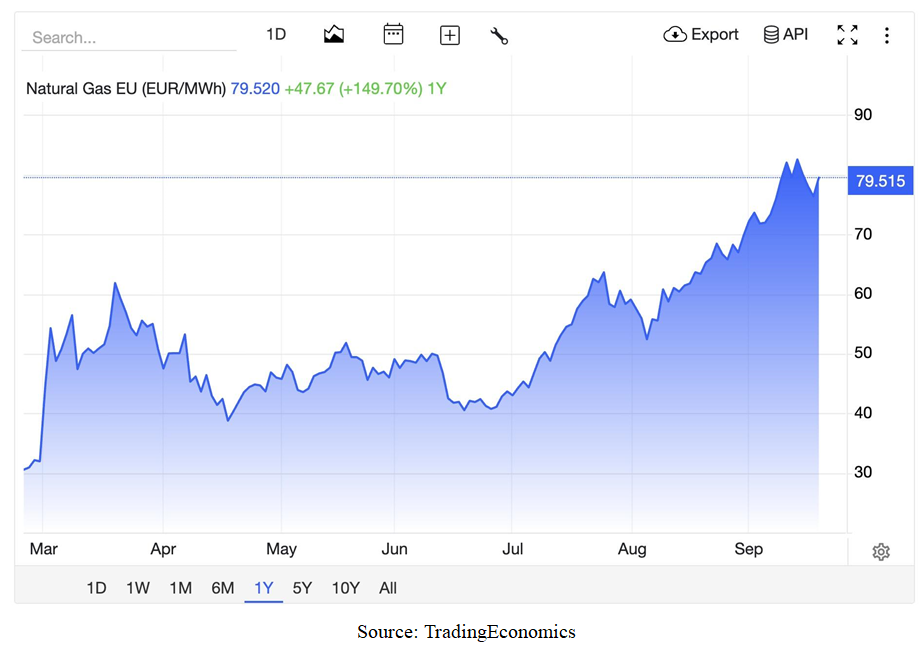
Graphs are for illustrative and discussion purposes only. Please read important disclosures at the end of this commentary.
A surge toward the 200-day moving average in the S&P 500, which stands at 7,183, cannot be ruled out if oil keeps advancing and crack spreads keep blowing out. Many energy commodities are in backwardation – where front-month futures are quite a bit more expensive compared to months further out, as investors keep hoping the shortages now will not be as bad a month or two from now (if the war were to end).
Those tiny dips in crude oil or EU natural gas are actually futures rolling over from September to October for front-month trading, reflecting that backwardation, but as far as I can tell very little has happened to improve the situation in energy markets. Since EU natural gas inventories are about 18% below the 5-year average (and 12% below last year’s levels) with both war situations deteriorating, it is premature to assume we have already seen the highs in crack spreads or EU natural gas.
All content above represents the opinion of Ivan Martchev of Navellier & Associates, Inc.
Also In This Issue
A Look Ahead by Louis Navellier
Is Canada Splitting Up – or Joining the European Union?
Income Mail by Bryan Perry
What’s Working and What’s Not in the Current Market Landscape
Growth Mail by Gary Alexander
Fed Chair Warsh Delivers a Fresh, Clear Perspective
Global Mail by Ivan Martchev
Most Markets Expect More Rate Hikes
Sector Spotlight by Jason Bodner
When Lights are Low, Our Vision Must Adjust
View Full Archive
Read Past Issues Here
Important Disclosures:
Although information in these reports has been obtained from and is based upon sources that Navellier believes to be reliable, Navellier does not guarantee its accuracy and it may be incomplete or condensed. All opinions and estimates constitute the authors opinions as of the date the report was created and are subject to change without notice. These reports are for informational purposes only and are not a solicitation for the purchase or sale of any securities or financial services. Any decision to purchase securities mentioned in these reports must take into account existing public information on such securities or any registered prospectus. To the extent permitted by law, neither Navellier & Associates, Inc., nor any of its affiliates, agents, or service providers are providing any investment advice herein and do not assume any liability or responsibility for the readers’ decisions if any. No reader should act or refrain from acting in reliance on the information contained in this communication or for any decision based on it.
None of the stock information, data, or company information presented herein constitutes investment advice or a recommendation by Navellier or a solicitation to buy or sell any securities. Any specific securities identified and described herein do not represent any investment advice.
Information presented is general information that does not take into account your individual circumstances, financial situation, or needs, nor does it present a personalized recommendation to you. Individual stocks presented may not be suitable for every investor. Investment in securities involves significant risk and has the potential for partial or complete loss of funds invested. Investment in fixed income securities has the potential for the investment return and principal value of an investment to fluctuate so that an investor’s holdings, when redeemed, may be worth less than their original cost.
- This report contains statements that are, or may be considered to be, forward-looking statements. All statements that are not historical facts, including statements about our beliefs or expectations, are “forward-looking statements” within the meaning of The U.S. Private Securities Litigation Reform Act of 1995. These statements may be identified by such forward-looking terminology as “expect,” “estimate,” “plan,” “intend,” “believe,” “anticipate,” “may,” “will,” “should,” “could,” “continue,” “project,” or similar statements or variations of such terms. Our forward-looking statements are based on a series of expectations, assumptions, and projections, are not investment advice. All of our forward-looking statements are as of the date of this report only.
- Federal Tax Advice Disclaimer: As required by U.S. Treasury Regulations, you are informed that, to the extent this presentation mentions any federal taxes, Navellier is not presenting any tax advice and should not be used or relied on as tax advice. Navellier does not advise on any income tax requirements or issues. Use of any information presented by Navellier is for general information only and does not represent tax advice either express or implied. You are encouraged to seek professional tax advice for income tax questions and assistance.
- FactSet Disclosure: Navellier does not independently calculate the statistical information included in the attached report. The calculation and the information are provided by FactSet, a company not related to Navellier. Although information contained in the report has been obtained from FactSet and is based on sources Navellier believes to be reliable, Navellier does not guarantee its accuracy, and it may be inaccurate, incomplete or condensed. The report and the related FactSet sourced information is for general information purposes only.