
by Gary Alexander
September 15, 2026
“In every age … progressive improvement has been taking place, [but] nobody seems to reckon on any improvement in the next generation. We cannot absolutely prove that those are in error who say society has reached a turning point – that we have seen our best days. But so said all who came before us … On what principle is it that with nothing but improvement behind us, we are to expect nothing but deterioration before us?” — Thomas Babington Macaulay, writing in the Edinburgh Review (1830).
Every month, toward the end of the month, the Conference Board releases its “confidence index,” which is combination between confidence in the “Present Situation” and on “Future Expectations.”
Our response to that poll reflects a split personality. For some odd reason, the majority feel pretty good about the present, but we then turn dismal – like that Macaulay quote, above – in “Expecting nothing but deterioration before us.” This must be a factor of human psychology more than economics, or logic.
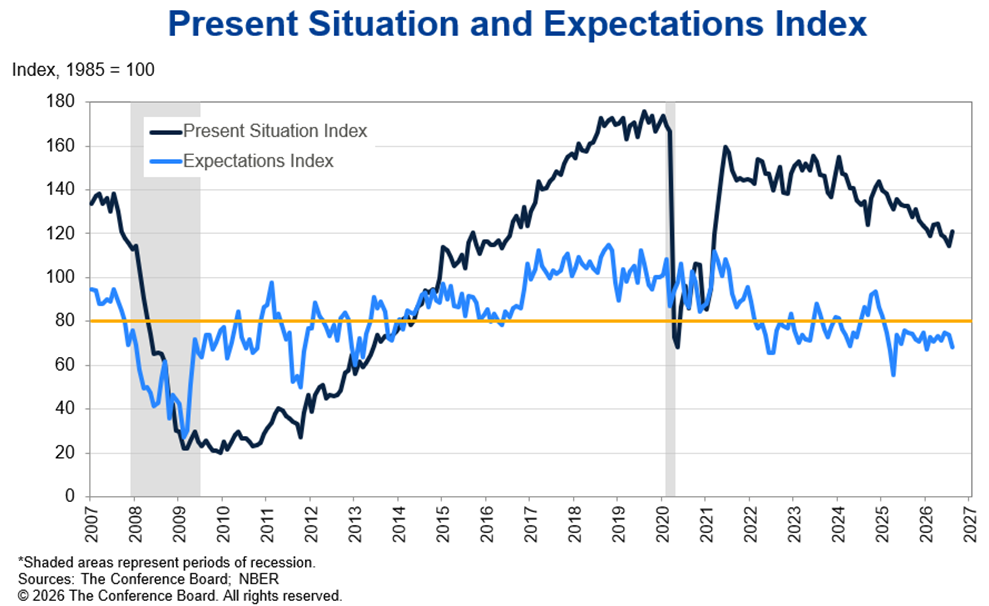
Let’s look at the latest report, released August 25, based on a survey conducted August 3 to 16. In that report, the Present Situation is bullish (at 121.2. with 100 as the baseline), but the Expectations Index is barely half that level, at 68.2 – a 53-point spread. Even worse, the two are moving in opposite directions.
According to the Conference Board, which conducts and publishes this survey, “The Present Situation Index—based on consumers’ assessment of current business and labor market conditions—rose by 6.8 points to 121.2, The Expectations Index—based on consumers’ short-term outlook for income, business, and labor market conditions—fell by 5.8 points to 68.2,” so Americans feel much better about their life today, and much worse about their future – at the same time, August 3–16, 2026. What’s that all about?
According to the Conference Board, The Consumer Confidence Index is benchmarked at 100, which was set back in 1985. Released on the last Tuesday of every month, here’s what their numbers basically mean:
• Over 100 indicates that consumers are more optimistic versus the benchmark.
• Exactly 100 indicates that consumers are neutral versus the benchmark.
• Under 100 indicates that consumers are more pessimistic versus the benchmark
With 100 being neutral, Americans think the present is great (121), but the future is filled with land mines (68). This is bizarre behavior, especially considering the fourth quarter is coming soon – the quarter when we have family holidays, football, falling leaves and rising markets. Historically, America’s stock market delivers more market gains than the other three quarters combined, especially in midterm election years.
This recent expanding division between a positive present and a dismal future is not new. This spread has dominated the last decade of the survey (below). From 2009 to 2012, in Obama’s first term, the future seemed better than the present, but that trend inverted since 2015, except for the COVID pandemic year:
Graphs are for illustrative and discussion purposes only. Please read important disclosures at the end of this commentary.
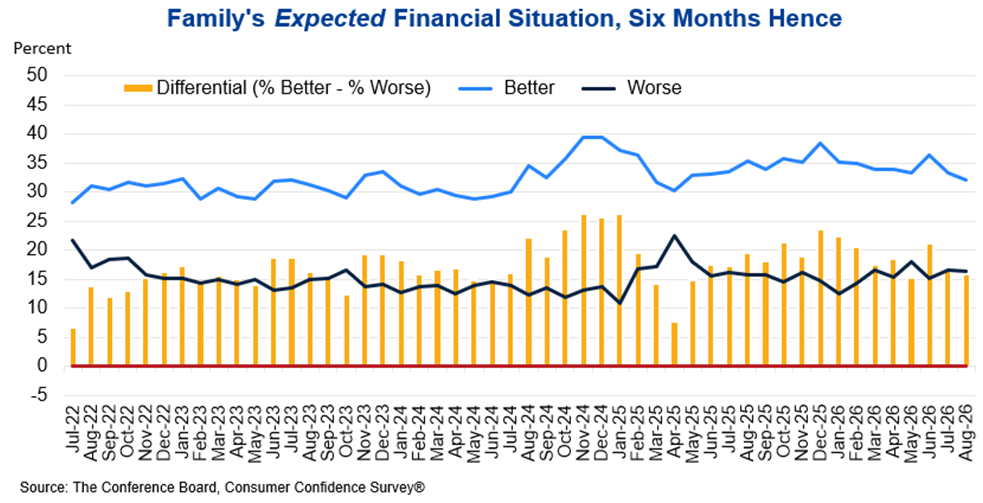
There’s another statistical anomaly at work here. Most respondents feel pretty good about their current income and even better about their future prospects, 3-6 months from now. So…How is it possible U.S. families feel real good about their own future financial security but bad about the rest of America?
Graphs are for illustrative and discussion purposes only. Please read important disclosures at the end of this commentary.
Once again, this dichotomy represents a split personality, or “I’m OK, you’re not, you poor soul.”
In these two polls, we see a better future for us, but not the nation. Why is that? I would lay most of the blame on the media, as “Bad news sells” or (for TV), “If it bleeds, it leads.” People love to rubber-neck at roadside accidents, or watching endless videos of floods in Nepal, or airplane crashes, but those are rare anomalies. Most rivers don’t flood and 99.999% of commercial airline flights take off and land safely.
My theory is that the media keep wanting to scare us. I could take the page-1 headlines from almost any daily newspaper for evidence, but I won’t waste your time with that exercise in the obvious. You can see the evidence for yourself. Instead, I’ll turn to my favorite information media – books. I’ve read dismal financial predictions my whole life, ever since the 1950s, and I believed most of them, then, and for far too long, until 1990 when I turned bullish and formed the whimsical group “Apocaholics Anonymous.”
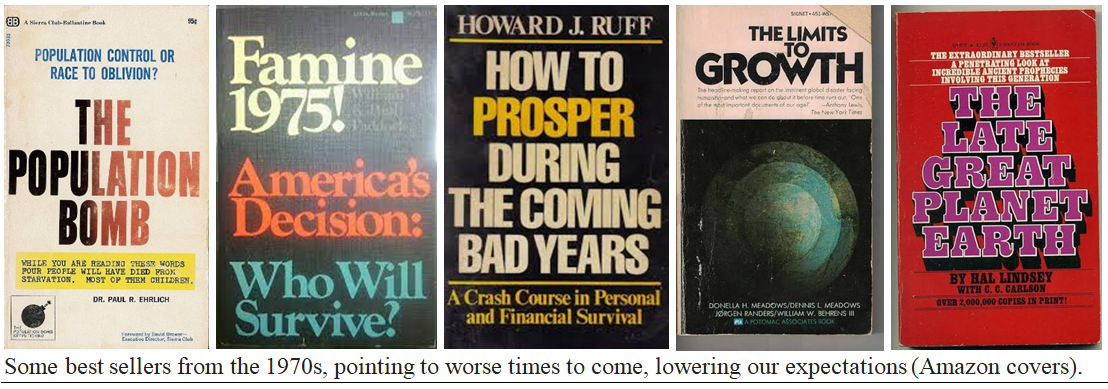
For as long as I’ve been in this business – since the late 1960s – the financial best-sellers have been books about the coming doomsday, so I became the run-of-the-mill profit of doom until the late 1980s, through books ranging from “The Population Bomb” and “Famine 1975” in the late 1960s, predicting hundreds of millions of deaths due to starvation by the mid-1970s, and a depletion of nearly all natural resources by 1990 (a key tenet of “Limits of Growth”). There were also religious books on “the Late Great Earth.”
All these books pointed to a dismal future, not the better conditions which thankfully evolved, driven by technological improvements (like the “Green Revolution”) creating a better (and well-fed) world to come.
When it came to the 1990s, during my belated revolution against all this nonsense, the hits kept coming:
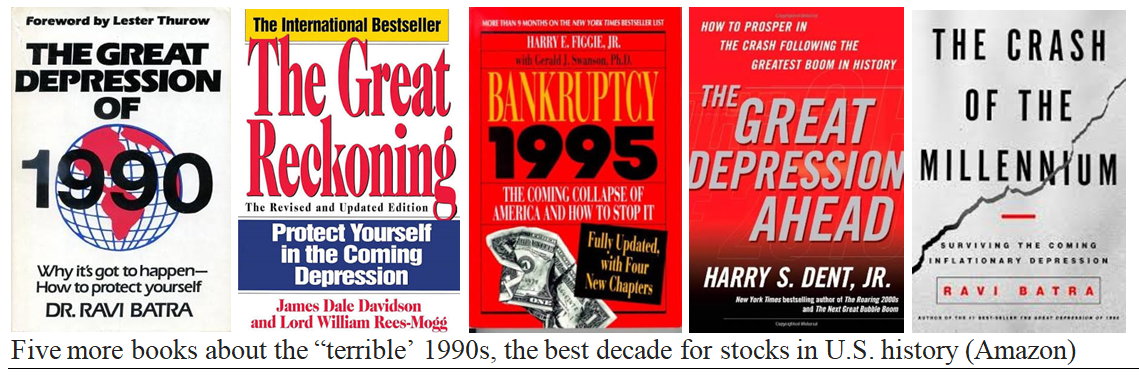
There was no Greater Depression, or Great Bankruptcy in 1995, even though that book was all the rage in the early 1990s. In fact, we had our first string of four federal budget surpluses starting in 1997.
Why Is Confidence in the Future Retreating as the Fourth Quarter is Coming Soon?
As for timing, the latest Consumer Confidence poll – in August in a midterm election year – gave respondents a great opportunity to check into history books about previous autumn markets in mid-term election years. As this chart shows, over the last 90+ years, markets bottomed out in September and then soared an average of nearly 7% from mid-September to the end of the year, before and after election day.
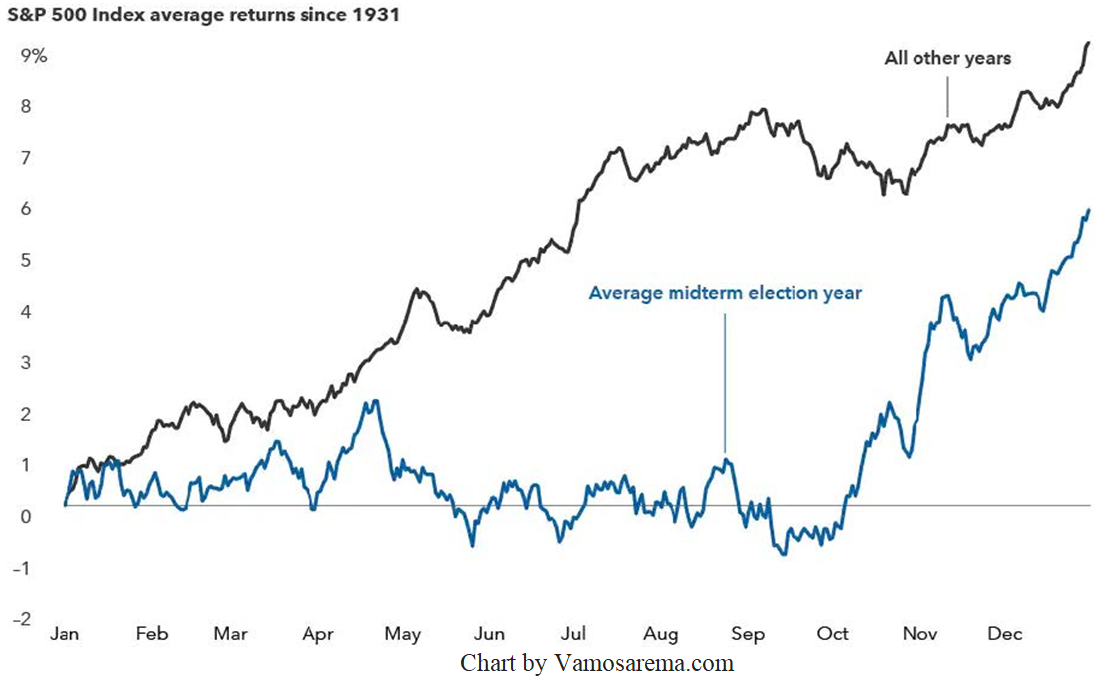 Graphs are for illustrative and discussion purposes only. Please read important disclosures at the end of this commentary.
In the face of these misleading confidence polls, September calls for common sense and rational thinking, not surrendering to scary tales of Octobers past. Recent Octobers have been great, after September lows, so it’s time to bet against the crowd of depressed respondents to confidence polls and proclaim to any and all pollsters, “The Future Looks Bright.” You will likely be among successful contrarians if you do.
All content above represents the opinion of Gary Alexander of Navellier & Associates, Inc.
Also In This Issue
A Look Ahead by Louis Navellier
Inflation Returns, Raising the Odds for a Key Fed Rate Increase
Income Mail by Bryan Perry
Stocks Adjust to a “New Normal” for 10-Year Treasury Rates
Growth Mail by Gary Alexander
The Monthly “Confidence Index” Reveals Irrational Fears
Global Mail by Ivan Martchev
Here Comes the Fed Rate Hike
Sector Spotlight by Jason Bodner
Markets Have Shape…and Memory
View Full Archive
Read Past Issues Here
Important Disclosures:
Although information in these reports has been obtained from and is based upon sources that Navellier believes to be reliable, Navellier does not guarantee its accuracy and it may be incomplete or condensed. All opinions and estimates constitute the authors opinions as of the date the report was created and are subject to change without notice. These reports are for informational purposes only and are not a solicitation for the purchase or sale of any securities or financial services. Any decision to purchase securities mentioned in these reports must take into account existing public information on such securities or any registered prospectus. To the extent permitted by law, neither Navellier & Associates, Inc., nor any of its affiliates, agents, or service providers are providing any investment advice herein and do not assume any liability or responsibility for the readers’ decisions if any. No reader should act or refrain from acting in reliance on the information contained in this communication or for any decision based on it.
None of the stock information, data, or company information presented herein constitutes investment advice or a recommendation by Navellier or a solicitation to buy or sell any securities. Any specific securities identified and described herein do not represent any investment advice.
Information presented is general information that does not take into account your individual circumstances, financial situation, or needs, nor does it present a personalized recommendation to you. Individual stocks presented may not be suitable for every investor. Investment in securities involves significant risk and has the potential for partial or complete loss of funds invested. Investment in fixed income securities has the potential for the investment return and principal value of an investment to fluctuate so that an investor’s holdings, when redeemed, may be worth less than their original cost.
- This report contains statements that are, or may be considered to be, forward-looking statements. All statements that are not historical facts, including statements about our beliefs or expectations, are “forward-looking statements” within the meaning of The U.S. Private Securities Litigation Reform Act of 1995. These statements may be identified by such forward-looking terminology as “expect,” “estimate,” “plan,” “intend,” “believe,” “anticipate,” “may,” “will,” “should,” “could,” “continue,” “project,” or similar statements or variations of such terms. Our forward-looking statements are based on a series of expectations, assumptions, and projections, are not investment advice. All of our forward-looking statements are as of the date of this report only.
- Federal Tax Advice Disclaimer: As required by U.S. Treasury Regulations, you are informed that, to the extent this presentation mentions any federal taxes, Navellier is not presenting any tax advice and should not be used or relied on as tax advice. Navellier does not advise on any income tax requirements or issues. Use of any information presented by Navellier is for general information only and does not represent tax advice either express or implied. You are encouraged to seek professional tax advice for income tax questions and assistance.
- FactSet Disclosure: Navellier does not independently calculate the statistical information included in the attached report. The calculation and the information are provided by FactSet, a company not related to Navellier. Although information contained in the report has been obtained from FactSet and is based on sources Navellier believes to be reliable, Navellier does not guarantee its accuracy, and it may be inaccurate, incomplete or condensed. The report and the related FactSet sourced information is for general information purposes only.