
by Ivan Martchev
September 15, 2026
Ten-year Treasury yields reached 5.01% last week and crude oil hit $104.46 last Friday. Although oil did not close over $100 – nor did the 10-year close above 5% – that does not diminish these dramatic moves.
Most investors take a passing look at where bonds are trading and move on, not realizing Treasury futures have been leading the stock market by the nose. That’s why I follow Treasury yields so closely.
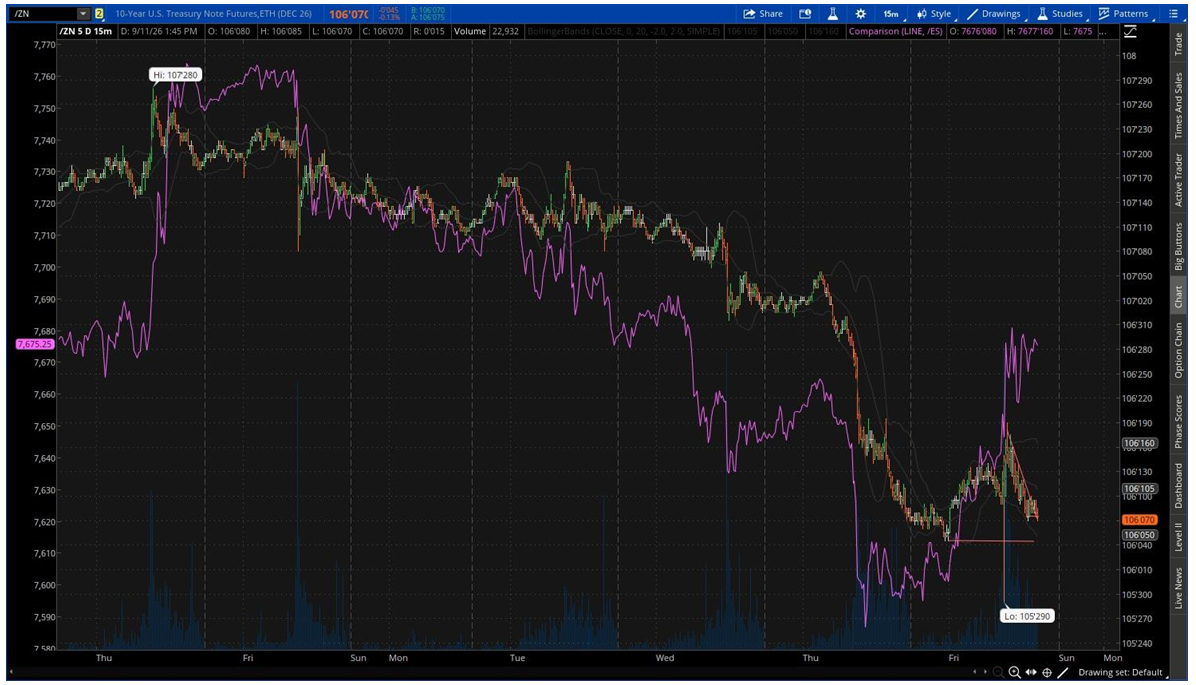
In this first chart, purple is the front-month S&P 500 futures contract over the 10-year Treasury futures contract. As the CPI numbers hit last week, Treasury futures rebounded but lost all their gains for the day, while the S&P futures didn’t lose any gains, which is a change of character, as large moves lower in bond futures (reflecting rising yields) were met by large lower moves in stocks, or vice versa. That’s a positive.
Graphs are for illustrative and discussion purposes only. Please read important disclosures at the end of this commentary.
The low in Treasury futures (which trade in 32nds of a point) was 105’29, which corresponds to a yield of 5.01%, reflecting the overall pressure on the Treasury market of late. It was incorrectly reported in the media that the 10-year never reached 5% on Friday because they all used different quoting services and Treasury bonds have different coupons (when issued at different times) making the exact yield at 8.30 am less precise. Because the CME has the most liquid 10-year Treasury futures contract, the lowest price (at the highest yield) on Friday corresponds to a yield of 5.01%, breaching the important 5% “barrier.”
The pressure on Treasury yields is emanating not only from U.S. inflation numbers but overall pressure on global bond yields, which are making similar moves. Japanese 10-year JGBs recently traded at 30-year highs over 3%, while Germany’s 10-year bonds traded over 3.5%, last seen in 2009. This is due to mounting government deficits and elevated energy prices stemming from the wars in Iran and Ukraine, pushing global diesel to all-time highs. European (and many Asian) natural gas markets depending on Hormuz LNG flows trade at 10x U.S. prices, where natural gas is plentiful and flows via pipelines.
Graphs are for illustrative and discussion purposes only. Please read important disclosures at the end of this commentary.
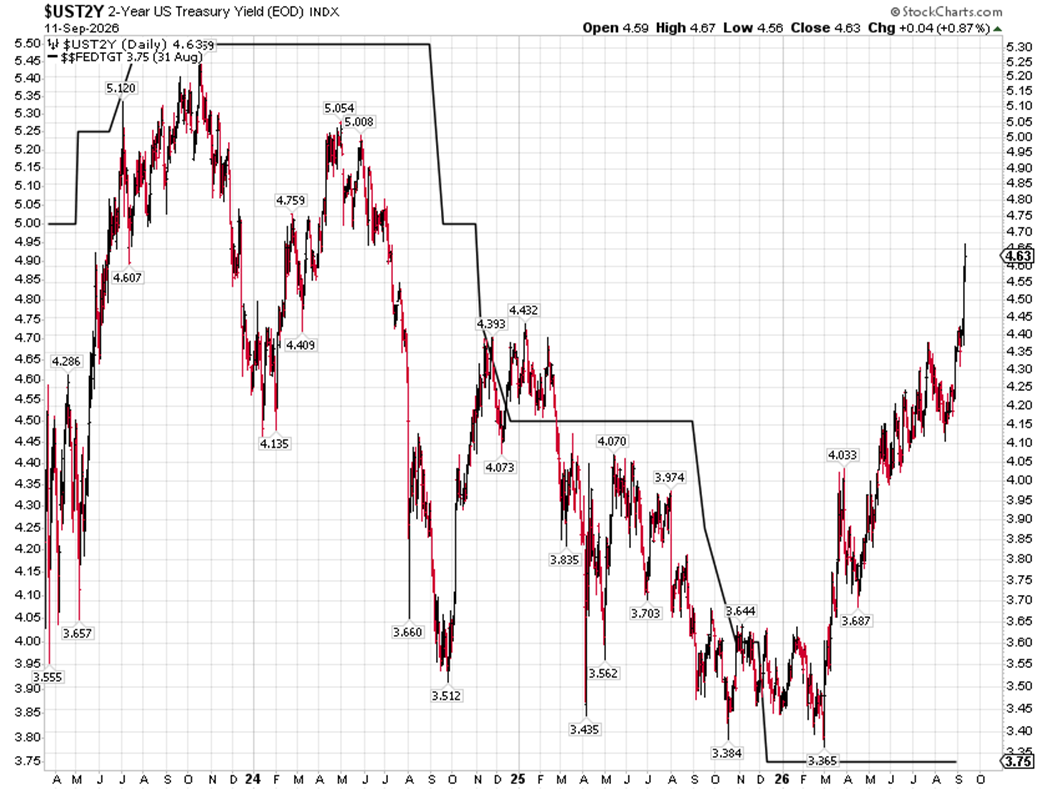
The 2-year U.S. Treasury yield, which tends to lead Fed policy moves, closed Friday at a new 2026 high at 4.63%. The Fed funds rate is lower, at 3.75%. While the 2-year note does not have to exactly match the Fed funds rate, the spread indicates the Fed is late by about three 25-basis point rate hikes.
I don’t think the Fed will hike three times, but I do think they may hike twice. The first Warsh-era Fed rate hike has a very high chance of happening tomorrow, with the second one most likely coming in December, after the elections. The Fed seldom stops at one rate hike, and if they are “behind the curve,” which they are, based on 2-year yields, another rate hike after the one coming tomorrow is likely.
If the Fed hikes on Wednesday – as there are no guarantees here, only likelihoods – the 10-year Treasury yield might get a break from their relentless recent rise. If the Fed does not hike rates this week, we could see 10-year rates rise well above 5%, meaning the Treasury market will in effect be hiking for the Fed.
For the time being, three rate hikes seem unlikely, especially if the Iran war ends in 2026, but the Iranians are using the price of crude oil (and rising Treasury yields as a consequence) as their weapon against the Trump administration. They reactivated their Houthi rebels in Yemen, where “the other Strait” – that of Bab-al-Mandeb – is now harder to navigate, just as the Trump administration was clearing out the mines from the Strait of Hormuz and policing it more effectively. There are also drone strikes on Saudi Arabia coming from Shiite militias in Iraq last week, which is another reason WTI crude oil got above $104.
Given these new developments, it is fair to say the Iranian situation is deteriorating, with the U.S. midterm elections just seven weeks away with the price of diesel in the U.S. reaching an all-time high. If it is true “All is fair in love and war,” in this case the Iranians appear to be avid readers of the Art of War by Sun Tzu as they are exceeding all pre-war expectations as to their array of countermeasures.
President Trump used to say this is just “A little excursion” for six-weeks before the summer, but now it looks like a vacation from hell gone bad, lasting over six months so far. The Iranians appear to be of the opinion that if the Trump administration loses majority support in either Houses of Congress (or both), they will get hamstrung, especially in their war powers. They appear to be moving towards that goal.
The Trump administration could have waited until after the election, say January 2027, to deal with Iran and focused on the election first, as the economy is doing well, but the timing of the Iran war appears to be one of the biggest miscalculations of President Trump’s otherwise illustrious political career.
I think if the war ends this month (which would be a miracle, with a 5% chance, if that), the S&P 500 could go to 8500 by year end as the 10-year would fall relatively quickly towards 4.5% as oil would head towards $75. The stock market is cheaper than when the year started as the S&P 500 has appreciated less than half the expected EPS growth for 2026, shrinking its forward P/E multiple to about 19. Looking at median P/Es, it is even cheaper as the overall multiple is pulled up by mega-cap hyperscalers. The stock market is not expensive but rising interest rates tend to produce a shrinkage of P/Es that is rather notable.
Realistically, I don’t think the war in Iran (or Ukraine) will end this month, so we will likely find where the S&P 500 will be with 5.25% on the 10-year Treasury and $120 oil – both of which are within reach.
All content above represents the opinion of Ivan Martchev of Navellier & Associates, Inc.
Also In This Issue
A Look Ahead by Louis Navellier
Inflation Returns, Raising the Odds for a Key Fed Rate Increase
Income Mail by Bryan Perry
Stocks Adjust to a “New Normal” for 10-Year Treasury Rates
Growth Mail by Gary Alexander
The Monthly “Confidence Index” Reveals Irrational Fears
Global Mail by Ivan Martchev
Here Comes the Fed Rate Hike
Sector Spotlight by Jason Bodner
Markets Have Shape…and Memory
View Full Archive
Read Past Issues Here
Important Disclosures:
Although information in these reports has been obtained from and is based upon sources that Navellier believes to be reliable, Navellier does not guarantee its accuracy and it may be incomplete or condensed. All opinions and estimates constitute the authors opinions as of the date the report was created and are subject to change without notice. These reports are for informational purposes only and are not a solicitation for the purchase or sale of any securities or financial services. Any decision to purchase securities mentioned in these reports must take into account existing public information on such securities or any registered prospectus. To the extent permitted by law, neither Navellier & Associates, Inc., nor any of its affiliates, agents, or service providers are providing any investment advice herein and do not assume any liability or responsibility for the readers’ decisions if any. No reader should act or refrain from acting in reliance on the information contained in this communication or for any decision based on it.
None of the stock information, data, or company information presented herein constitutes investment advice or a recommendation by Navellier or a solicitation to buy or sell any securities. Any specific securities identified and described herein do not represent any investment advice.
Information presented is general information that does not take into account your individual circumstances, financial situation, or needs, nor does it present a personalized recommendation to you. Individual stocks presented may not be suitable for every investor. Investment in securities involves significant risk and has the potential for partial or complete loss of funds invested. Investment in fixed income securities has the potential for the investment return and principal value of an investment to fluctuate so that an investor’s holdings, when redeemed, may be worth less than their original cost.
- This report contains statements that are, or may be considered to be, forward-looking statements. All statements that are not historical facts, including statements about our beliefs or expectations, are “forward-looking statements” within the meaning of The U.S. Private Securities Litigation Reform Act of 1995. These statements may be identified by such forward-looking terminology as “expect,” “estimate,” “plan,” “intend,” “believe,” “anticipate,” “may,” “will,” “should,” “could,” “continue,” “project,” or similar statements or variations of such terms. Our forward-looking statements are based on a series of expectations, assumptions, and projections, are not investment advice. All of our forward-looking statements are as of the date of this report only.
- Federal Tax Advice Disclaimer: As required by U.S. Treasury Regulations, you are informed that, to the extent this presentation mentions any federal taxes, Navellier is not presenting any tax advice and should not be used or relied on as tax advice. Navellier does not advise on any income tax requirements or issues. Use of any information presented by Navellier is for general information only and does not represent tax advice either express or implied. You are encouraged to seek professional tax advice for income tax questions and assistance.
- FactSet Disclosure: Navellier does not independently calculate the statistical information included in the attached report. The calculation and the information are provided by FactSet, a company not related to Navellier. Although information contained in the report has been obtained from FactSet and is based on sources Navellier believes to be reliable, Navellier does not guarantee its accuracy, and it may be inaccurate, incomplete or condensed. The report and the related FactSet sourced information is for general information purposes only.