by Bryan Perry
August 8, 2023
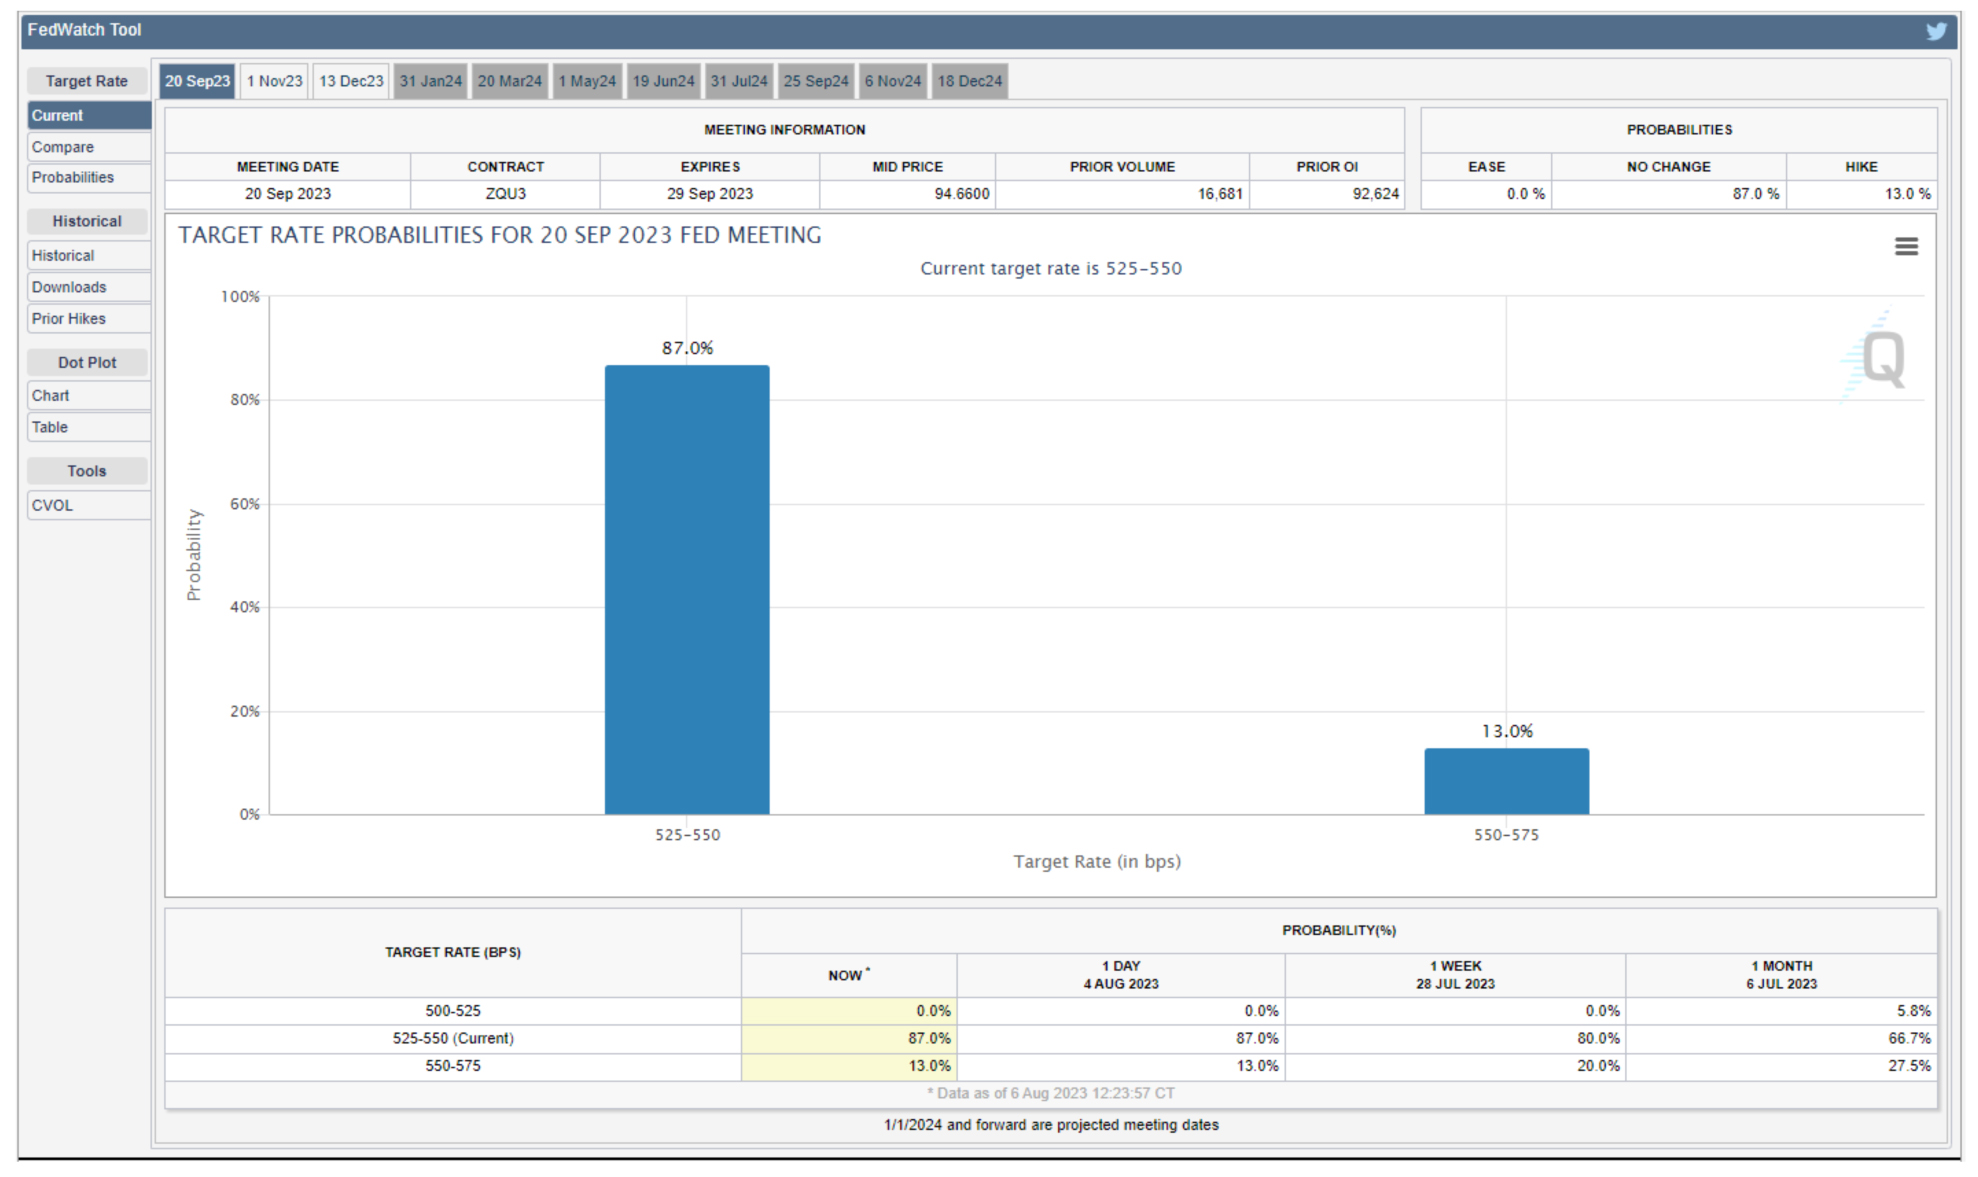
Looking at the big picture for the stock market, one mostly needs to pay close attention to the bond market. Rising bond yields pose a big challenge to the market’s leading growth companies. And though there is strong disagreement as to whether the Fed is justified in taking the Fed funds rate towards 6.0%, the FedWatchTool shows only 13% see another quarter-point hike at the September 20 FOMC meeting.
Graphs are for illustrative and discussion purposes only. Please read important disclosures at the end of this commentary.
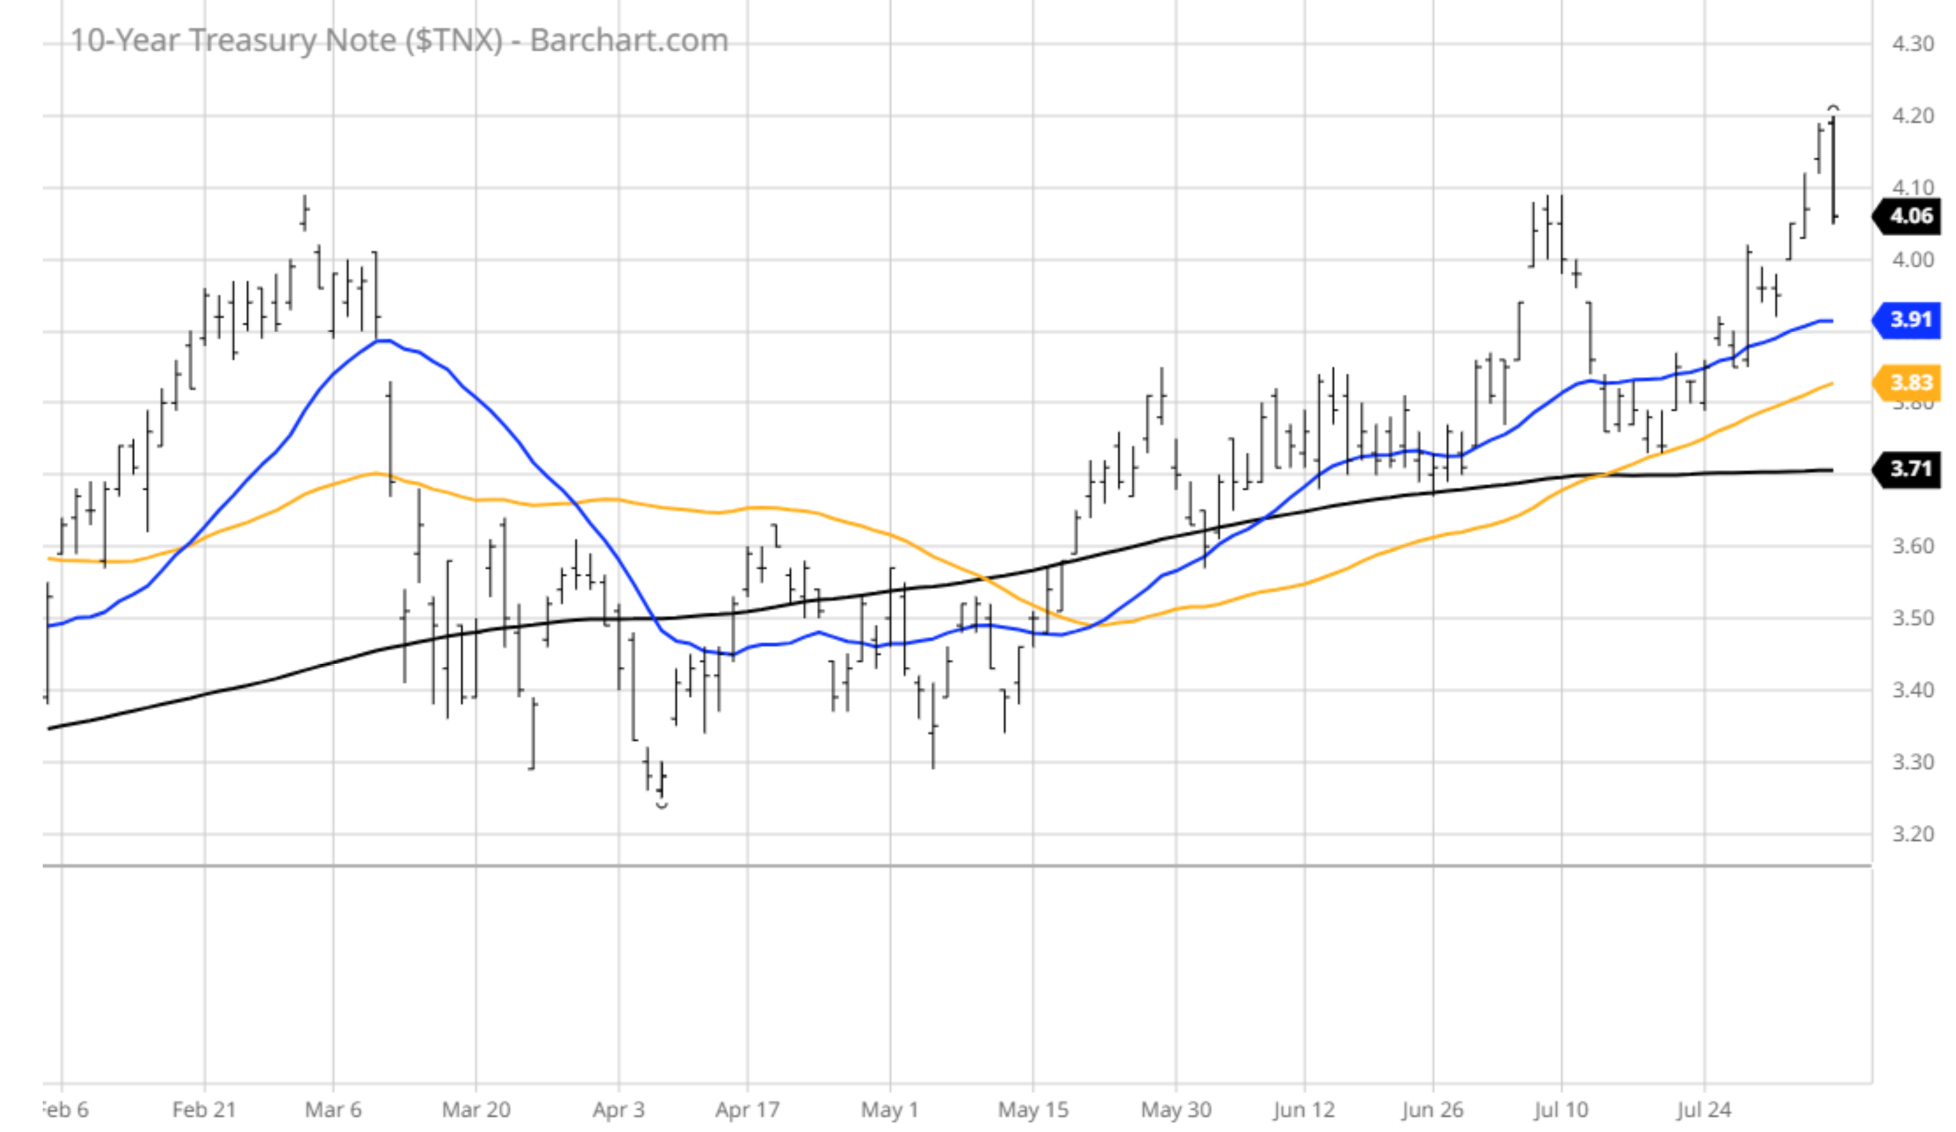
The odds of another rate hike were diminished by last Friday’s employment report, where July non-farm payrolls came in a tad light of forecast, coupled with the unemployment rate dropping to 3.5% from the 3.6% rate registered in June. That took the heat off Wednesday’s hot ADP private payrolls report that came in way above estimates (324k vs. 185k) and helped restore order from a sharp sell-off in the Treasury market that sent 5-, 10-, 20-, and 30-year yields up and through 4.0%. The benchmark 10-year T-Note touched 4.20%, the highest level since November 2022, before settling at 4.06% by week’s end.
The shifting recession narrative can be seen in 10-year T-Note yields that moved from 3.6% at the end of May to over 4% after Fed Chair Jerome Powell said, “The central bank’s staff no longer forecasts a U.S. recession, and we do have a shot for inflation to return to target levels without high levels of job losses.”
Graphs are for illustrative and discussion purposes only. Please read important disclosures at the end of this commentary.
In the same breath, Powell also said that there was “a lot left to go to see such a soft landing,” seeing “a noticeable slowdown in growth starting later this year,” but “given the resilience of the economy recently” the Fed is “no longer forecasting a recession.” For further clarification, what these two charts (above) seem to imply is that while rates are normalizing, the Fed will likely pause at the September meeting and possibly raise once more in November or December if the economy continues to be resilient.
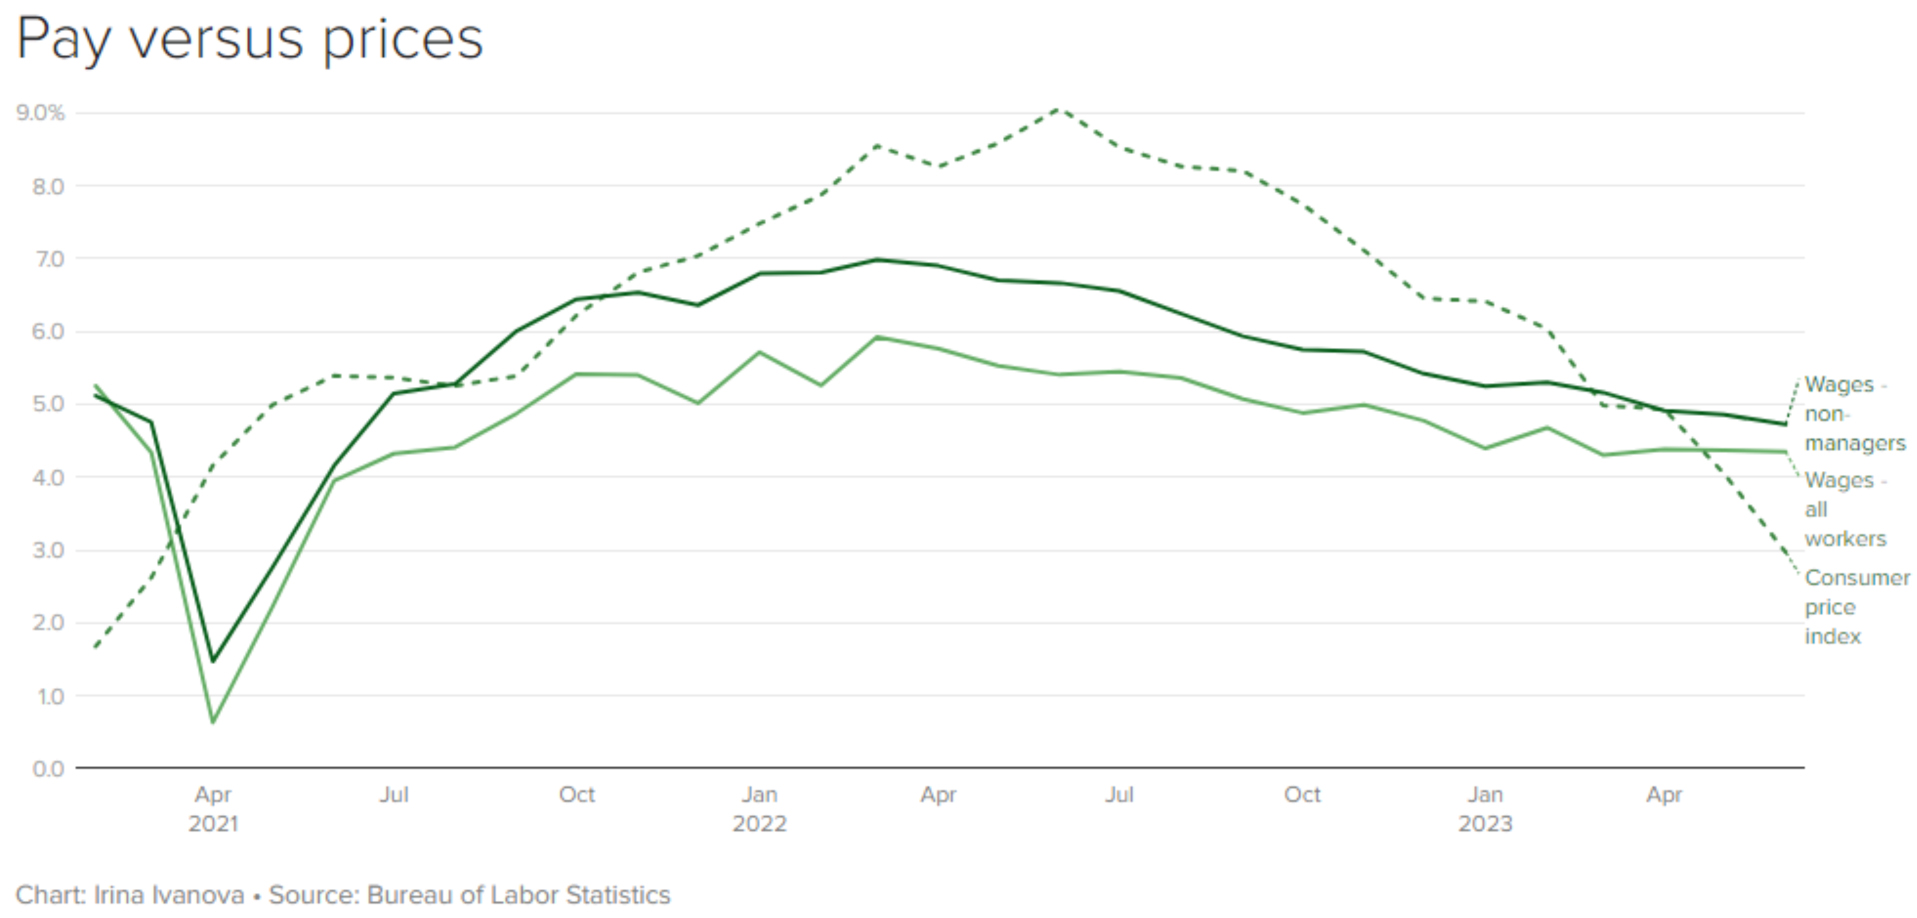
One statistic reported back on July 18 is particularly encouraging to the Fed, and to most workers: For the first time in two years, wages are finally rising faster than consumer prices, according to data from the Bureau of Labor Statistics. Average hourly pay has grown at an annual rate of 4.4% for the last three months – faster than the Consumer Price Index, which rose at a rate of 3% in June and 4% in May. This is a small win for workers, but it sends a message to the Fed that tight labor supply and solid wage growth will probably result in the Fed funds rate staying at the current 5.25% to 5.50% level for quite some time.
Graphs are for illustrative and discussion purposes only. Please read important disclosures at the end of this commentary.
This assumption runs counter to the wider belief that the Fed will start cutting rates early next year, perhaps starting around March 2024. Investors will get July inflation data later this week, when the Consumer Price Index (CPI) and Producer Price Index (PPI) are released, both of which are forecast to increase by 0.2%. Here’s the schedule of releases, with the CPI and PPI released Thursday and Friday.
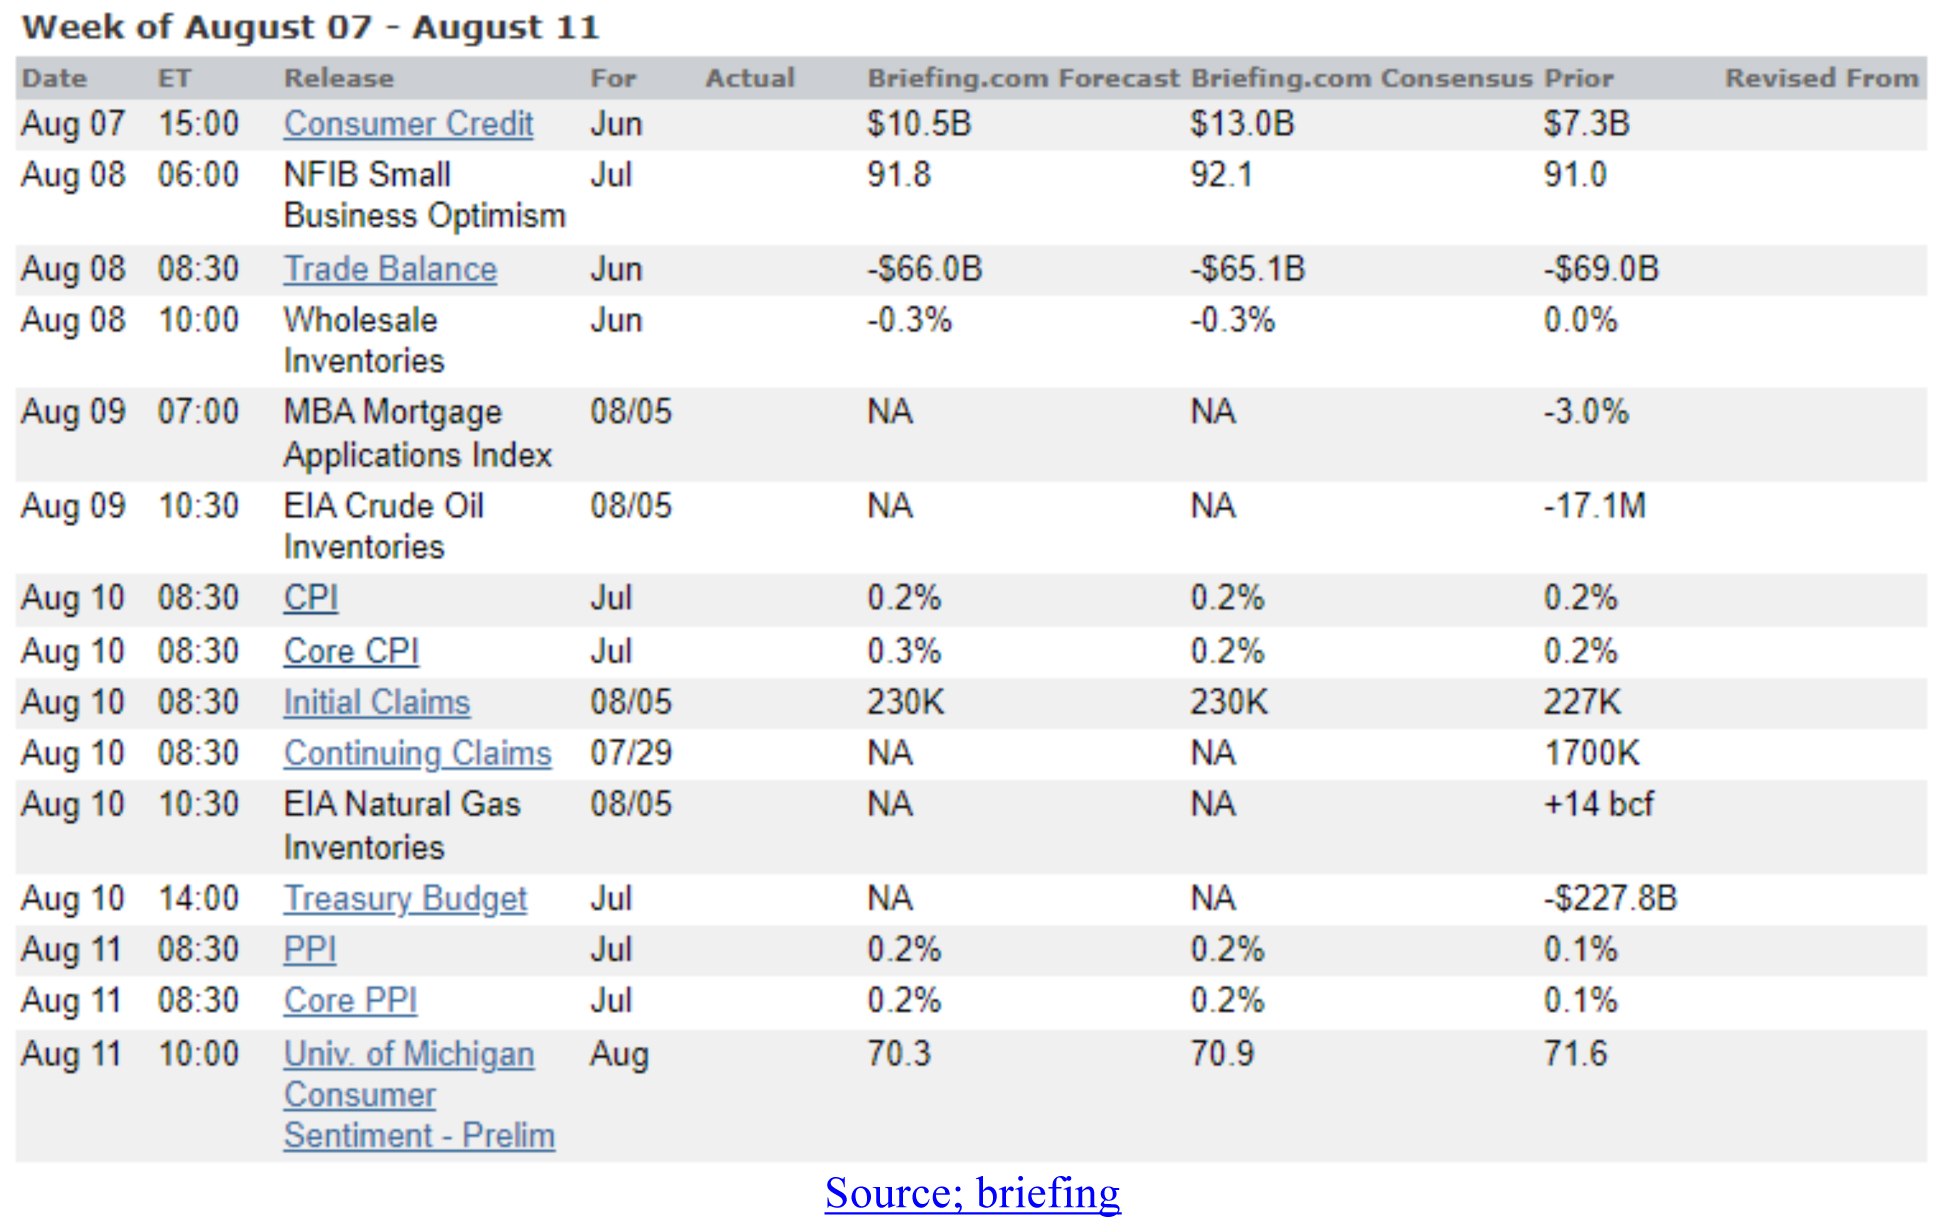
With food and energy prices rising this past month, a lower inflation reading will likely be the result of a softening in the shelter component and new and used car component. All major used vehicle market segments saw seasonally adjusted prices that were lower year over year in the first half of July.

Graphs are for illustrative and discussion purposes only. Please read important disclosures at the end of this commentary.
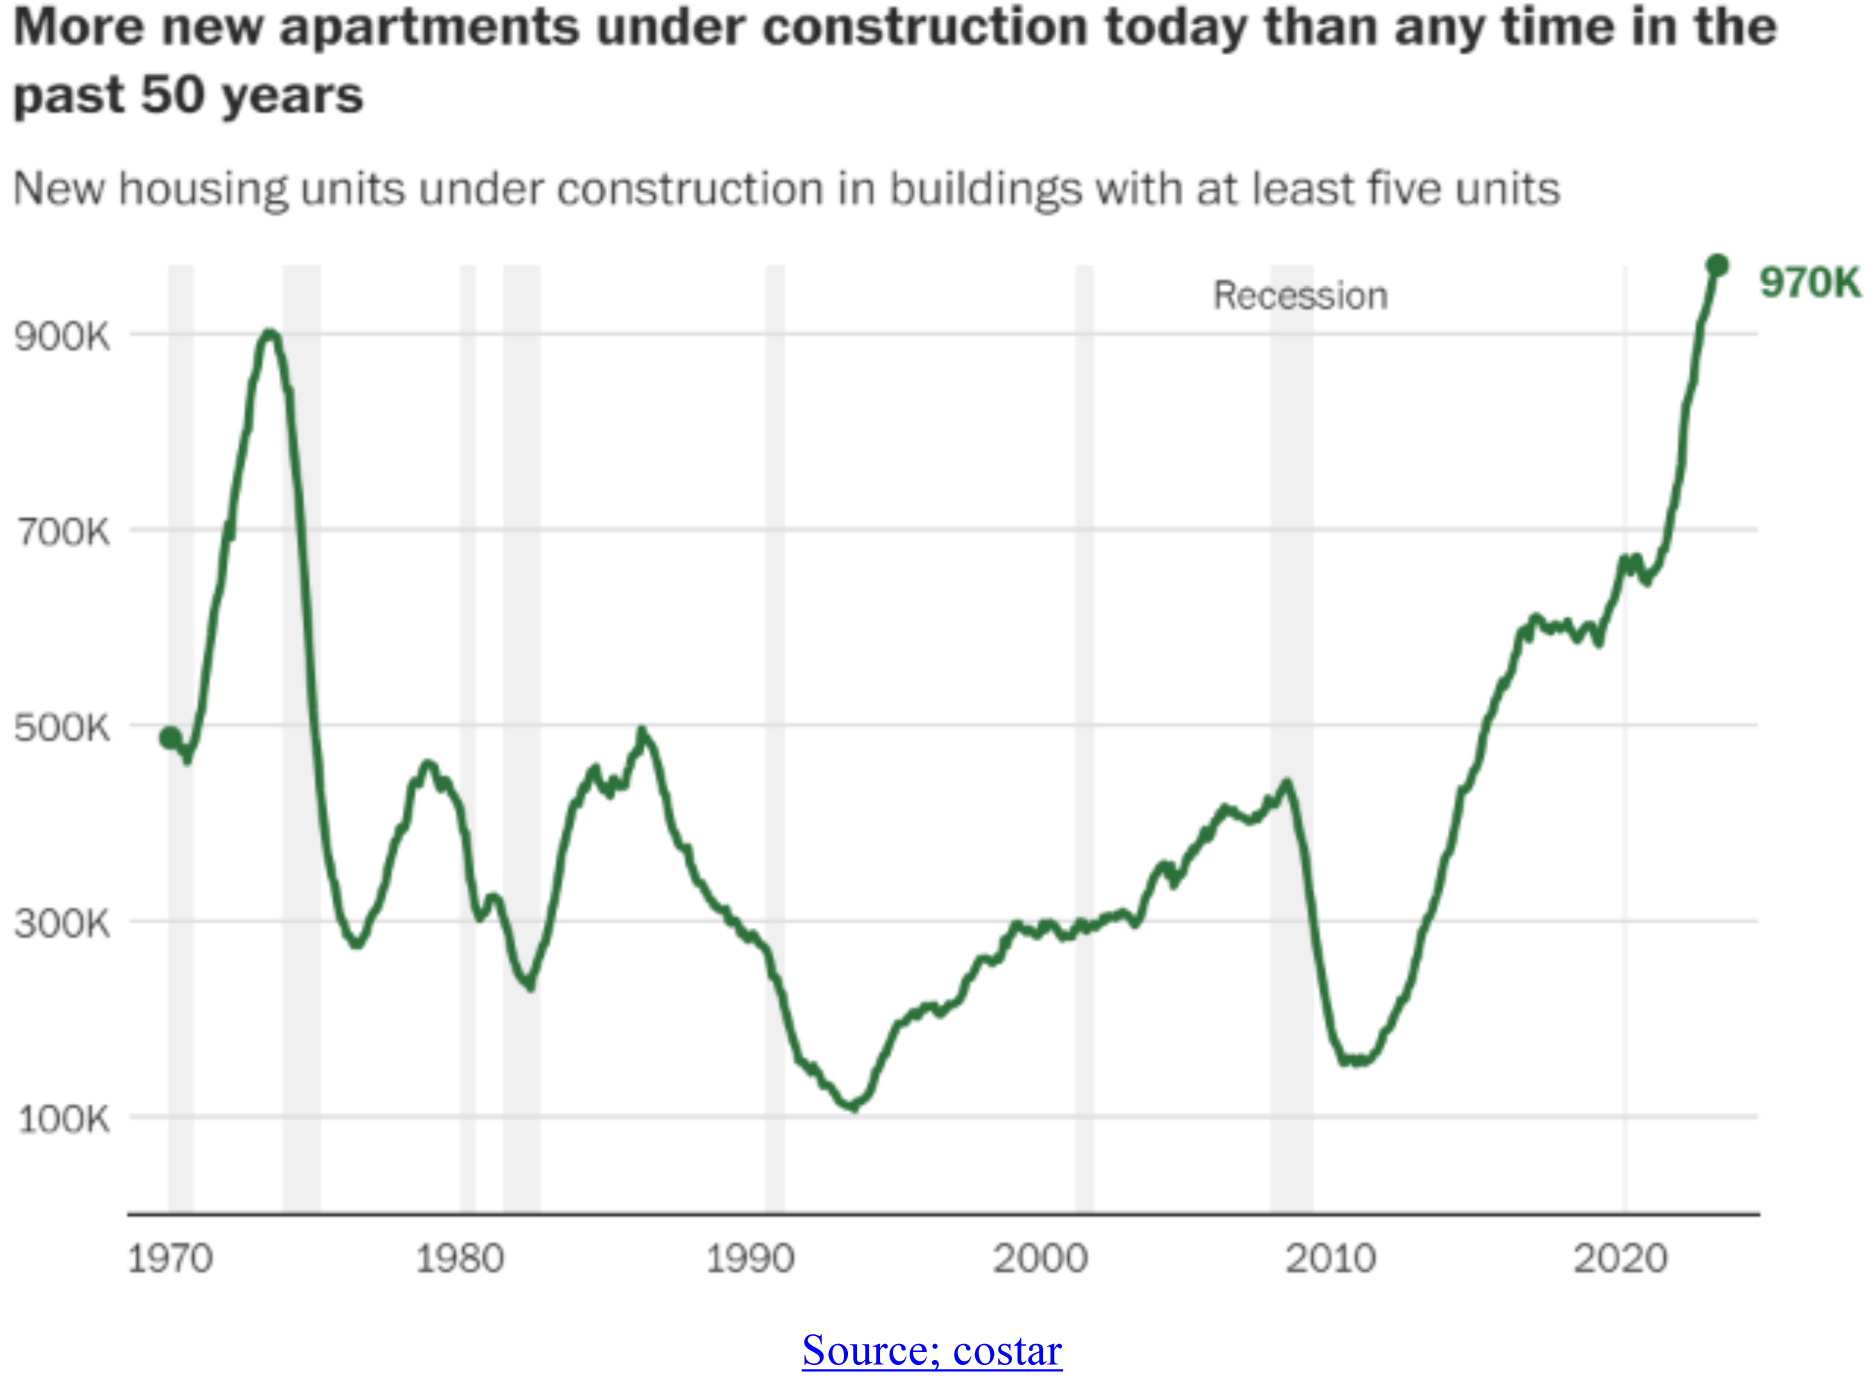
Rent growth around the country is back at pre-pandemic norms — growing about 1 to 3 percent per year, according to real estate data firm CoStar Group. In some recent hot spots, including Austin and Atlanta, prices are actually falling. “The rental market is finally taking a breath,” said Igor Popov, chief economist at Apartment List. “This summer looks a lot different from the last two summers: We are getting to a more stable period, and in some parts of the country, renters are back in the driver’s seat.”
I believe the biggest reason for that slowdown is more housing being built. Nearly 1 million new apartment units — an all-time high — are under construction around the country, census data shows. Of those, 520,000 are expected to hit the market this year, with another 460,000 to follow in 2024, according to CoStar.
Graphs are for illustrative and discussion purposes only. Please read important disclosures at the end of this commentary.
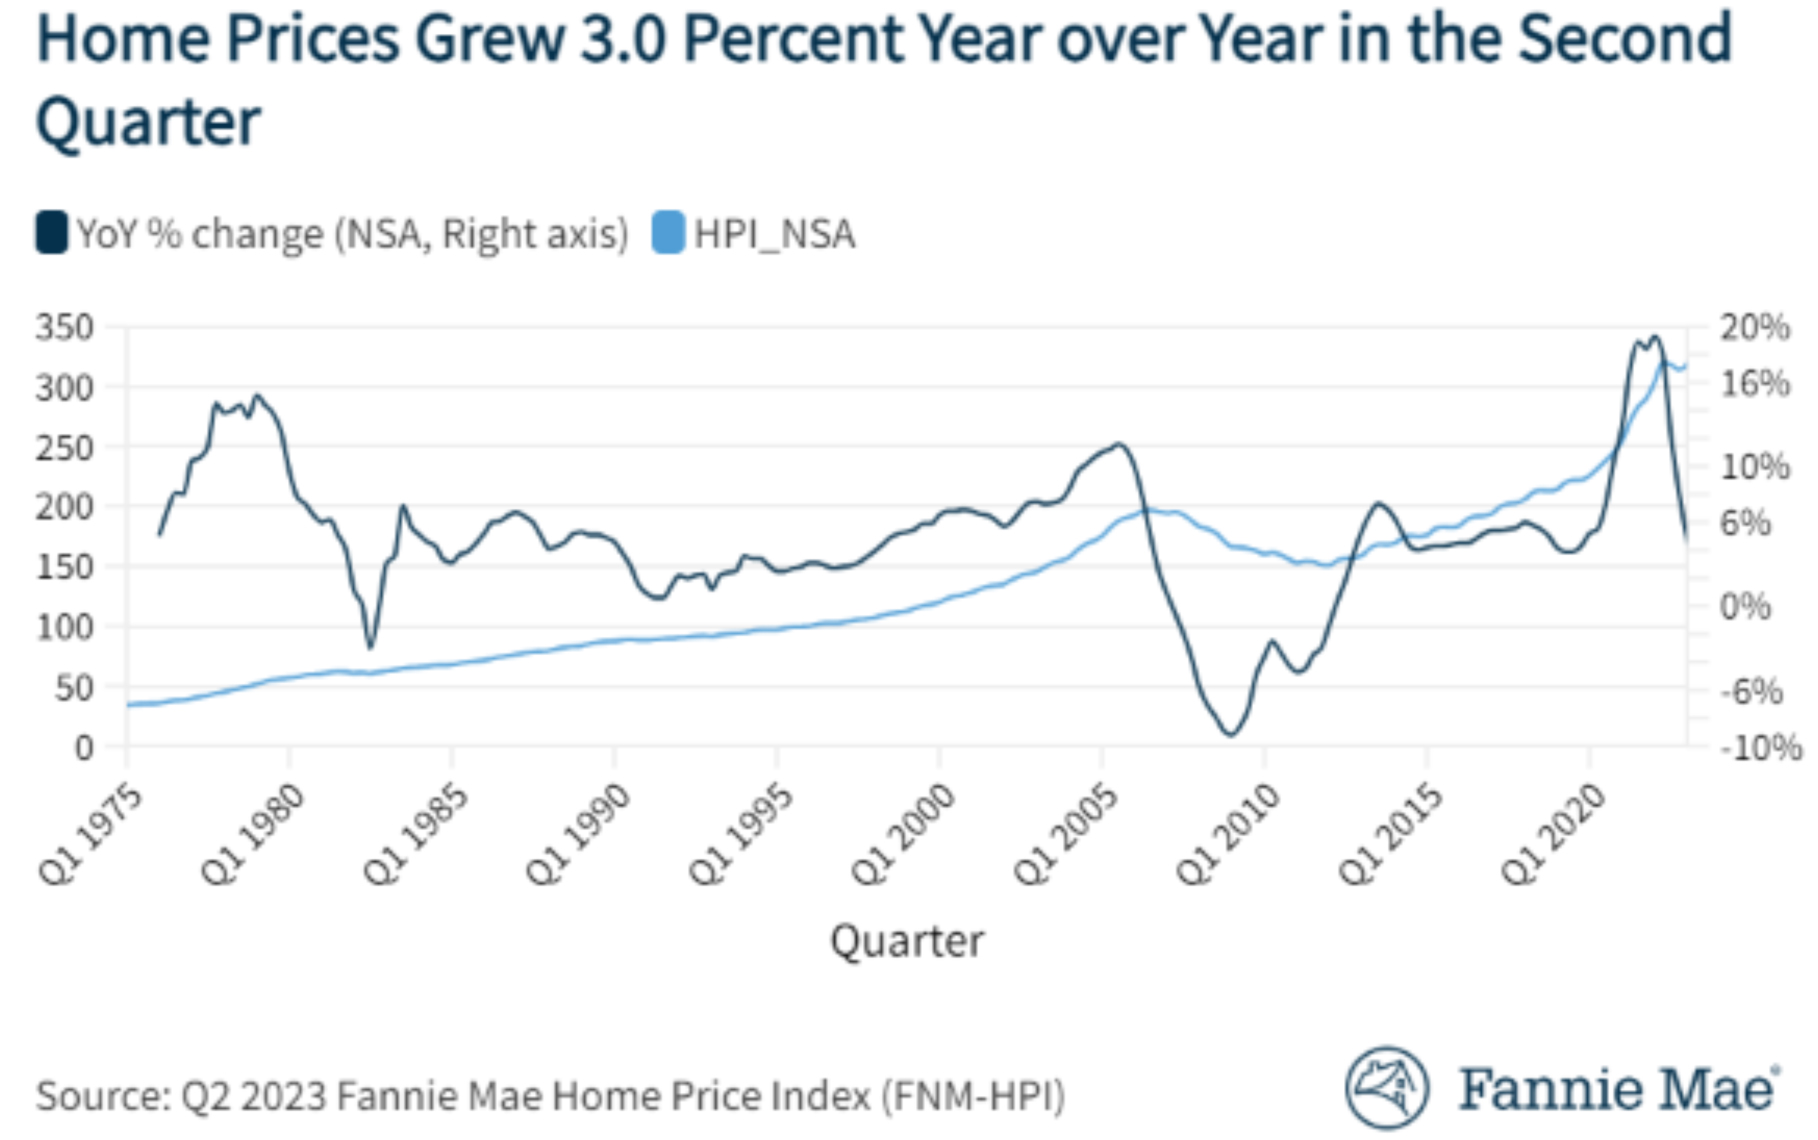
New home prices are holding up even as mortgage rates trend higher, due to ongoing supply shortages, but seeing some of the air come out of the rental market is good news. There is some leveling off of price increases for home sales, up only 3.0% year-over-year. So, housing inflation is also moving down.
Graphs are for illustrative and discussion purposes only. Please read important disclosures at the end of this commentary.
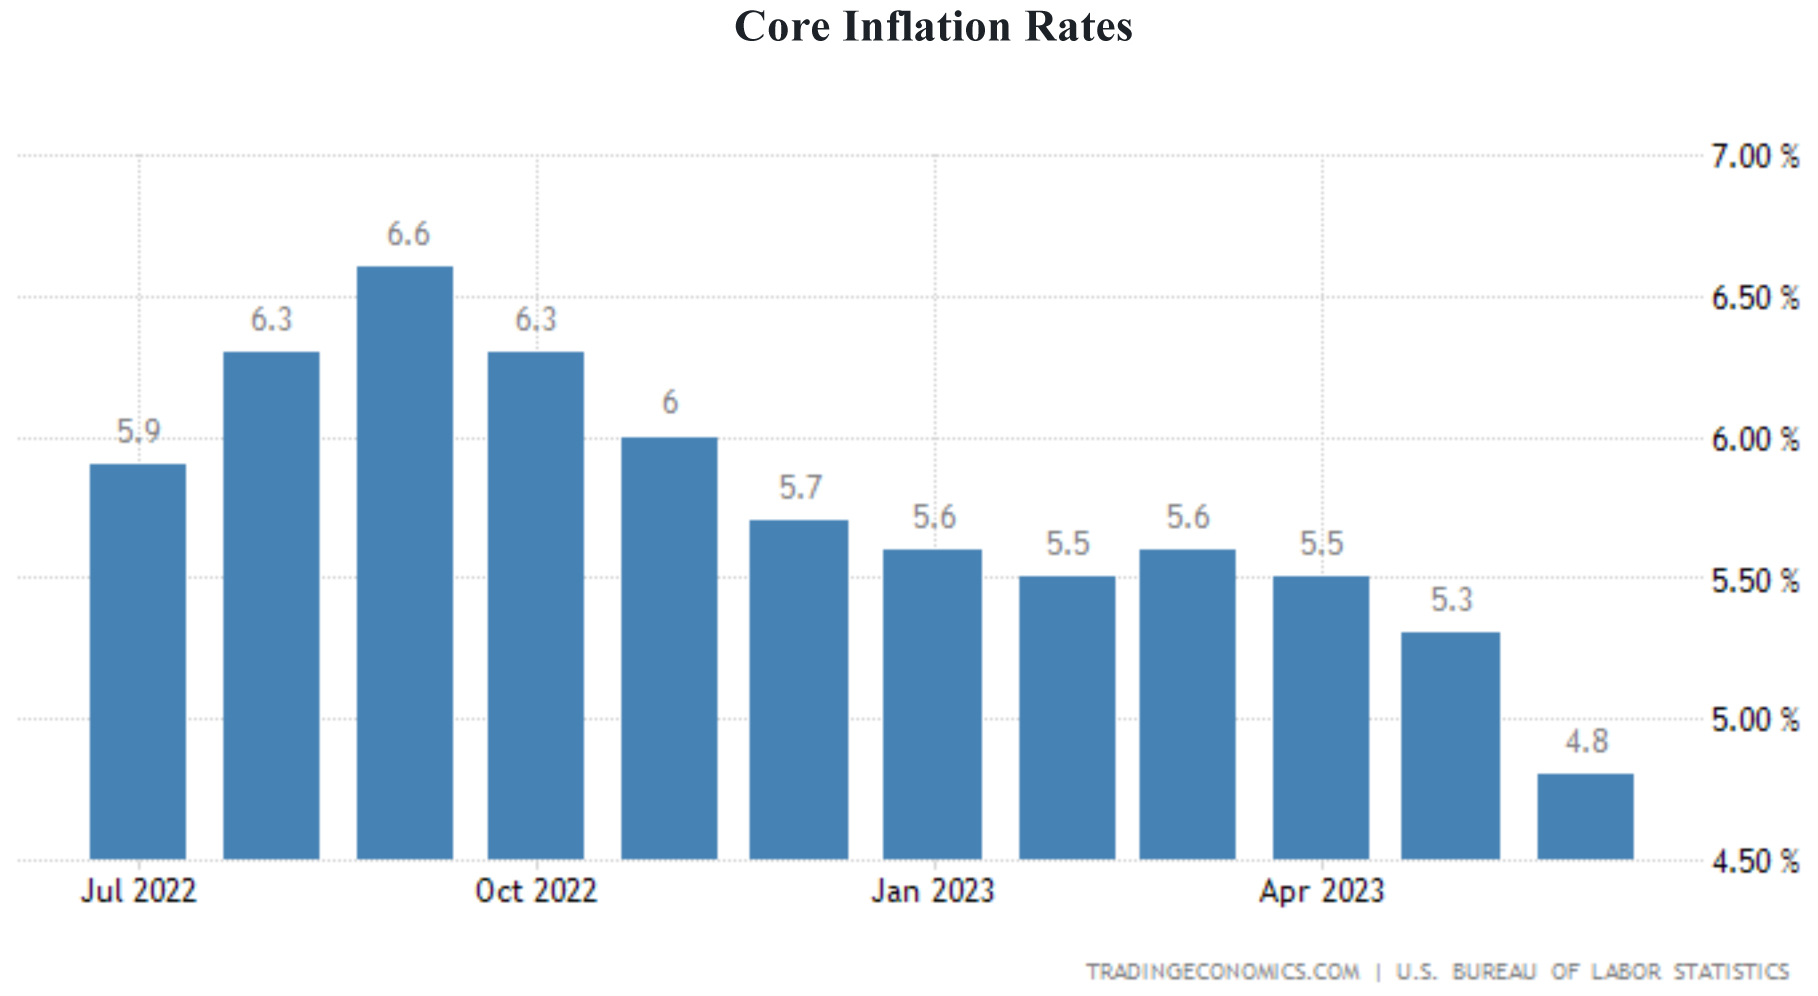
As of June’s reading, the core inflation rate for the U.S. stands at 4.8% and needs to come down further to enable the servicing of the massive U.S. debt that Fitch and other rating agencies see as a long-term threat, citing “failure of the U.S. authorities to meaningfully tackle medium-term fiscal challenges.”
Graphs are for illustrative and discussion purposes only. Please read important disclosures at the end of this commentary.
When asked about the timing of the downgrade, Richard Francis, a senior director at Fitch, told Reuters that the agency wanted to “take a deep look” at long-standing concerns around governance and the U.S. debt profile. “Fitch isn’t telling anybody anything they don’t already know,” said Mark Sobel, a former longtime Treasury official who is now U.S. chairman of financial think-tank OMFIF. Longer term, he said, “Neither political party has evinced the guts to begin making the sacrifices needed on both the spending and revenue sides – which will only increase as time marches on.”
Even if the Fed doesn’t raise rates further, the debt will continue to soar as existing debt is replaced with new debt serviced at higher prevailing rates. That’s why it is imperative the Fed gets rates back down. With this week’s inflation data on deck, we will know soon if lower inflation will make that possible.
All content above represents the opinion of Bryan Perry of Navellier & Associates, Inc.
Also In This Issue
A Look Ahead by Louis Navellier
The Bank of England Begs Ben Bernanke to Rescue Them!
Income Mail by Bryan Perry
The Great Rate Plateau Begins
Growth Mail by Gary Alexander
After No Recession in 45 Years – Will China’s Winning Streak End This Year?
Global Mail by Ivan Martchev
The Stock Market Sell-off Has Started, Where Could It Get To?
Sector Spotlight by Jason Bodner
Silver Linings in the Market’s Two Worst Months
View Full Archive
Read Past Issues Here

Bryan Perry
SENIOR DIRECTOR
Bryan Perry is a Senior Director with Navellier Private Client Group, advising and facilitating high net worth investors in the pursuit of their financial goals.
Bryan’s financial services career spanning the past three decades includes over 20 years of wealth management experience with Wall Street firms that include Bear Stearns, Lehman Brothers and Paine Webber, working with both retail and institutional clients. Bryan earned a B.A. in Political Science from Virginia Polytechnic Institute & State University and currently holds a Series 65 license. All content of “Income Mail” represents the opinion of Bryan Perry
Important Disclosures:
Although information in these reports has been obtained from and is based upon sources that Navellier believes to be reliable, Navellier does not guarantee its accuracy and it may be incomplete or condensed. All opinions and estimates constitute Navellier’s judgment as of the date the report was created and are subject to change without notice. These reports are for informational purposes only and are not a solicitation for the purchase or sale of a security. Any decision to purchase securities mentioned in these reports must take into account existing public information on such securities or any registered prospectus.To the extent permitted by law, neither Navellier & Associates, Inc., nor any of its affiliates, agents, or service providers assumes any liability or responsibility nor owes any duty of care for any consequences of any person acting or refraining to act in reliance on the information contained in this communication or for any decision based on it.
Past performance is no indication of future results. Investment in securities involves significant risk and has the potential for partial or complete loss of funds invested. It should not be assumed that any securities recommendations made by Navellier. in the future will be profitable or equal the performance of securities made in this report. Dividend payments are not guaranteed. The amount of a dividend payment, if any, can vary over time and issuers may reduce dividends paid on securities in the event of a recession or adverse event affecting a specific industry or issuer.
None of the stock information, data, and company information presented herein constitutes a recommendation by Navellier or a solicitation to buy or sell any securities. Any specific securities identified and described do not represent all of the securities purchased, sold, or recommended for advisory clients. The holdings identified do not represent all of the securities purchased, sold, or recommended for advisory clients and the reader should not assume that investments in the securities identified and discussed were or will be profitable.
Information presented is general information that does not take into account your individual circumstances, financial situation, or needs, nor does it present a personalized recommendation to you. Individual stocks presented may not be suitable for every investor. Investment in securities involves significant risk and has the potential for partial or complete loss of funds invested. Investment in fixed income securities has the potential for the investment return and principal value of an investment to fluctuate so that an investor’s holdings, when redeemed, may be worth less than their original cost.
One cannot invest directly in an index. Index is unmanaged and index performance does not reflect deduction of fees, expenses, or taxes. Presentation of Index data does not reflect a belief by Navellier that any stock index constitutes an investment alternative to any Navellier equity strategy or is necessarily comparable to such strategies. Among the most important differences between the Indices and Navellier strategies are that the Navellier equity strategies may (1) incur material management fees, (2) concentrate its investments in relatively few stocks, industries, or sectors, (3) have significantly greater trading activity and related costs, and (4) be significantly more or less volatile than the Indices.
ETF Risk: We may invest in exchange traded funds (“ETFs”) and some of our investment strategies are generally fully invested in ETFs. Like traditional mutual funds, ETFs charge asset-based fees, but they generally do not charge initial sales charges or redemption fees and investors typically pay only customary brokerage fees to buy and sell ETF shares. The fees and costs charged by ETFs held in client accounts will not be deducted from the compensation the client pays Navellier. ETF prices can fluctuate up or down, and a client account could lose money investing in an ETF if the prices of the securities owned by the ETF go down. ETFs are subject to additional risks:
- ETF shares may trade above or below their net asset value;
- An active trading market for an ETF’s shares may not develop or be maintained;
- The value of an ETF may be more volatile than the underlying portfolio of securities the ETF is designed to track;
- The cost of owning shares of the ETF may exceed those a client would incur by directly investing in the underlying securities; and
- Trading of an ETF’s shares may be halted if the listing exchange’s officials deem it appropriate, the shares are delisted from the exchange, or the activation of market-wide “circuit breakers” (which are tied to large decreases in stock prices) halts stock trading generally.
Grader Disclosures: Investment in equity strategies involves substantial risk and has the potential for partial or complete loss of funds invested. The sample portfolio and any accompanying charts are for informational purposes only and are not to be construed as a solicitation to buy or sell any financial instrument and should not be relied upon as the sole factor in an investment making decision. As a matter of normal and important disclosures to you, as a potential investor, please consider the following: The performance presented is not based on any actual securities trading, portfolio, or accounts, and the reported performance of the A, B, C, D, and F portfolios (collectively the “model portfolios”) should be considered mere “paper” or pro forma performance results based on Navellier’s research.
Investors evaluating any of Navellier & Associates, Inc.’s, (or its affiliates’) Investment Products must not use any information presented here, including the performance figures of the model portfolios, in their evaluation of any Navellier Investment Products. Navellier Investment Products include the firm’s mutual funds and managed accounts. The model portfolios, charts, and other information presented do not represent actual funded trades and are not actual funded portfolios. There are material differences between Navellier Investment Products’ portfolios and the model portfolios, research, and performance figures presented here. The model portfolios and the research results (1) may contain stocks or ETFs that are illiquid and difficult to trade; (2) may contain stock or ETF holdings materially different from actual funded Navellier Investment Product portfolios; (3) include the reinvestment of all dividends and other earnings, estimated trading costs, commissions, or management fees; and, (4) may not reflect prices obtained in an actual funded Navellier Investment Product portfolio. For these and other reasons, the reported performances of model portfolios do not reflect the performance results of Navellier’s actually funded and traded Investment Products. In most cases, Navellier’s Investment Products have materially lower performance results than the performances of the model portfolios presented.
This report contains statements that are, or may be considered to be, forward-looking statements. All statements that are not historical facts, including statements about our beliefs or expectations, are “forward-looking statements” within the meaning of The U.S. Private Securities Litigation Reform Act of 1995. These statements may be identified by such forward-looking terminology as “expect,” “estimate,” “plan,” “intend,” “believe,” “anticipate,” “may,” “will,” “should,” “could,” “continue,” “project,” or similar statements or variations of such terms. Our forward-looking statements are based on a series of expectations, assumptions, and projections, are not guarantees of future results or performance, and involve substantial risks and uncertainty as described in Form ADV Part 2A of our filing with the Securities and Exchange Commission (SEC), which is available at www.adviserinfo.sec.gov or by requesting a copy by emailing info@navellier.com. All of our forward-looking statements are as of the date of this report only. We can give no assurance that such expectations or forward-looking statements will prove to be correct. Actual results may differ materially. You are urged to carefully consider all such factors.
FEDERAL TAX ADVICE DISCLAIMER: As required by U.S. Treasury Regulations, you are informed that, to the extent this presentation includes any federal tax advice, the presentation is not written by Navellier to be used, and cannot be used, for the purpose of avoiding federal tax penalties. Navellier does not advise on any income tax requirements or issues. Use of any information presented by Navellier is for general information only and does not represent tax advice either express or implied. You are encouraged to seek professional tax advice for income tax questions and assistance.
IMPORTANT NEWSLETTER DISCLOSURE:The hypothetical performance results for investment newsletters that are authored or edited by Louis Navellier, including Louis Navellier’s Growth Investor, Louis Navellier’s Breakthrough Stocks, Louis Navellier’s Accelerated Profits, and Louis Navellier’s Platinum Club, are not based on any actual securities trading, portfolio, or accounts, and the newsletters’ reported hypothetical performances should be considered mere “paper” or proforma hypothetical performance results and are not actual performance of real world trades. Navellier & Associates, Inc. does not have any relation to or affiliation with the owner of these newsletters. There are material differences between Navellier Investment Products’ portfolios and the InvestorPlace Media, LLC newsletter portfolios authored by Louis Navellier. The InvestorPlace Media, LLC newsletters contain hypothetical performance that do not include transaction costs, advisory fees, or other fees a client might incur if actual investments and trades were being made by an investor. As a result, newsletter performance should not be used to evaluate Navellier Investment services which are separate and different from the newsletters. The owner of the newsletters is InvestorPlace Media, LLC and any questions concerning the newsletters, including any newsletter advertising or hypothetical Newsletter performance claims, (which are calculated solely by Investor Place Media and not Navellier) should be referred to InvestorPlace Media, LLC at (800) 718-8289.
Please note that Navellier & Associates and the Navellier Private Client Group are managed completely independent of the newsletters owned and published by InvestorPlace Media, LLC and written and edited by Louis Navellier, and investment performance of the newsletters should in no way be considered indicative of potential future investment performance for any Navellier & Associates separately managed account portfolio. Potential investors should consult with their financial advisor before investing in any Navellier Investment Product.
Navellier claims compliance with Global Investment Performance Standards (GIPS). To receive a complete list and descriptions of Navellier’s composites and/or a presentation that adheres to the GIPS standards, please contact Navellier or click here. It should not be assumed that any securities recommendations made by Navellier & Associates, Inc. in the future will be profitable or equal the performance of securities made in this report.
FactSet Disclosure: Navellier does not independently calculate the statistical information included in the attached report. The calculation and the information are provided by FactSet, a company not related to Navellier. Although information contained in the report has been obtained from FactSet and is based on sources Navellier believes to be reliable, Navellier does not guarantee its accuracy, and it may be incomplete or condensed. The report and the related FactSet sourced information are provided on an “as is” basis. The user assumes the entire risk of any use made of this information. Investors should consider the report as only a single factor in making their investment decision. The report is for informational purposes only and is not intended as an offer or solicitation for the purchase or sale of a security. FactSet sourced information is the exclusive property of FactSet. Without prior written permission of FactSet, this information may not be reproduced, disseminated or used to create any financial products. All indices are unmanaged and performance of the indices include reinvestment of dividends and interest income, unless otherwise noted, are not illustrative of any particular investment and an investment cannot be made in any index. Past performance is no guarantee of future results.