by Bryan Perry
July 4, 2023
Having been led by the “Magnificent Seven” mega-cap tech stocks, the stock market is starting to exhibit some healthier signs of broadening out. The S&P 500 posted a 6.5% gain for June, boosted by a number of bullish economic reports. The third revision of first-quarter GDP came in at +2.0% versus a previous 1.3%, while consumer confidence for June registered 109.7 versus an upwardly revised 102.5 for May, and we also saw the lowest weekly jobless claims in a month – all positive news for the economy.
So much for the Fed’s wish for widespread layoffs. Working Americans are spending with confidence once again. The S&P is now ahead by nearly 16% at the midpoint of 2023. Wall Street’s most vocal bears – like Mike Wilson of Morgan Stanley and Michael Hartnett of Bank of America – are still calling for a big sell -sometime over the next few months, but their thesis of a major collapse in S&P earnings just doesn’t seem to be materializing, as many of key or lagging sectors are getting their footing back.
In yet another catalyst for the bulls, the Federal Reserve reported that 23 of the country’s largest banks passed their annual stress test of lender strength in the face of a hypothetical economic recession.
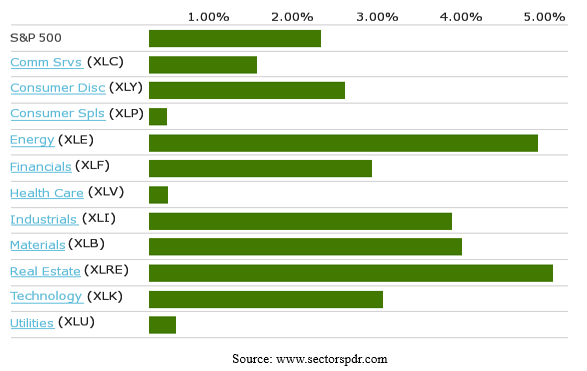
For the first time that I can remember in this calendar year, all the S&P 500’s sectors rose last week. Even the real estate and utility sectors gained in the face of Powell (and the bond market) seeming to be pretty convinced that another quarter point rate hike at the July 26 FOMC meeting is in the offing.
Real Estate and energy stocks actually led all 11 market S&P sectors last week, up 5% each.
Graphs are for illustrative and discussion purposes only. Please read important disclosures at the end of this commentary.
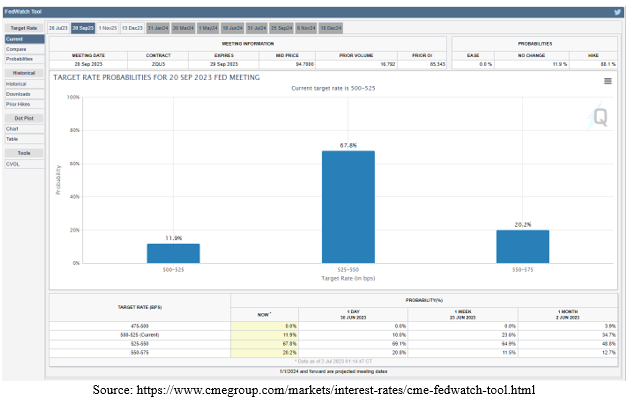
This week, investors will receive some key economic data points, including June manufacturing, June ADP private-sector employment, weekly jobless claims and the June employment report. Given the robust data of late, the bond futures market is pricing in a quarter point rate hike in Fed Funds to 5.25%-5.50%. As of June 30, the Atlanta FedWatch Tool shows an 86.8% of this taking place vs. only a 20.2% chance of another rate hike in September – which will surely swing higher if this week’s data come in “hot.”
Graphs are for illustrative and discussion purposes only. Please read important disclosures at the end of this commentary.
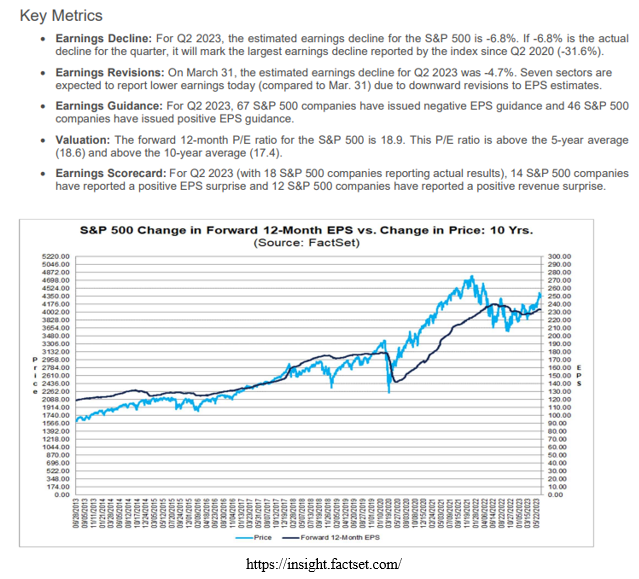
Come next week, second-quarter earnings season gets into full swing, with estimates wide-ranging. Below is the June 30 table of key metrics from FactSet Earnings Insight that show the current consensus estimate of 2023 S&P 500 earnings to be around $221, a far cry from the $185 level that the bearish Mike Wilson is predicting. It would take an earnings apocalypse in the second and third quarters to see this big a miss.
Graphs are for illustrative and discussion purposes only. Please read important disclosures at the end of this commentary.
To put it simply, for the bears to prove their case, there is a lot riding on this earnings season.
Where the bears can run into trouble is if the FOMO (Fear of Missing Out) psychology starts to take hold on the notion – fear that a once certain recession is not in the cards. There is a mountain of cash in money markets and short-term Treasuries that could start to find its way into equities if 5% yields don’t satisfy.
As of last week, the Investment Company Institute reported that total money market fund assets decreased by $2.89 billion to $5.43 trillion for the week ending Wednesday, June 28. Among taxable money market funds, government funds decreased by $2.77 billion and prime funds decreased by $1.16 billion. Tax-exempt money market funds increased by $1.04 billion. ( Source: ici.org/research/stats/mmf)
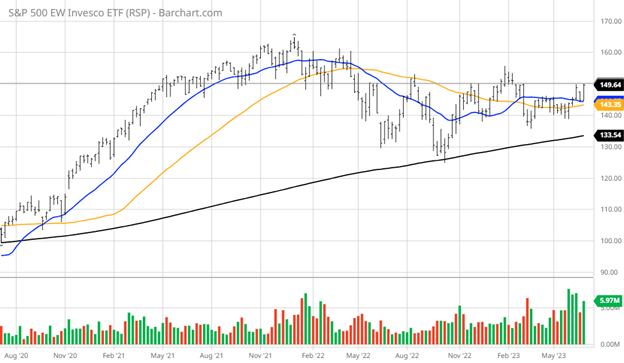
The Invesco S&P 500 Equal Weight ETF (RSP) outperformed the SPDR S&P 500 ETF (SPY) last week as the advance/decline line improved with more sectors getting a bullish lift. A break above $150 might well usher in a dash from cash into stocks. Hard to say for sure, but this rally has caught millions of nervous investors flat-footed, thanks to the most telegraphed recession that has not yet materialized.
Sure, there are big pockets of weakness – like corporate office properties – but heading into earnings season, there just hasn’t been some huge swath of companies issuing dramatically lower guidance that would materially alter the $221 estimate being put out by FactSet.
Graphs are for illustrative and discussion purposes only. Please read important disclosures at the end of this commentary.
For one of the most hated rallies of the past several years, the pressure to get into stocks can sometimes exceed the pressure to stay out. I would think that the phones at bearish equity desks at firms like Morgan Stanley and Bank of America were burning up last week, especially on Friday, as the quarter ended on a powerfully bullish note. The thing about bearish predictions is that they always come true, at some point, but the timing of forecasting a meltdown can be many weeks, months or even years down the road.
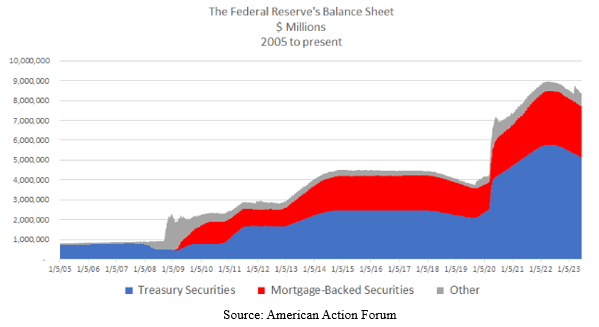
There is still a great deal of cash sloshing around the globe. As of June 14, the Fed’s assets stand at $8.4 trillion. And then there is the rest of the G-8 central banks and their bloated balance sheets. Money goes where it is best served, and with so little action in the IPO space to soak up excess liquidity, there looks to be room for the market to continue its advance and lift most boats, especially well-managed companies.
Graphs are for illustrative and discussion purposes only. Please read important disclosures at the end of this commentary.
All content above represents the opinion of Bryan Perry of Navellier & Associates, Inc.
Also In This Issue
A Look Ahead by Louis Navellier
Putin Faces Growing Chaos at Home
Income Mail by Bryan Perry
Stocks Enter a Nice Glidepath for July
Growth Mail by Gary Alexander
Happy Birthday, America – and Calvin Coolidge
Global Mail by Ivan Martchev
The Yield Curve is as Inverted as It Gets
Sector Spotlight by Jason Bodner
A Simple Formula for Increasing Your Odds for Success
View Full Archive
Read Past Issues Here

Bryan Perry
SENIOR DIRECTOR
Bryan Perry is a Senior Director with Navellier Private Client Group, advising and facilitating high net worth investors in the pursuit of their financial goals.
Bryan’s financial services career spanning the past three decades includes over 20 years of wealth management experience with Wall Street firms that include Bear Stearns, Lehman Brothers and Paine Webber, working with both retail and institutional clients. Bryan earned a B.A. in Political Science from Virginia Polytechnic Institute & State University and currently holds a Series 65 license. All content of “Income Mail” represents the opinion of Bryan Perry
Important Disclosures:
Although information in these reports has been obtained from and is based upon sources that Navellier believes to be reliable, Navellier does not guarantee its accuracy and it may be incomplete or condensed. All opinions and estimates constitute Navellier’s judgment as of the date the report was created and are subject to change without notice. These reports are for informational purposes only and are not a solicitation for the purchase or sale of a security. Any decision to purchase securities mentioned in these reports must take into account existing public information on such securities or any registered prospectus.To the extent permitted by law, neither Navellier & Associates, Inc., nor any of its affiliates, agents, or service providers assumes any liability or responsibility nor owes any duty of care for any consequences of any person acting or refraining to act in reliance on the information contained in this communication or for any decision based on it.
Past performance is no indication of future results. Investment in securities involves significant risk and has the potential for partial or complete loss of funds invested. It should not be assumed that any securities recommendations made by Navellier. in the future will be profitable or equal the performance of securities made in this report. Dividend payments are not guaranteed. The amount of a dividend payment, if any, can vary over time and issuers may reduce dividends paid on securities in the event of a recession or adverse event affecting a specific industry or issuer.
None of the stock information, data, and company information presented herein constitutes a recommendation by Navellier or a solicitation to buy or sell any securities. Any specific securities identified and described do not represent all of the securities purchased, sold, or recommended for advisory clients. The holdings identified do not represent all of the securities purchased, sold, or recommended for advisory clients and the reader should not assume that investments in the securities identified and discussed were or will be profitable.
Information presented is general information that does not take into account your individual circumstances, financial situation, or needs, nor does it present a personalized recommendation to you. Individual stocks presented may not be suitable for every investor. Investment in securities involves significant risk and has the potential for partial or complete loss of funds invested. Investment in fixed income securities has the potential for the investment return and principal value of an investment to fluctuate so that an investor’s holdings, when redeemed, may be worth less than their original cost.
One cannot invest directly in an index. Index is unmanaged and index performance does not reflect deduction of fees, expenses, or taxes. Presentation of Index data does not reflect a belief by Navellier that any stock index constitutes an investment alternative to any Navellier equity strategy or is necessarily comparable to such strategies. Among the most important differences between the Indices and Navellier strategies are that the Navellier equity strategies may (1) incur material management fees, (2) concentrate its investments in relatively few stocks, industries, or sectors, (3) have significantly greater trading activity and related costs, and (4) be significantly more or less volatile than the Indices.
ETF Risk: We may invest in exchange traded funds (“ETFs”) and some of our investment strategies are generally fully invested in ETFs. Like traditional mutual funds, ETFs charge asset-based fees, but they generally do not charge initial sales charges or redemption fees and investors typically pay only customary brokerage fees to buy and sell ETF shares. The fees and costs charged by ETFs held in client accounts will not be deducted from the compensation the client pays Navellier. ETF prices can fluctuate up or down, and a client account could lose money investing in an ETF if the prices of the securities owned by the ETF go down. ETFs are subject to additional risks:
- ETF shares may trade above or below their net asset value;
- An active trading market for an ETF’s shares may not develop or be maintained;
- The value of an ETF may be more volatile than the underlying portfolio of securities the ETF is designed to track;
- The cost of owning shares of the ETF may exceed those a client would incur by directly investing in the underlying securities; and
- Trading of an ETF’s shares may be halted if the listing exchange’s officials deem it appropriate, the shares are delisted from the exchange, or the activation of market-wide “circuit breakers” (which are tied to large decreases in stock prices) halts stock trading generally.
Grader Disclosures: Investment in equity strategies involves substantial risk and has the potential for partial or complete loss of funds invested. The sample portfolio and any accompanying charts are for informational purposes only and are not to be construed as a solicitation to buy or sell any financial instrument and should not be relied upon as the sole factor in an investment making decision. As a matter of normal and important disclosures to you, as a potential investor, please consider the following: The performance presented is not based on any actual securities trading, portfolio, or accounts, and the reported performance of the A, B, C, D, and F portfolios (collectively the “model portfolios”) should be considered mere “paper” or pro forma performance results based on Navellier’s research.
Investors evaluating any of Navellier & Associates, Inc.’s, (or its affiliates’) Investment Products must not use any information presented here, including the performance figures of the model portfolios, in their evaluation of any Navellier Investment Products. Navellier Investment Products include the firm’s mutual funds and managed accounts. The model portfolios, charts, and other information presented do not represent actual funded trades and are not actual funded portfolios. There are material differences between Navellier Investment Products’ portfolios and the model portfolios, research, and performance figures presented here. The model portfolios and the research results (1) may contain stocks or ETFs that are illiquid and difficult to trade; (2) may contain stock or ETF holdings materially different from actual funded Navellier Investment Product portfolios; (3) include the reinvestment of all dividends and other earnings, estimated trading costs, commissions, or management fees; and, (4) may not reflect prices obtained in an actual funded Navellier Investment Product portfolio. For these and other reasons, the reported performances of model portfolios do not reflect the performance results of Navellier’s actually funded and traded Investment Products. In most cases, Navellier’s Investment Products have materially lower performance results than the performances of the model portfolios presented.
This report contains statements that are, or may be considered to be, forward-looking statements. All statements that are not historical facts, including statements about our beliefs or expectations, are “forward-looking statements” within the meaning of The U.S. Private Securities Litigation Reform Act of 1995. These statements may be identified by such forward-looking terminology as “expect,” “estimate,” “plan,” “intend,” “believe,” “anticipate,” “may,” “will,” “should,” “could,” “continue,” “project,” or similar statements or variations of such terms. Our forward-looking statements are based on a series of expectations, assumptions, and projections, are not guarantees of future results or performance, and involve substantial risks and uncertainty as described in Form ADV Part 2A of our filing with the Securities and Exchange Commission (SEC), which is available at www.adviserinfo.sec.gov or by requesting a copy by emailing info@navellier.com. All of our forward-looking statements are as of the date of this report only. We can give no assurance that such expectations or forward-looking statements will prove to be correct. Actual results may differ materially. You are urged to carefully consider all such factors.
FEDERAL TAX ADVICE DISCLAIMER: As required by U.S. Treasury Regulations, you are informed that, to the extent this presentation includes any federal tax advice, the presentation is not written by Navellier to be used, and cannot be used, for the purpose of avoiding federal tax penalties. Navellier does not advise on any income tax requirements or issues. Use of any information presented by Navellier is for general information only and does not represent tax advice either express or implied. You are encouraged to seek professional tax advice for income tax questions and assistance.
IMPORTANT NEWSLETTER DISCLOSURE:The hypothetical performance results for investment newsletters that are authored or edited by Louis Navellier, including Louis Navellier’s Growth Investor, Louis Navellier’s Breakthrough Stocks, Louis Navellier’s Accelerated Profits, and Louis Navellier’s Platinum Club, are not based on any actual securities trading, portfolio, or accounts, and the newsletters’ reported hypothetical performances should be considered mere “paper” or proforma hypothetical performance results and are not actual performance of real world trades. Navellier & Associates, Inc. does not have any relation to or affiliation with the owner of these newsletters. There are material differences between Navellier Investment Products’ portfolios and the InvestorPlace Media, LLC newsletter portfolios authored by Louis Navellier. The InvestorPlace Media, LLC newsletters contain hypothetical performance that do not include transaction costs, advisory fees, or other fees a client might incur if actual investments and trades were being made by an investor. As a result, newsletter performance should not be used to evaluate Navellier Investment services which are separate and different from the newsletters. The owner of the newsletters is InvestorPlace Media, LLC and any questions concerning the newsletters, including any newsletter advertising or hypothetical Newsletter performance claims, (which are calculated solely by Investor Place Media and not Navellier) should be referred to InvestorPlace Media, LLC at (800) 718-8289.
Please note that Navellier & Associates and the Navellier Private Client Group are managed completely independent of the newsletters owned and published by InvestorPlace Media, LLC and written and edited by Louis Navellier, and investment performance of the newsletters should in no way be considered indicative of potential future investment performance for any Navellier & Associates separately managed account portfolio. Potential investors should consult with their financial advisor before investing in any Navellier Investment Product.
Navellier claims compliance with Global Investment Performance Standards (GIPS). To receive a complete list and descriptions of Navellier’s composites and/or a presentation that adheres to the GIPS standards, please contact Navellier or click here. It should not be assumed that any securities recommendations made by Navellier & Associates, Inc. in the future will be profitable or equal the performance of securities made in this report.
FactSet Disclosure: Navellier does not independently calculate the statistical information included in the attached report. The calculation and the information are provided by FactSet, a company not related to Navellier. Although information contained in the report has been obtained from FactSet and is based on sources Navellier believes to be reliable, Navellier does not guarantee its accuracy, and it may be incomplete or condensed. The report and the related FactSet sourced information are provided on an “as is” basis. The user assumes the entire risk of any use made of this information. Investors should consider the report as only a single factor in making their investment decision. The report is for informational purposes only and is not intended as an offer or solicitation for the purchase or sale of a security. FactSet sourced information is the exclusive property of FactSet. Without prior written permission of FactSet, this information may not be reproduced, disseminated or used to create any financial products. All indices are unmanaged and performance of the indices include reinvestment of dividends and interest income, unless otherwise noted, are not illustrative of any particular investment and an investment cannot be made in any index. Past performance is no guarantee of future results.