by Jason Bodner
July 4, 2023
Fireworks, friends, cookouts, and emergency room visits… sounds like the stuff of July 4th weekends!
Yes, you have a higher chance of going to the hospital on Independence Day. According to some sources, you have an even higher chance of losing a digit or limb if you happen to be in Florida for said day.
Perhaps neither should come as a huge surprise. Mixing alcohol and explosives… what could go wrong?
That statistic is a bit like saying: “Hey, you have a higher chance of dying in a car crash if you’re in a car, and even more of a chance if one driver is drunk.”
Here’s the thing about speaking statistically: some statistics are obvious. Fireworks and injuries shouldn’t shock anyone. But sometimes numbers aren’t obvious… for instance you have a remarkably high chance of dying on July 4th if you’re a President. Thomas Jefferson and John Adams died on the fourth of July, exactly 50 years after the Declaration was signed, in 1826 vs. 1776. Most people have heard about that, but did you know that another President died exactly five years later. Our fifth President, James Monroe, died on July 4th 1831, so that’s three of our first five Presidents dying on July 4th. And America’s first great songwriter was born the same day Jefferson and Adams died, on July 4th, 1826. It gets crazy.
Those are coincidences with small data sets, but if you have millions of samples, probability becomes much more reliable (to the extent that it can be) when you have meaningful outcome from a big data set.
The reason I love the stock market is because it is a massive data set. This is why you read so much about “quant funds” and “algo traders.” They love big data, and stocks give us tons of data!
Today I’m going to focus on how to pick great stocks using stats and probabilities. It’s a holiday weekend and the market will be quiet, so it’s a perfect time to learn an essential lesson… if not the essential lesson.
First, it’s time for another stat: the best-performing 4% of listed companies provide the net gain for the entire U.S. stock market since 1926, as all other stocks collectively matched Treasury bills. This is from the summary of a paper written by Hendrik Bessembinder entitled: Do Stocks Outperform Treasury Bills?
Out of 26,000+ stocks studied from 1926 – 2018 (when the paper was written) roughly 1,000 stocks accounted for 100% of the gains of stocks above treasuries. It looks like this:
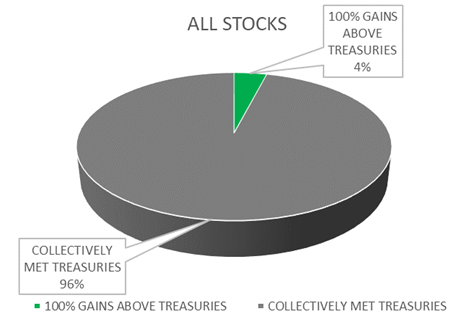
Graphs are for illustrative and discussion purposes only. Please read important disclosures at the end of this commentary.
Perhaps even more fascinating is that he found 1% of stocks accounted for 50% of the market gains above Treasuries! What if I told you picking stocks is as simple as an equation. The formula is:
Superior Fundamentals + Strong Technicals + Big Institutional Support = The Best Stocks
I know what you’re thinking: “That formula seems a bit vague.” Show me the numbers!
That’s true. Each ingredient has levels of depth and some numbers attached.
For instance, when it comes to Superior Fundamentals, generally, I like businesses that have:
- Double digit percentages of 1- and 3-year sales and earnings growth
- Below 25% debt/equity ratio
- Double digit % profit margin
When it comes to Strong Technicals, generally, I like businesses that:
- Trade near 52-week highs
- Trade near interim highs
- Are in a leading sector and/or leads their sector.
When it comes to big institutional support, generally, I like companies that:
- Exhibit unusual institutional buy signals.
- Rank on our Top 20 report.
- Ideally is an established Outlier – repeatedly on the Top 20.
More or less, the above is how our system whittles down 6,000 stocks to 1400 under consideration, and then finally down to 20 powerhouse candidates each week. That’s 20 out of 1,400, or 1.4%.
Honestly, it’s as simple as that. Of course, the tough part is grabbing and analyzing all that data. In order to identify the 20 best stocks a week, one must start with all stocks – I start with 6,000. Then we apply the relevant algorithms (formulas) to rank them. Then we look for unusual buying and selling. When the best ranked stocks are getting bought up in a big way, that’s the ideal pool from which to select the top stocks.
Checking in on the overall market is usually my starting point. The Big Money Index (BMI) gives us a great idea about overall money flows. After a soft previous week, the BMI is once again on the rise:
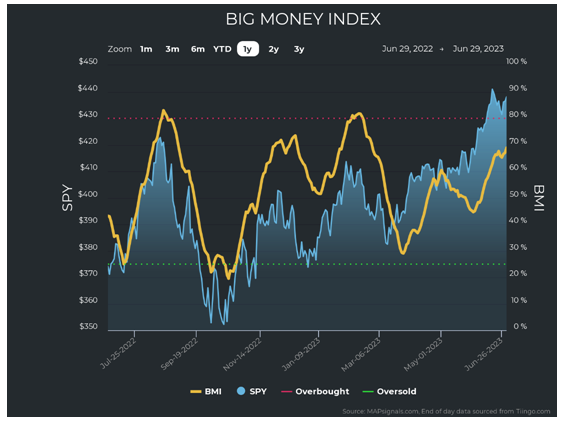
Graphs are for illustrative and discussion purposes only. Please read important disclosures at the end of this commentary.
This is due to not only buying strengthening, but also selling waning. In the chart below, notice the green staying strong while the red shrinks:
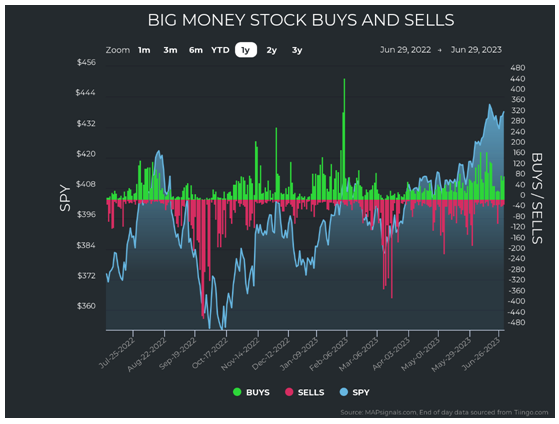
Graphs are for illustrative and discussion purposes only. Please read important disclosures at the end of this commentary.
It’s important to know where that buying is taking place. Looking at last week, we can see that small and mid-caps are being snatched up:
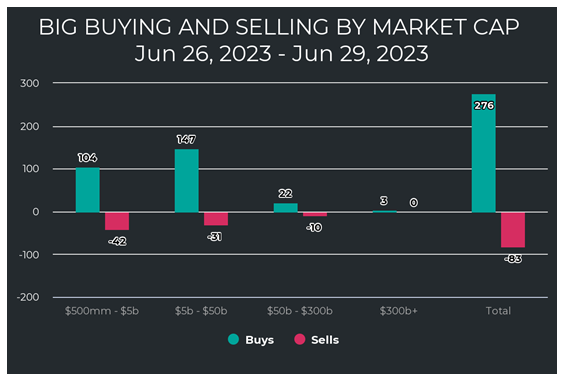
Graphs are for illustrative and discussion purposes only. Please read important disclosures at the end of this commentary.
Lastly, we can see what sectors are getting bought as well. Looking below, we see growth areas like Industrials, Discretionary, Tech, and Health Care are bid. Together these four sectors account for 65% of all buys over the last week (excluding Friday):
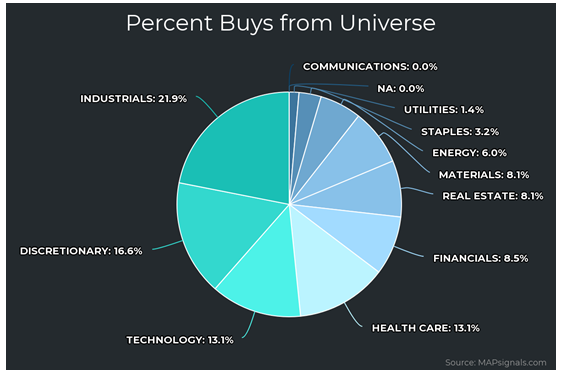
Graphs are for illustrative and discussion purposes only. Please read important disclosures at the end of this commentary.
The market’s temperature is warm, despite the bearish rhetoric in the media and some dire outlooks, so either the stock market is stupid and ignoring the dangers, or it’s smart and knows something that others don’t. The market is a forward-looking pricing machine – usually looking six months or more ahead – so if a hard recession on the horizon for 2023, we would see it reflected in the buying habits of big investors, but right now, they are clearly buying growth, so we should apply the formula above to identify the best stocks to be in. If we do, we will have a statistically higher likelihood of making money from stocks.
It turns out it might be as easy to win with stocks as it is to send yourself into the hospital on the 4th of July by getting to close the fireworks. When it comes to stocks, acquiring these skills will stack the odds in your favor. And as Scott Adams said: “Every skill you acquire doubles your odds of success.”
All content above represents the opinion of Jason Bodner of Navellier & Associates, Inc.
Also In This Issue
A Look Ahead by Louis Navellier
Putin Faces Growing Chaos at Home
Income Mail by Bryan Perry
Stocks Enter a Nice Glidepath for July
Growth Mail by Gary Alexander
Happy Birthday, America – and Calvin Coolidge
Global Mail by Ivan Martchev
The Yield Curve is as Inverted as It Gets
Sector Spotlight by Jason Bodner
A Simple Formula for Increasing Your Odds for Success
View Full Archive
Read Past Issues Here

Jason Bodner
MARKETMAIL EDITOR FOR SECTOR SPOTLIGHT
Jason Bodner writes Sector Spotlight in the weekly Marketmail publication and has authored several white papers for the company. He is also Co-Founder of Macro Analytics for Professionals which produces proprietary equity accumulation/distribution research for its clients. Previously, Mr. Bodner served as Director of European Equity Derivatives for Cantor Fitzgerald Europe in London, then moved to the role of Head of Equity Derivatives North America for the same company in New York. He also served as S.V.P. Equity Derivatives for Jefferies, LLC. He received a B.S. in business administration in 1996, with honors, from Skidmore College as a member of the Periclean Honors Society. All content of “Sector Spotlight” represents the opinion of Jason Bodner
Important Disclosures:
Jason Bodner is a co-founder and co-owner of Mapsignals. Mr. Bodner is an independent contractor who is occasionally hired by Navellier & Associates to write an article and or provide opinions for possible use in articles that appear in Navellier & Associates weekly Market Mail. Mr. Bodner is not employed or affiliated with Louis Navellier, Navellier & Associates, Inc., or any other Navellier owned entity. The opinions and statements made here are those of Mr. Bodner and not necessarily those of any other persons or entities. This is not an endorsement, or solicitation or testimonial or investment advice regarding the BMI Index or any statements or recommendations or analysis in the article or the BMI Index or Mapsignals or its products or strategies.
Although information in these reports has been obtained from and is based upon sources that Navellier believes to be reliable, Navellier does not guarantee its accuracy and it may be incomplete or condensed. All opinions and estimates constitute Navellier’s judgment as of the date the report was created and are subject to change without notice. These reports are for informational purposes only and are not a solicitation for the purchase or sale of a security. Any decision to purchase securities mentioned in these reports must take into account existing public information on such securities or any registered prospectus.To the extent permitted by law, neither Navellier & Associates, Inc., nor any of its affiliates, agents, or service providers assumes any liability or responsibility nor owes any duty of care for any consequences of any person acting or refraining to act in reliance on the information contained in this communication or for any decision based on it.
Past performance is no indication of future results. Investment in securities involves significant risk and has the potential for partial or complete loss of funds invested. It should not be assumed that any securities recommendations made by Navellier. in the future will be profitable or equal the performance of securities made in this report. Dividend payments are not guaranteed. The amount of a dividend payment, if any, can vary over time and issuers may reduce dividends paid on securities in the event of a recession or adverse event affecting a specific industry or issuer.
None of the stock information, data, and company information presented herein constitutes a recommendation by Navellier or a solicitation to buy or sell any securities. Any specific securities identified and described do not represent all of the securities purchased, sold, or recommended for advisory clients. The holdings identified do not represent all of the securities purchased, sold, or recommended for advisory clients and the reader should not assume that investments in the securities identified and discussed were or will be profitable.
Information presented is general information that does not take into account your individual circumstances, financial situation, or needs, nor does it present a personalized recommendation to you. Individual stocks presented may not be suitable for every investor. Investment in securities involves significant risk and has the potential for partial or complete loss of funds invested. Investment in fixed income securities has the potential for the investment return and principal value of an investment to fluctuate so that an investor’s holdings, when redeemed, may be worth less than their original cost.
One cannot invest directly in an index. Index is unmanaged and index performance does not reflect deduction of fees, expenses, or taxes. Presentation of Index data does not reflect a belief by Navellier that any stock index constitutes an investment alternative to any Navellier equity strategy or is necessarily comparable to such strategies. Among the most important differences between the Indices and Navellier strategies are that the Navellier equity strategies may (1) incur material management fees, (2) concentrate its investments in relatively few stocks, industries, or sectors, (3) have significantly greater trading activity and related costs, and (4) be significantly more or less volatile than the Indices.
ETF Risk: We may invest in exchange traded funds (“ETFs”) and some of our investment strategies are generally fully invested in ETFs. Like traditional mutual funds, ETFs charge asset-based fees, but they generally do not charge initial sales charges or redemption fees and investors typically pay only customary brokerage fees to buy and sell ETF shares. The fees and costs charged by ETFs held in client accounts will not be deducted from the compensation the client pays Navellier. ETF prices can fluctuate up or down, and a client account could lose money investing in an ETF if the prices of the securities owned by the ETF go down. ETFs are subject to additional risks:
- ETF shares may trade above or below their net asset value;
- An active trading market for an ETF’s shares may not develop or be maintained;
- The value of an ETF may be more volatile than the underlying portfolio of securities the ETF is designed to track;
- The cost of owning shares of the ETF may exceed those a client would incur by directly investing in the underlying securities; and
- Trading of an ETF’s shares may be halted if the listing exchange’s officials deem it appropriate, the shares are delisted from the exchange, or the activation of market-wide “circuit breakers” (which are tied to large decreases in stock prices) halts stock trading generally.
Grader Disclosures: Investment in equity strategies involves substantial risk and has the potential for partial or complete loss of funds invested. The sample portfolio and any accompanying charts are for informational purposes only and are not to be construed as a solicitation to buy or sell any financial instrument and should not be relied upon as the sole factor in an investment making decision. As a matter of normal and important disclosures to you, as a potential investor, please consider the following: The performance presented is not based on any actual securities trading, portfolio, or accounts, and the reported performance of the A, B, C, D, and F portfolios (collectively the “model portfolios”) should be considered mere “paper” or pro forma performance results based on Navellier’s research.
Investors evaluating any of Navellier & Associates, Inc.’s, (or its affiliates’) Investment Products must not use any information presented here, including the performance figures of the model portfolios, in their evaluation of any Navellier Investment Products. Navellier Investment Products include the firm’s mutual funds and managed accounts. The model portfolios, charts, and other information presented do not represent actual funded trades and are not actual funded portfolios. There are material differences between Navellier Investment Products’ portfolios and the model portfolios, research, and performance figures presented here. The model portfolios and the research results (1) may contain stocks or ETFs that are illiquid and difficult to trade; (2) may contain stock or ETF holdings materially different from actual funded Navellier Investment Product portfolios; (3) include the reinvestment of all dividends and other earnings, estimated trading costs, commissions, or management fees; and, (4) may not reflect prices obtained in an actual funded Navellier Investment Product portfolio. For these and other reasons, the reported performances of model portfolios do not reflect the performance results of Navellier’s actually funded and traded Investment Products. In most cases, Navellier’s Investment Products have materially lower performance results than the performances of the model portfolios presented.
This report contains statements that are, or may be considered to be, forward-looking statements. All statements that are not historical facts, including statements about our beliefs or expectations, are “forward-looking statements” within the meaning of The U.S. Private Securities Litigation Reform Act of 1995. These statements may be identified by such forward-looking terminology as “expect,” “estimate,” “plan,” “intend,” “believe,” “anticipate,” “may,” “will,” “should,” “could,” “continue,” “project,” or similar statements or variations of such terms. Our forward-looking statements are based on a series of expectations, assumptions, and projections, are not guarantees of future results or performance, and involve substantial risks and uncertainty as described in Form ADV Part 2A of our filing with the Securities and Exchange Commission (SEC), which is available at www.adviserinfo.sec.gov or by requesting a copy by emailing info@navellier.com. All of our forward-looking statements are as of the date of this report only. We can give no assurance that such expectations or forward-looking statements will prove to be correct. Actual results may differ materially. You are urged to carefully consider all such factors.
FEDERAL TAX ADVICE DISCLAIMER: As required by U.S. Treasury Regulations, you are informed that, to the extent this presentation includes any federal tax advice, the presentation is not written by Navellier to be used, and cannot be used, for the purpose of avoiding federal tax penalties. Navellier does not advise on any income tax requirements or issues. Use of any information presented by Navellier is for general information only and does not represent tax advice either express or implied. You are encouraged to seek professional tax advice for income tax questions and assistance.
IMPORTANT NEWSLETTER DISCLOSURE:The hypothetical performance results for investment newsletters that are authored or edited by Louis Navellier, including Louis Navellier’s Growth Investor, Louis Navellier’s Breakthrough Stocks, Louis Navellier’s Accelerated Profits, and Louis Navellier’s Platinum Club, are not based on any actual securities trading, portfolio, or accounts, and the newsletters’ reported hypothetical performances should be considered mere “paper” or proforma hypothetical performance results and are not actual performance of real world trades. Navellier & Associates, Inc. does not have any relation to or affiliation with the owner of these newsletters. There are material differences between Navellier Investment Products’ portfolios and the InvestorPlace Media, LLC newsletter portfolios authored by Louis Navellier. The InvestorPlace Media, LLC newsletters contain hypothetical performance that do not include transaction costs, advisory fees, or other fees a client might incur if actual investments and trades were being made by an investor. As a result, newsletter performance should not be used to evaluate Navellier Investment services which are separate and different from the newsletters. The owner of the newsletters is InvestorPlace Media, LLC and any questions concerning the newsletters, including any newsletter advertising or hypothetical Newsletter performance claims, (which are calculated solely by Investor Place Media and not Navellier) should be referred to InvestorPlace Media, LLC at (800) 718-8289.
Please note that Navellier & Associates and the Navellier Private Client Group are managed completely independent of the newsletters owned and published by InvestorPlace Media, LLC and written and edited by Louis Navellier, and investment performance of the newsletters should in no way be considered indicative of potential future investment performance for any Navellier & Associates separately managed account portfolio. Potential investors should consult with their financial advisor before investing in any Navellier Investment Product.
Navellier claims compliance with Global Investment Performance Standards (GIPS). To receive a complete list and descriptions of Navellier’s composites and/or a presentation that adheres to the GIPS standards, please contact Navellier or click here. It should not be assumed that any securities recommendations made by Navellier & Associates, Inc. in the future will be profitable or equal the performance of securities made in this report.
FactSet Disclosure: Navellier does not independently calculate the statistical information included in the attached report. The calculation and the information are provided by FactSet, a company not related to Navellier. Although information contained in the report has been obtained from FactSet and is based on sources Navellier believes to be reliable, Navellier does not guarantee its accuracy, and it may be incomplete or condensed. The report and the related FactSet sourced information are provided on an “as is” basis. The user assumes the entire risk of any use made of this information. Investors should consider the report as only a single factor in making their investment decision. The report is for informational purposes only and is not intended as an offer or solicitation for the purchase or sale of a security. FactSet sourced information is the exclusive property of FactSet. Without prior written permission of FactSet, this information may not be reproduced, disseminated or used to create any financial products. All indices are unmanaged and performance of the indices include reinvestment of dividends and interest income, unless otherwise noted, are not illustrative of any particular investment and an investment cannot be made in any index. Past performance is no guarantee of future results.