by Bryan Perry
July 18, 2023
Some want income. Some want growth. How about some of both? The old saying of “having your cake and eating it too” comes to mind when certain stock market assets are not just “in the sweet spot” of what’s working best, but also are structured to deliver phenomenal income streams to investors seeking outsized yields – and I am not talking about junk bonds, or highly-leveraged securities, either.
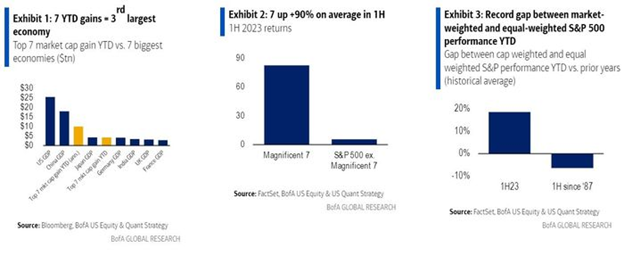
Year-to-date, the stock market has been dominated by the so-called “Magnificent Seven” stocks that include the old “FAANG” names – with the added footnote that Nvidia Inc. (NVDA) has replaced Netflix (NFLX) as the “N” stock, while Microsoft (MSFT) and Tesla (TSLA) have joined Amazon, Apple, Alphabet (formerly Google), and Facebook (Meta). These companies have a combined market value in excess of $11 trillion, with each of them surpassing the performance of the S&P 500 for the year. We’ve seen a massive and concentrated move higher for the Mag-7, driven by the euphoria over all things “AI.”
Graphs are for illustrative and discussion purposes only. Please read important disclosures at the end of this commentary.
To address this narrow and top-heavy phenomenon, it was announced recently that there will be a Nasdaq 100 special rebalancing taking place before the market opens on Monday, July 24, to “address over-concentration in the index by redistributing the weights.” The Nasdaq has only conducted a special rebalance twice in its history: in December 1998 and May 2011. Prior to the rebalance, the top five companies had a weighting of 46.7%, whereas after the rebalance, the weighting will be reduced to 38.5%. This is a meaningful change, but it will likely only slow the pace of the Mag-7’s advance.
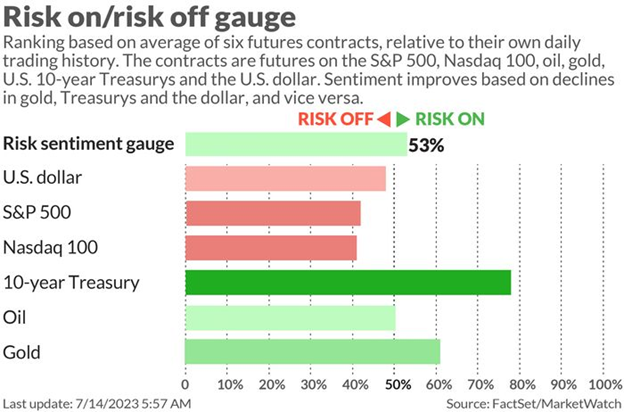
This is happening on the cusp of second-quarter earnings season, with so much price appreciation built into the Nasdaq 100 holdings, so it begs the question of how much these companies need to beat estimates and raise guidance to add to their already-heady 2023 gains. Will this development spark a quantum “sell the news” phase of the rally, as recession fears are pushed out? If one looks at how risk is traded in the futures market (below), we can see some near-term caution heading into the current reporting period.
Graphs are for illustrative and discussion purposes only. Please read important disclosures at the end of this commentary.
For investors who wonder if the torrid advance for these stocks can continue, the next 2-3 weeks will help define an answer to that question – after the numbers and forward guidance are released. As to those in the market with income as their main objective (and yet still want to be in these behemoth tech darlings), there is some good news of how to have cake (capital gains from mighty Nasdaq) and eat it, too (income).
There are a handful of ETFs that own these top names and deploy an active covered-call strategy, where the annual yields are in excess of 10% and the ETFs make monthly payments. It has been about the best source of income generation available during a time when the Fed has been raising rates with bonds and other fixed income assets losing value over the course of the past 18 months as the Fed was hiking rates.
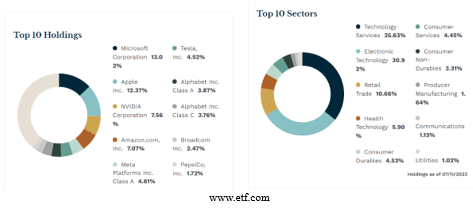
One such ETF is the Global X NASDAQ 100 Covered-Call ETF (QYLD), a fund that owns all the leading names within the top 10 holdings while selling calls on the Invesco QQQ Trust (QQQ) shares. The current distribution yield is a mouth-watering 11.56%. With monthly distributions included, QYLD has returned about 20.6% year-to-date.
Graphs are for illustrative and discussion purposes only. Please read important disclosures at the end of this commentary.
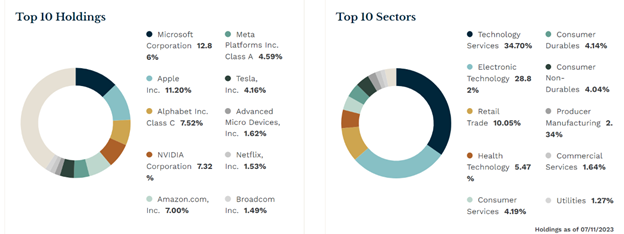
A second ETF of similar make up, but with a better track record is the JPMorgan Nasdaq Equity Premium Income ETF (JEPI). The fund owns many of the same stocks, but also has equity-linked notes within its portfolio and sells one-month out-of-the-money calls on its individual holdings. The current distribution yield is 10.75% and its monthly payout varies. Although the current yield is a tad lower than QYLD, the fund has put up a better total return of about 26% year-to-date including distributions.
Graphs are for illustrative and discussion purposes only. Please read important disclosures at the end of this commentary.
(Bryan Perry does not own any of these top 10 holdings, although he does trade options from time to time.)
Not knowing if the market has seen its best gains for 2023, and with the Fed still making some noises about further tightening, income investors have a clear choice of how to be in the way of further potential market gains while deriving an income stream that, in my view, has all the right ingredients to beat inflation, most dividend paying stocks, and just about everything in the bond and bond equivalent markets.
As with most of the big Nasdaq leaders, shares of JEPQ are a bit overbought, per the chart below, showing where the shares trade relative to their 20-day moving average (blue line).
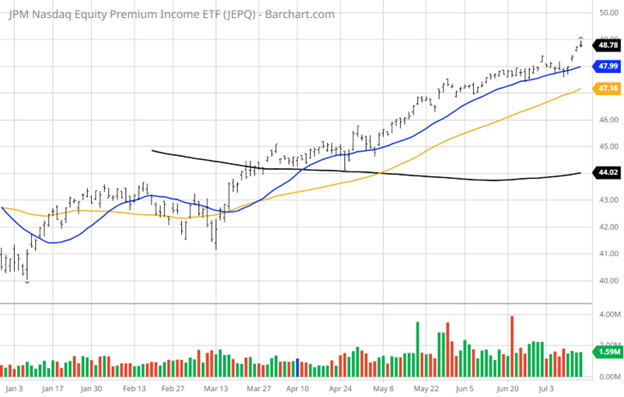
Graphs are for illustrative and discussion purposes only. Please read important disclosures at the end of this commentary.
What’s also nice about these covered-call funds is that they not only take advantage of market volatility by selling in the form of option income received, these strategies also lower share price volatility as well, as option income tends to cushion price fluctuations. Granted, the performance of both QYLD and JEPQ have not put up the same heady returns of the underlying stocks themselves, but they serve a different audience, where cash flow is the number one objective. For many income investors, that’s plenty good.
Navellier & Associates owns Nvidia Corp (NVDA), Apple Computer (AAPL), Microsoft (MSFT), Amazon (AMZN), and a few accounts own Meta Platforms (META), and Tesla (TSLA), per client request in managed accounts. We do not own Alphabet Inc. (GOOG), JP Morgan (JPM), or Netflix Inc (NFLX). Bryan Perry owns Apple Computer (AAPL), Amazon (AMZN) and Microsoft (MSFT) in a personal account. He does not own Netflix Inc (NFLX), Nvidia Corp (NVDA), Tesla (TSLA), Meta Platforms, (META), Alphabet Inc. (GOOG), JP Morgan (JPM), personally.
All content above represents the opinion of Bryan Perry of Navellier & Associates, Inc.
Also In This Issue
A Look Ahead by Louis Navellier
Inflation is Rapidly Cooling – As Predicted – But is the Fed Listening?
Income Mail by Bryan Perry
Potential Double-Digit Income from “The Magnificent Seven” Stocks
Growth Mail by Gary Alexander
Pessimism is Popular, but Optimism is More Profitable
Global Mail by Ivan Martchev
The Stock Market is Acting Tired
Sector Spotlight by Jason Bodner
Patterns in Markets – Both False and Real
View Full Archive
Read Past Issues Here

Bryan Perry
SENIOR DIRECTOR
Bryan Perry is a Senior Director with Navellier Private Client Group, advising and facilitating high net worth investors in the pursuit of their financial goals.
Bryan’s financial services career spanning the past three decades includes over 20 years of wealth management experience with Wall Street firms that include Bear Stearns, Lehman Brothers and Paine Webber, working with both retail and institutional clients. Bryan earned a B.A. in Political Science from Virginia Polytechnic Institute & State University and currently holds a Series 65 license. All content of “Income Mail” represents the opinion of Bryan Perry
Important Disclosures:
Although information in these reports has been obtained from and is based upon sources that Navellier believes to be reliable, Navellier does not guarantee its accuracy and it may be incomplete or condensed. All opinions and estimates constitute Navellier’s judgment as of the date the report was created and are subject to change without notice. These reports are for informational purposes only and are not a solicitation for the purchase or sale of a security. Any decision to purchase securities mentioned in these reports must take into account existing public information on such securities or any registered prospectus.To the extent permitted by law, neither Navellier & Associates, Inc., nor any of its affiliates, agents, or service providers assumes any liability or responsibility nor owes any duty of care for any consequences of any person acting or refraining to act in reliance on the information contained in this communication or for any decision based on it.
Past performance is no indication of future results. Investment in securities involves significant risk and has the potential for partial or complete loss of funds invested. It should not be assumed that any securities recommendations made by Navellier. in the future will be profitable or equal the performance of securities made in this report. Dividend payments are not guaranteed. The amount of a dividend payment, if any, can vary over time and issuers may reduce dividends paid on securities in the event of a recession or adverse event affecting a specific industry or issuer.
None of the stock information, data, and company information presented herein constitutes a recommendation by Navellier or a solicitation to buy or sell any securities. Any specific securities identified and described do not represent all of the securities purchased, sold, or recommended for advisory clients. The holdings identified do not represent all of the securities purchased, sold, or recommended for advisory clients and the reader should not assume that investments in the securities identified and discussed were or will be profitable.
Information presented is general information that does not take into account your individual circumstances, financial situation, or needs, nor does it present a personalized recommendation to you. Individual stocks presented may not be suitable for every investor. Investment in securities involves significant risk and has the potential for partial or complete loss of funds invested. Investment in fixed income securities has the potential for the investment return and principal value of an investment to fluctuate so that an investor’s holdings, when redeemed, may be worth less than their original cost.
One cannot invest directly in an index. Index is unmanaged and index performance does not reflect deduction of fees, expenses, or taxes. Presentation of Index data does not reflect a belief by Navellier that any stock index constitutes an investment alternative to any Navellier equity strategy or is necessarily comparable to such strategies. Among the most important differences between the Indices and Navellier strategies are that the Navellier equity strategies may (1) incur material management fees, (2) concentrate its investments in relatively few stocks, industries, or sectors, (3) have significantly greater trading activity and related costs, and (4) be significantly more or less volatile than the Indices.
ETF Risk: We may invest in exchange traded funds (“ETFs”) and some of our investment strategies are generally fully invested in ETFs. Like traditional mutual funds, ETFs charge asset-based fees, but they generally do not charge initial sales charges or redemption fees and investors typically pay only customary brokerage fees to buy and sell ETF shares. The fees and costs charged by ETFs held in client accounts will not be deducted from the compensation the client pays Navellier. ETF prices can fluctuate up or down, and a client account could lose money investing in an ETF if the prices of the securities owned by the ETF go down. ETFs are subject to additional risks:
- ETF shares may trade above or below their net asset value;
- An active trading market for an ETF’s shares may not develop or be maintained;
- The value of an ETF may be more volatile than the underlying portfolio of securities the ETF is designed to track;
- The cost of owning shares of the ETF may exceed those a client would incur by directly investing in the underlying securities; and
- Trading of an ETF’s shares may be halted if the listing exchange’s officials deem it appropriate, the shares are delisted from the exchange, or the activation of market-wide “circuit breakers” (which are tied to large decreases in stock prices) halts stock trading generally.
Grader Disclosures: Investment in equity strategies involves substantial risk and has the potential for partial or complete loss of funds invested. The sample portfolio and any accompanying charts are for informational purposes only and are not to be construed as a solicitation to buy or sell any financial instrument and should not be relied upon as the sole factor in an investment making decision. As a matter of normal and important disclosures to you, as a potential investor, please consider the following: The performance presented is not based on any actual securities trading, portfolio, or accounts, and the reported performance of the A, B, C, D, and F portfolios (collectively the “model portfolios”) should be considered mere “paper” or pro forma performance results based on Navellier’s research.
Investors evaluating any of Navellier & Associates, Inc.’s, (or its affiliates’) Investment Products must not use any information presented here, including the performance figures of the model portfolios, in their evaluation of any Navellier Investment Products. Navellier Investment Products include the firm’s mutual funds and managed accounts. The model portfolios, charts, and other information presented do not represent actual funded trades and are not actual funded portfolios. There are material differences between Navellier Investment Products’ portfolios and the model portfolios, research, and performance figures presented here. The model portfolios and the research results (1) may contain stocks or ETFs that are illiquid and difficult to trade; (2) may contain stock or ETF holdings materially different from actual funded Navellier Investment Product portfolios; (3) include the reinvestment of all dividends and other earnings, estimated trading costs, commissions, or management fees; and, (4) may not reflect prices obtained in an actual funded Navellier Investment Product portfolio. For these and other reasons, the reported performances of model portfolios do not reflect the performance results of Navellier’s actually funded and traded Investment Products. In most cases, Navellier’s Investment Products have materially lower performance results than the performances of the model portfolios presented.
This report contains statements that are, or may be considered to be, forward-looking statements. All statements that are not historical facts, including statements about our beliefs or expectations, are “forward-looking statements” within the meaning of The U.S. Private Securities Litigation Reform Act of 1995. These statements may be identified by such forward-looking terminology as “expect,” “estimate,” “plan,” “intend,” “believe,” “anticipate,” “may,” “will,” “should,” “could,” “continue,” “project,” or similar statements or variations of such terms. Our forward-looking statements are based on a series of expectations, assumptions, and projections, are not guarantees of future results or performance, and involve substantial risks and uncertainty as described in Form ADV Part 2A of our filing with the Securities and Exchange Commission (SEC), which is available at www.adviserinfo.sec.gov or by requesting a copy by emailing info@navellier.com. All of our forward-looking statements are as of the date of this report only. We can give no assurance that such expectations or forward-looking statements will prove to be correct. Actual results may differ materially. You are urged to carefully consider all such factors.
FEDERAL TAX ADVICE DISCLAIMER: As required by U.S. Treasury Regulations, you are informed that, to the extent this presentation includes any federal tax advice, the presentation is not written by Navellier to be used, and cannot be used, for the purpose of avoiding federal tax penalties. Navellier does not advise on any income tax requirements or issues. Use of any information presented by Navellier is for general information only and does not represent tax advice either express or implied. You are encouraged to seek professional tax advice for income tax questions and assistance.
IMPORTANT NEWSLETTER DISCLOSURE:The hypothetical performance results for investment newsletters that are authored or edited by Louis Navellier, including Louis Navellier’s Growth Investor, Louis Navellier’s Breakthrough Stocks, Louis Navellier’s Accelerated Profits, and Louis Navellier’s Platinum Club, are not based on any actual securities trading, portfolio, or accounts, and the newsletters’ reported hypothetical performances should be considered mere “paper” or proforma hypothetical performance results and are not actual performance of real world trades. Navellier & Associates, Inc. does not have any relation to or affiliation with the owner of these newsletters. There are material differences between Navellier Investment Products’ portfolios and the InvestorPlace Media, LLC newsletter portfolios authored by Louis Navellier. The InvestorPlace Media, LLC newsletters contain hypothetical performance that do not include transaction costs, advisory fees, or other fees a client might incur if actual investments and trades were being made by an investor. As a result, newsletter performance should not be used to evaluate Navellier Investment services which are separate and different from the newsletters. The owner of the newsletters is InvestorPlace Media, LLC and any questions concerning the newsletters, including any newsletter advertising or hypothetical Newsletter performance claims, (which are calculated solely by Investor Place Media and not Navellier) should be referred to InvestorPlace Media, LLC at (800) 718-8289.
Please note that Navellier & Associates and the Navellier Private Client Group are managed completely independent of the newsletters owned and published by InvestorPlace Media, LLC and written and edited by Louis Navellier, and investment performance of the newsletters should in no way be considered indicative of potential future investment performance for any Navellier & Associates separately managed account portfolio. Potential investors should consult with their financial advisor before investing in any Navellier Investment Product.
Navellier claims compliance with Global Investment Performance Standards (GIPS). To receive a complete list and descriptions of Navellier’s composites and/or a presentation that adheres to the GIPS standards, please contact Navellier or click here. It should not be assumed that any securities recommendations made by Navellier & Associates, Inc. in the future will be profitable or equal the performance of securities made in this report.
FactSet Disclosure: Navellier does not independently calculate the statistical information included in the attached report. The calculation and the information are provided by FactSet, a company not related to Navellier. Although information contained in the report has been obtained from FactSet and is based on sources Navellier believes to be reliable, Navellier does not guarantee its accuracy, and it may be incomplete or condensed. The report and the related FactSet sourced information are provided on an “as is” basis. The user assumes the entire risk of any use made of this information. Investors should consider the report as only a single factor in making their investment decision. The report is for informational purposes only and is not intended as an offer or solicitation for the purchase or sale of a security. FactSet sourced information is the exclusive property of FactSet. Without prior written permission of FactSet, this information may not be reproduced, disseminated or used to create any financial products. All indices are unmanaged and performance of the indices include reinvestment of dividends and interest income, unless otherwise noted, are not illustrative of any particular investment and an investment cannot be made in any index. Past performance is no guarantee of future results.