by Jason Bodner
June 2, 2026
In 1620, an English physician named Robert Burton published The Anatomy of Melancholy, a 1,400-page book about depression. One passing observation in it changed economics forever. Burton noted the price of grain in Antwerp rose and fell with the price of grain in London, even though no merchant could know both prices at the same time. He had stumbled onto something the world would not have a word for until the 20th century. Markets reflect a hidden kind of intelligence. They knew things before most people do.
Market prices seem loud, but the real story is quiet, since almost nobody listens to the strongest signals.
Last week’s macro-overhang lifted. The U.S. and China announced a trade truce. NVIDIA reported earnings on Wednesday and confirmed AI demand isn’t slowing, not even slightly. Saudi Arabia’s sovereign wealth fund committed to buying several hundred thousand AI chips through its new Humain venture. The UAE signed on for half a million more. Inflation data slowed. Memorial Day weekend opened with the S&P 500 at a fresh all-time high and the VIX at 15.74, its lowest reading in months.
Three-days saw three different all-time highs, yet on the surface, the flow data looked almost ordinary.
This is the story of the quiet vibe under the market noise:
Last week, the Big Money Index (BMI) cooled slightly to 64%. By itself, that is unremarkable.
The ETF BMI accelerated to 76.6%. By itself, that is also unremarkable, but the gap between them, 12.5 percentage points, places this week in the 95th percentile of historical differentials. It means institutional money is buying themes through ETFs faster than it is buying individual stocks. That distinction is huge.
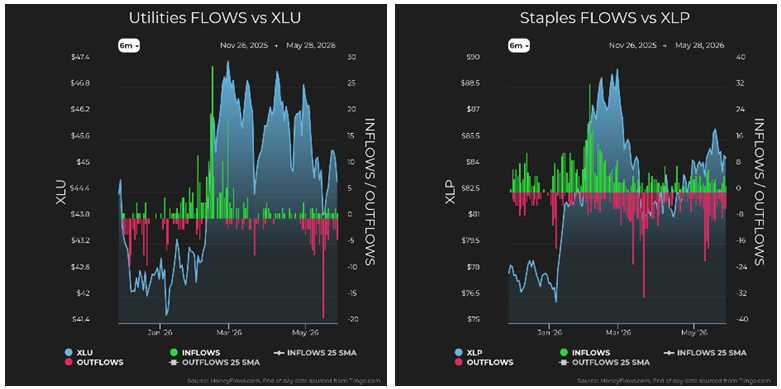
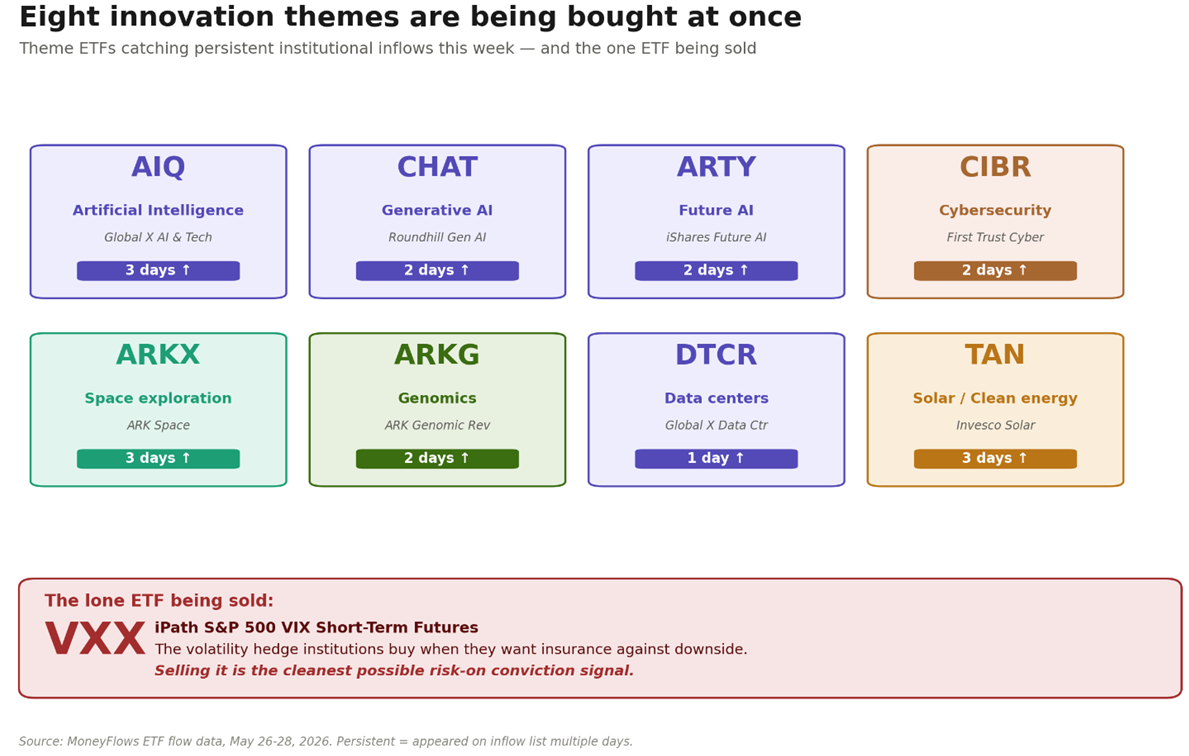
Daily flows were heavily weighted toward buying. Buying was steady, broad, and confident. The VXX, the volatility ETF that institutions use to hedge against draw-downs, was the only ETF outflow last week.
Translation: Investors were actively selling their downside insurance.
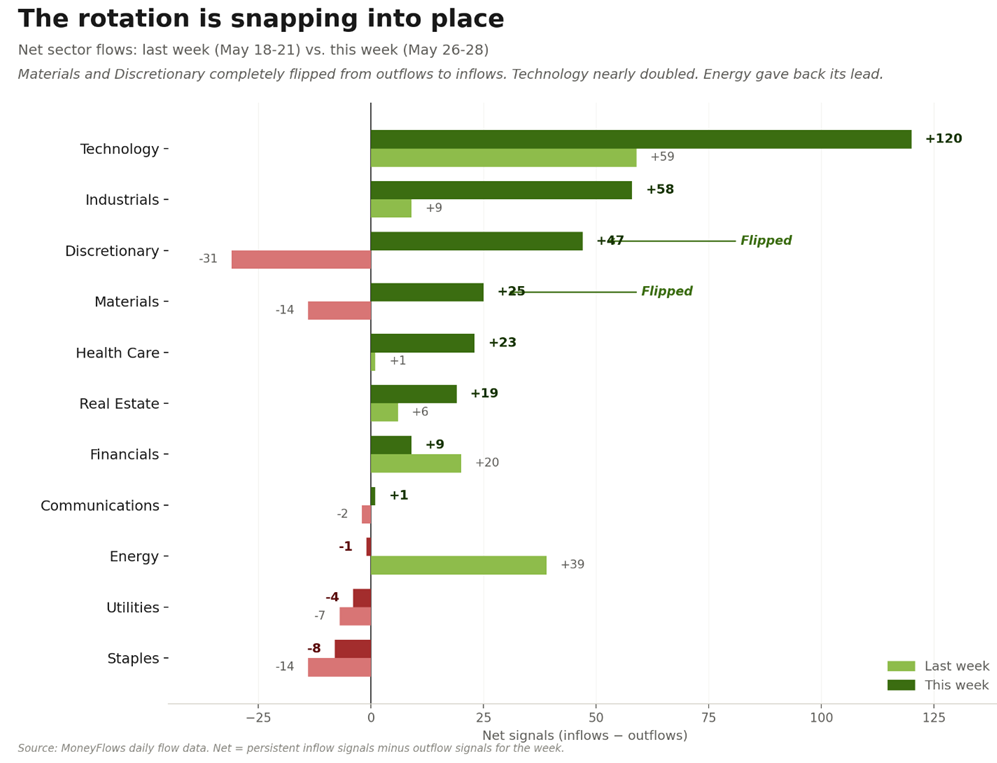
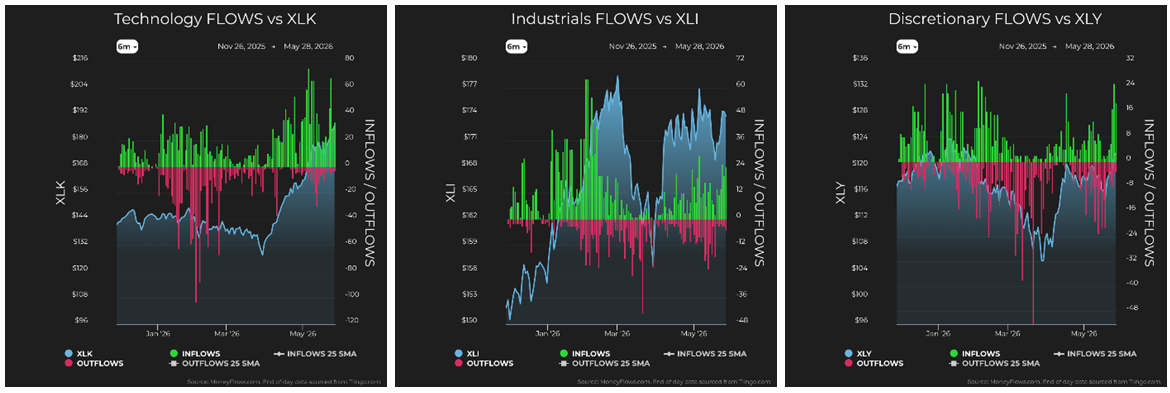
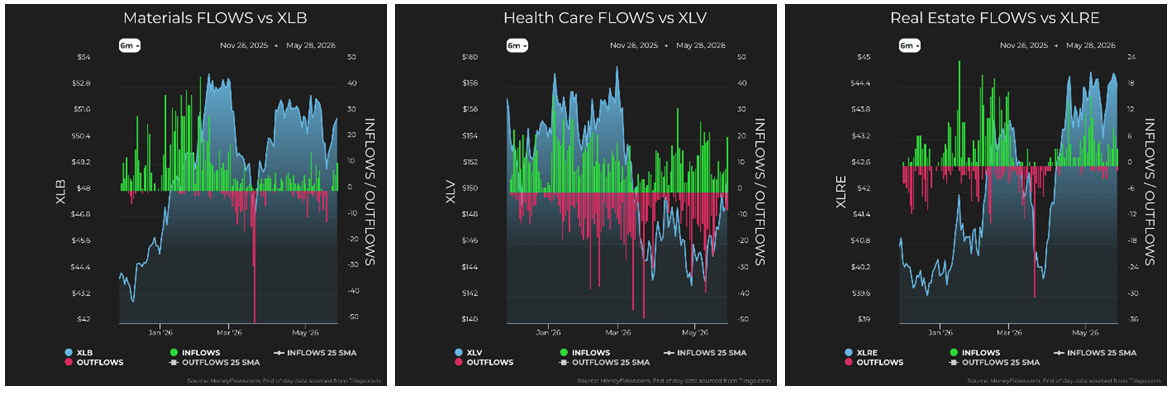
Underneath these indexes, the rotation is striking. Technology posted 132-inflows against just 12-outflows, the most lopsided ratio in weeks. Industrials posted 69 vs. 11. Materials, which last week had zero-inflows and 14-outflows, completely flipped to 25-inflows and zero-outflows. Consumer Discretionary, which had been bleeding for a month, also flipped from 9-inflows to 61, so the market is not just rallying. It is rotating into the trades that work when capital is willing to take real risk again.
Graphs are for illustrative and discussion purposes only. Please read important disclosures at the end of this commentary.
Graphs are for illustrative and discussion purposes only. Please read important disclosures at the end of this commentary.
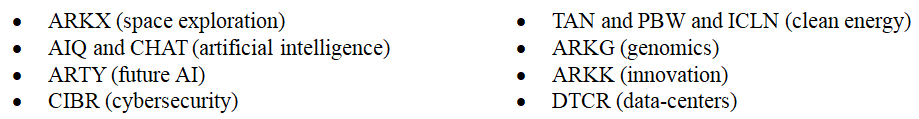
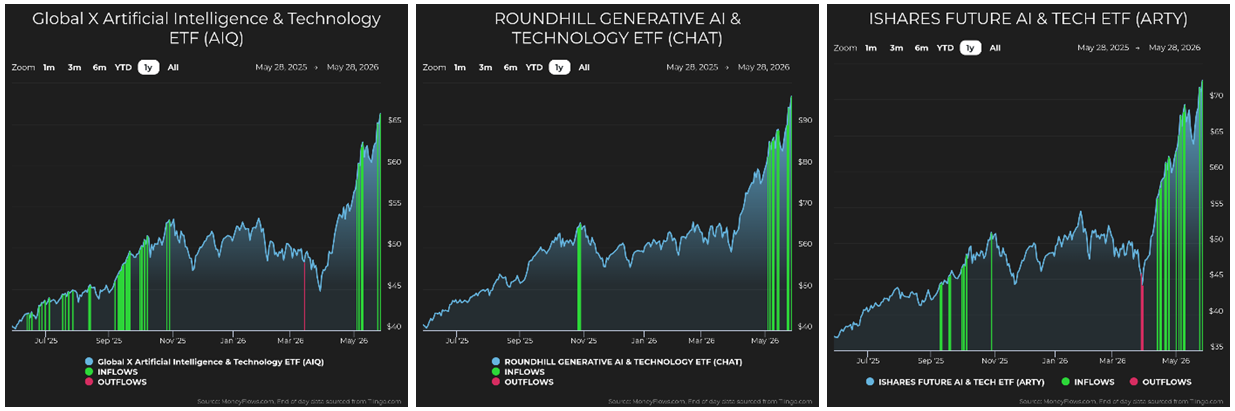
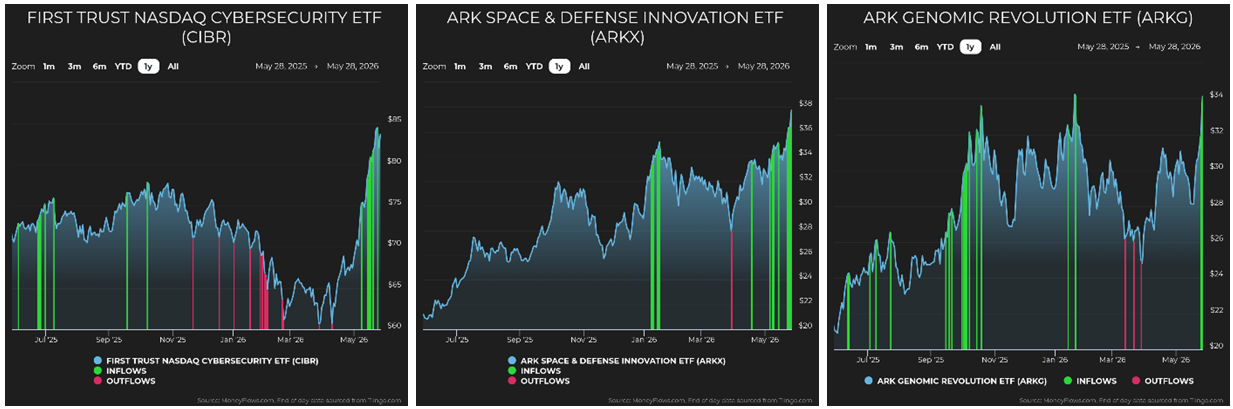
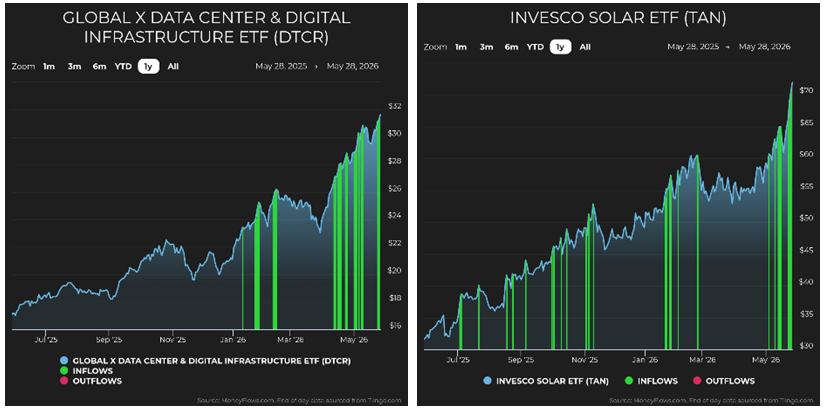
Theme ETFs are getting gobbled up over multiple days running, as in these ETFs:
Momentum ETFs (like MTUM or SPMO) and small-cap value ETFs (AVUV, IJR) joined them.
Even leveraged international exposure caught a bid.
This is not stock-picking. This is regime positioning. Eight distinct innovation themes are being bought by allocators willing to commit through index vehicles. When institutional capital moves through theme ETFs rather than individual names, it signals conviction in the direction, not just the destination.
Graphs are for illustrative and discussion purposes only. Please read important disclosures at the end of this commentary.
Graphs are for illustrative and discussion purposes only. Please read important disclosures at the end of this commentary.
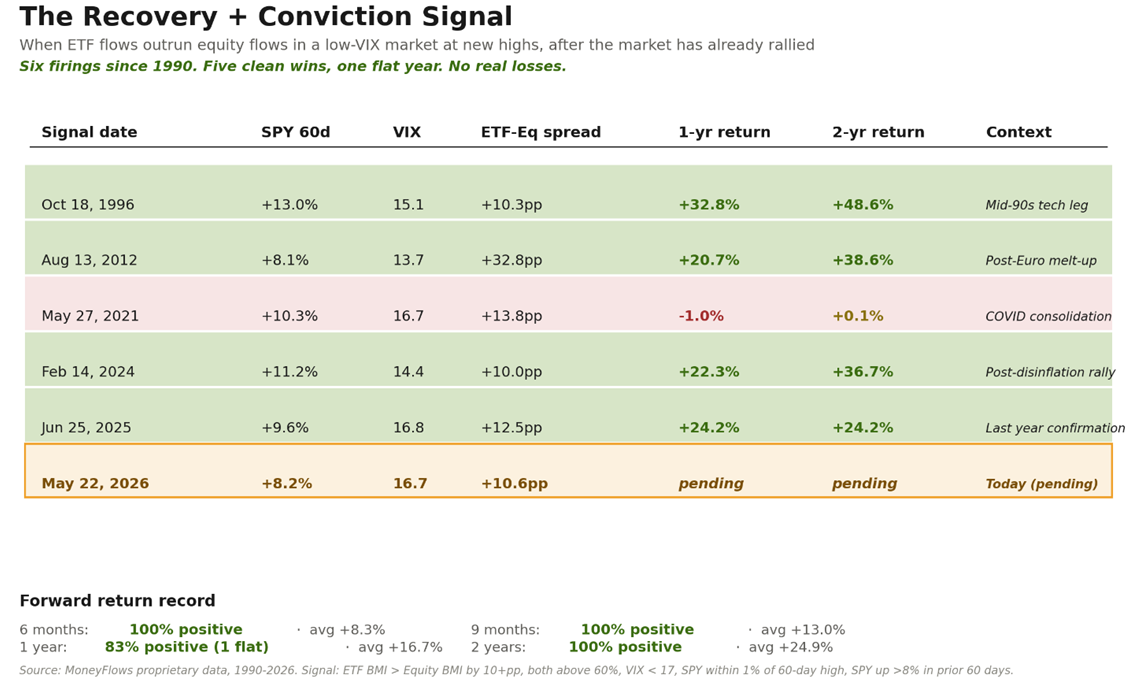
When I see a pattern this unusual, I look back through the data. This week’s setup has a specific positive fingerprint: ETF BMI exceeds equity BMI by 10+ points, both are above 60%, the VIX is under 17, the S&P is within 1% of its 60-day high, and the market has just rallied 8% or more in the prior 60-days.
That combination has fired six times since 1990. October 1996, August 2012, May 2021, February 2024, June 2025, and now May 2026. Five of the six prior signals delivered positive returns at every horizon from three months to two years. The one exception, May 2021, came in flat one year later, not down.
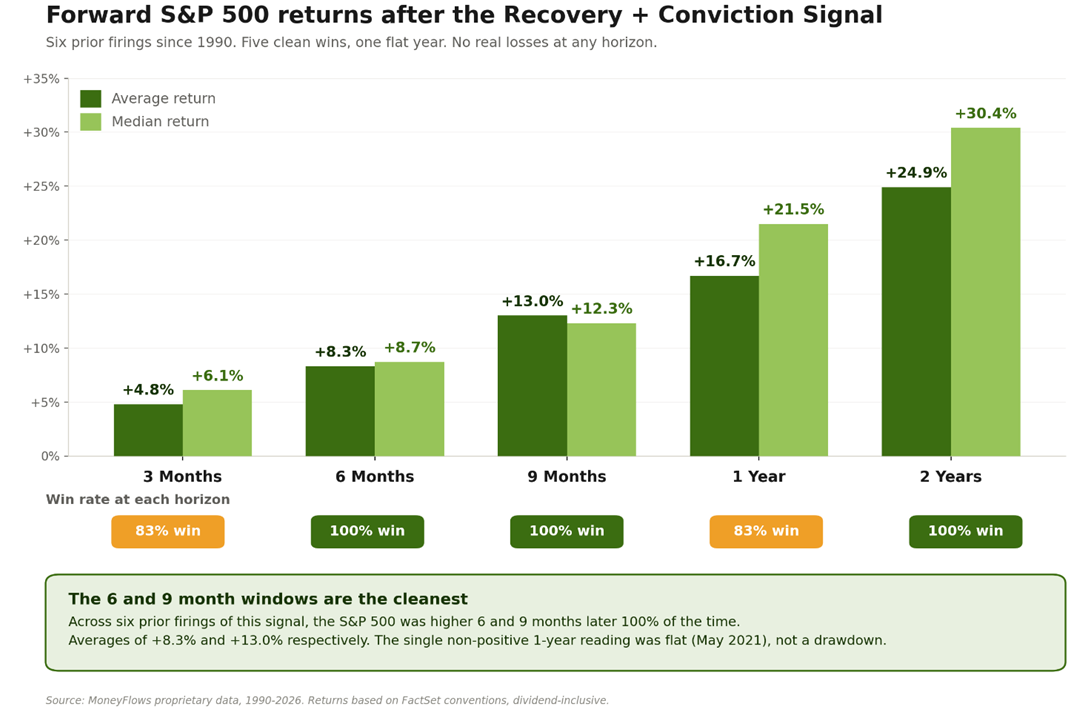
Forward S&P 500 returns from those signals:
Graphs are for illustrative and discussion purposes only. Please read important disclosures at the end of this commentary.
Graphs are for illustrative and discussion purposes only. Please read important disclosures at the end of this commentary.
Results are 100% positive at six-months, nine-months, and two-years out. The average two-year return was nearly 25%, which materially beats the long-run baseline of 21%. The signal is not foolproof. But across a 36-year sample, it has never produced a real loss at the medium and long horizons. The mid-cycle versions of this signal that fired in 2000, 2007, and 2008 do not show up in this filtered cohort, because in those moments the market was grinding rather than recovering.
Today’s setup is out of the recovery playbook. Price and flow are confirming each other. Historically, that has been the cleanest configuration: 2021 fired in stagnant tape, where flows looked strong but price was unwilling to follow. When flows lead and price confirms, the historical record is unblemished.
The setup matters because it tells you what kind of market we are in. Capital is not just buying because there is nowhere else to go. Capital is buying themes — specifically AI, space, semiconductors, cybersecurity, clean energy, innovation, biotechnology, data-infrastructure. Capital is selling its volatility hedges, flipping into materials and discretionary, and broadening leadership beyond the largest names.
The mainstream commentary spent the week worried about inflation, the Fed, and whether the rally had run too far, but the flows say the rally is just getting reorganized. Old leadership consolidating and new leadership emerging, hedges being sold and themes being bought.
Wrapping up, Robert Burton’s 1620 observation was that markets know things people do not. The pattern holds. The flow data this week is screaming a coherent message that the headlines have not yet caught up to. We are in the recovery + conviction setup. Six-prior occurrences, five-clean wins, one flat year. No real losses at six or nine-months ever. The market is positioning early, while attention is elsewhere.
“In investing, what is comfortable is rarely profitable.” – Robert Arnott
Flows tell you what comes next. The question is whether you are positioned for what the flows tell you.
The flow knows.
Navellier & Associates; own Nvidia Corp (NVDA) in managed accounts. Jason Bodner owns Nvidia Corp (NVDA) personally.
All content above represents the opinion of Jason Bodner of Navellier & Associates, Inc.
Also In This Issue
A Look Ahead by Louis Navellier
Some Surprising AI-Related Stock Selections
Income Mail by Bryan Perry
It’s Prime Time for Selling Covered Calls
Growth Mail by Gary Alexander
Forget the 1930s Market – The 2000-09 Crash Was Worse!
Global Mail by Ivan Martchev
What’s Behind This Late Cycle Acceleration?
Sector Spotlight by Jason Bodner
The Quietest Signals Often Have the Loudest Impact
View Full Archive
Read Past Issues Here

Jason Bodner
MARKETMAIL EDITOR FOR SECTOR SPOTLIGHT
Jason Bodner writes Sector Spotlight in the weekly Marketmail publication and has authored several white papers for the company. He is also Co-Founder of Macro Analytics for Professionals which produces proprietary equity accumulation and distribution research for its clients. Previously, Mr. Bodner served as Director of European Equity Derivatives for Cantor Fitzgerald Europe in London, then moved to the role of Head of Equity Derivatives North America for the same company in New York. He also served as S.V.P. Equity Derivatives for Jefferies, LLC. He received a B.S. in business administration in 1996, with honors, from Skidmore College as a member of the Periclean Honors Society. All content of “Sector Spotlight” represents the opinion of Jason Bodner
Important Disclosures:
Jason Bodner is a co-founder and co-owner of Mapsignals. Mr. Bodner is an independent contractor who is occasionally hired by Navellier & Associates to write an article and or provide opinions for possible use in articles that appear in Navellier & Associates weekly Market Mail. Mr. Bodner is not employed or affiliated with Louis Navellier, Navellier & Associates, Inc., or any other Navellier owned entity. The opinions and statements made here are those of Mr. Bodner and not necessarily those of any other persons or entities. This is not an endorsement, or solicitation or testimonial or investment advice regarding the BMI Index or any statements or recommendations or analysis in the article or the BMI Index or Mapsignals or its products or strategies.
Although information in these reports has been obtained from and is based upon sources that Navellier believes to be reliable, Navellier does not guarantee its accuracy and it may be incomplete or condensed. All opinions and estimates constitute Navellier’s judgment as of the date the report was created and are subject to change without notice. These reports are for informational purposes only and are not a solicitation for the purchase or sale of a security. Any decision to purchase securities mentioned in these reports must take into account existing public information on such securities or any registered prospectus.To the extent permitted by law, neither Navellier & Associates, Inc., nor any of its affiliates, agents, or service providers assumes any liability or responsibility nor owes any duty of care for any consequences of any person acting or refraining to act in reliance on the information contained in this communication or for any decision based on it.
Past performance is no indication of future results. Investment in securities involves significant risk and has the potential for partial or complete loss of funds invested. It should not be assumed that any securities recommendations made by Navellier. in the future will be profitable or equal the performance of securities made in this report. Dividend payments are not guaranteed. The amount of a dividend payment, if any, can vary over time and issuers may reduce dividends paid on securities in the event of a recession or adverse event affecting a specific industry or issuer.
None of the stock information, data, and company information presented herein constitutes a recommendation by Navellier or a solicitation to buy or sell any securities. Any specific securities identified and described do not represent all of the securities purchased, sold, or recommended for advisory clients. The holdings identified do not represent all of the securities purchased, sold, or recommended for advisory clients and the reader should not assume that investments in the securities identified and discussed were or will be profitable.
Information presented is general information that does not take into account your individual circumstances, financial situation, or needs, nor does it present a personalized recommendation to you. Individual stocks presented may not be suitable for every investor. Investment in securities involves significant risk and has the potential for partial or complete loss of funds invested. Investment in fixed income securities has the potential for the investment return and principal value of an investment to fluctuate so that an investor’s holdings, when redeemed, may be worth less than their original cost.
One cannot invest directly in an index. Index is unmanaged and index performance does not reflect deduction of fees, expenses, or taxes. Presentation of Index data does not reflect a belief by Navellier that any stock index constitutes an investment alternative to any Navellier equity strategy or is necessarily comparable to such strategies. Among the most important differences between the Indices and Navellier strategies are that the Navellier equity strategies may (1) incur material management fees, (2) concentrate its investments in relatively few stocks, industries, or sectors, (3) have significantly greater trading activity and related costs, and (4) be significantly more or less volatile than the Indices.
ETF Risk: We may invest in exchange traded funds (“ETFs”) and some of our investment strategies are generally fully invested in ETFs. Like traditional mutual funds, ETFs charge asset-based fees, but they generally do not charge initial sales charges or redemption fees and investors typically pay only customary brokerage fees to buy and sell ETF shares. The fees and costs charged by ETFs held in client accounts will not be deducted from the compensation the client pays Navellier. ETF prices can fluctuate up or down, and a client account could lose money investing in an ETF if the prices of the securities owned by the ETF go down. ETFs are subject to additional risks:
- ETF shares may trade above or below their net asset value;
- An active trading market for an ETF’s shares may not develop or be maintained;
- The value of an ETF may be more volatile than the underlying portfolio of securities the ETF is designed to track;
- The cost of owning shares of the ETF may exceed those a client would incur by directly investing in the underlying securities and;
- Trading of an ETF’s shares may be halted if the listing exchange’s officials deem it appropriate, the shares are delisted from the exchange, or the activation of market-wide “circuit breakers” (which are tied to large decreases in stock prices) halts stock trading generally.
Grader Disclosures: Investment in equity strategies involves substantial risk and has the potential for partial or complete loss of funds invested. The sample portfolio and any accompanying charts are for informational purposes only and are not to be construed as a solicitation to buy or sell any financial instrument and should not be relied upon as the sole factor in an investment making decision. As a matter of normal and important disclosures to you, as a potential investor, please consider the following: The performance presented is not based on any actual securities trading, portfolio, or accounts, and the reported performance of the A, B, C, D, and F portfolios (collectively the “model portfolios”) should be considered mere “paper” or pro forma performance results based on Navellier’s research.
Investors evaluating any of Navellier & Associates, Inc.’s, (or its affiliates’) Investment Products must not use any information presented here, including the performance figures of the model portfolios, in their evaluation of any Navellier Investment Products. Navellier Investment Products include the firm’s mutual funds and managed accounts. The model portfolios, charts, and other information presented do not represent actual funded trades and are not actual funded portfolios. There are material differences between Navellier Investment Products’ portfolios and the model portfolios, research, and performance figures presented here. The model portfolios and the research results (1) may contain stocks or ETFs that are illiquid and difficult to trade; (2) may contain stock or ETF holdings materially different from actual funded Navellier Investment Product portfolios; (3) include the reinvestment of all dividends and other earnings, estimated trading costs, commissions, or management fees; and, (4) may not reflect prices obtained in an actual funded Navellier Investment Product portfolio. For these and other reasons, the reported performances of model portfolios do not reflect the performance results of Navellier’s actually funded and traded Investment Products. In most cases, Navellier’s Investment Products have materially lower performance results than the performances of the model portfolios presented.
This report contains statements that are, or may be considered to be, forward-looking statements. All statements that are not historical facts, including statements about our beliefs or expectations, are “forward-looking statements” within the meaning of The U.S. Private Securities Litigation Reform Act of 1995. These statements may be identified by such forward-looking terminology as “expect,” “estimate,” “plan,” “intend,” “believe,” “anticipate,” “may,” “will,” “should,” “could,” “continue,” “project,” or similar statements or variations of such terms. Our forward-looking statements are based on a series of expectations, assumptions, and projections, are not guarantees of future results or performance, and involve substantial risks and uncertainty as described in Form ADV Part 2A of our filing with the Securities and Exchange Commission (SEC), which is available at www.adviserinfo.sec.gov or by requesting a copy by emailing info@navellier.com. All of our forward-looking statements are as of the date of this report only. We can give no assurance that such expectations or forward-looking statements will prove to be correct. Actual results may differ materially. You are urged to carefully consider all such factors.
FEDERAL TAX ADVICE DISCLAIMER: As required by U.S. Treasury Regulations, you are informed that, to the extent this presentation includes any federal tax advice, the presentation is not written by Navellier to be used, and cannot be used, for the purpose of avoiding federal tax penalties. Navellier does not advise on any income tax requirements or issues. Use of any information presented by Navellier is for general information only and does not represent tax advice either express or implied. You are encouraged to seek professional tax advice for income tax questions and assistance.
IMPORTANT NEWSLETTER DISCLOSURE:The hypothetical performance results for investment newsletters that are authored or edited by Louis Navellier, including Louis Navellier’s Growth Investor, Louis Navellier’s Breakthrough Stocks, Louis Navellier’s Accelerated Profits, and Louis Navellier’s Platinum Club, are not based on any actual securities trading, portfolio, or accounts, and the newsletters’ reported hypothetical performances should be considered mere “paper” or proforma hypothetical performance results and are not actual performance of real world trades. Navellier & Associates, Inc. does not have any relation to or affiliation with the owner of these newsletters. There are material differences between Navellier Investment Products’ portfolios and the InvestorPlace Media, LLC newsletter portfolios authored by Louis Navellier. The InvestorPlace Media, LLC newsletters contain hypothetical performance that do not include transaction costs, advisory fees, or other fees a client might incur if actual investments and trades were being made by an investor. As a result, newsletter performance should not be used to evaluate Navellier Investment services which are separate and different from the newsletters. The owner of the newsletters is InvestorPlace Media, LLC and any questions concerning the newsletters, including any newsletter advertising or hypothetical Newsletter performance claims, (which are calculated solely by Investor Place Media and not Navellier) should be referred to InvestorPlace Media, LLC at (800) 718-8289.
Please note that Navellier & Associates and the Navellier Private Client Group are managed completely independent of the newsletters owned and published by InvestorPlace Media, LLC and written and edited by Louis Navellier, and investment performance of the newsletters should in no way be considered indicative of potential future investment performance for any Navellier & Associates separately managed account portfolio. Potential investors should consult with their financial advisor before investing in any Navellier Investment Product.
Navellier claims compliance with Global Investment Performance Standards (GIPS). To receive a complete list and descriptions of Navellier’s composites and/or a presentation that adheres to the GIPS standards, please contact Navellier or click here. It should not be assumed that any securities recommendations made by Navellier & Associates, Inc. in the future will be profitable or equal the performance of securities made in this report.
FactSet Disclosure: Navellier does not independently calculate the statistical information included in the attached report. The calculation and the information are provided by FactSet, a company not related to Navellier. Although information contained in the report has been obtained from FactSet and is based on sources Navellier believes to be reliable, Navellier does not guarantee its accuracy, and it may be incomplete or condensed. The report and the related FactSet sourced information are provided on an “as is” basis. The user assumes the entire risk of any use made of this information. Investors should consider the report as only a single factor in making their investment decision. The report is for informational purposes only and is not intended as an offer or solicitation for the purchase or sale of a security. FactSet sourced information is the exclusive property of FactSet. Without prior written permission of FactSet, this information may not be reproduced, disseminated or used to create any financial products. All indices are unmanaged and performance of the indices include reinvestment of dividends and interest income, unless otherwise noted, are not illustrative of any particular investment and an investment cannot be made in any index. Past performance is no guarantee of future results.