by Gary Alexander
June 2, 2026
We should stop fearing “another 1929” and pat ourselves on the back for surviving an even worse decade. As it turns out, the decade ending in 2008 – into early 2009 – was worse than the decline in the 1930s.
Specifically, a study by Ibbotson Associates in 2009 showed how the 1999-2008 decade was worse than any 10-year span in the 1930s. Ibbotson has kept price details on market performance over the last century, since 1926, obviously including the crash year of 1929 and the dismal 1930s, but in the 83-year period available then (1926 to 2009), the worst real (after inflation) performance before 2008 happened 1929 to 1938, with annual losses of –0.89% per year (-8.6% overall), while the 10-year loss at the end of 2008 delivered an annual decline of -1.4% per year (-13% for the decade) after inflation (in both cases).
What’s more, Ibbotson also analyzed each 120-month period, ending each month of each year for those 83-years. They found the last month of their study – February 28, 1999 to February 28, 2009 – delivered the worst 10-year market performance among the 880-monthly measurement periods since 1926.
Also, four of the worst 5 decade-long losses came around the end of 2008, going into 2009:
The Five Worst Market Decades Since 1926
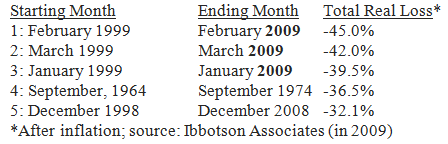
Notice: No dates in the 1930s made the top five-worst market decades, and the worst three 10-year spans came in the first three-months of 2009. As I’ll show below, market sentiment then reached record lows.
60 Minutes’ Repeated Its Scary “1929” Warning – on Memorial Day Weekend, 2026
This is relevant because on May 24. 2006 – Memorial Day weekend, no less – CBS’s Sunday night talk (and fear-mongering) show, 60-Minutes, repeated their October 2025 interview with author Andrew Ross Sorkin on the parallels between now and 1929 – generating fears of a major market crash last October!
As I reported then, Sorkin made no such comparisons in his finely researched history book about the events of “1929,” but 60-Minutes (and other media) need to sell fear, not history, so they steered the interview into “chilling parallels” and then elected to repeat that segment on Memorial Day weekend.
They could have told us how far the market rose since last October, but that would be too embarrassing.
Their segment, titled, “Booms, Busts and Bubbles,” seeks to push the panic button right away, with this Website bait: “Stocks on Wall Street have rallied in recent months, but author Andrew Ross Sorkin sees a crash coming. The question is: When will the bubble pop, and how much will the market slump?”
This time around, I won’t review that hyper-ventilating scare piece again, but I will repeat my praise of Sorkin’s book for its historical research on both 1929, similar to his previous book on the 2008 crash, “Too Big to Fail.” In this case, I would also like to add some details from a 2009 book I helped edit:

The book I edited in 2009 was published by a major book vendor, John Wiley and Sons in 2010. We called it “The Evergreen Portfolio: Timeless Strategies to Survive and Prosper from the Investing Pros.”
The genesis of that book was the Atlanta investment team headed by Martin Truax and Ron Miller. At the time, I had been the chief MC of their “Atlanta Investment Conference” for 20-years, since its founding in 1988. Martin assembled a special conference in April 2009, right after the market’s lows in early March. Martin asked me to interview 15-speakers on video and audio tape about where the market was headed.
In the Evergreen book, I wrote two-chapters – one summarizing their views, and a second article on market history, and what it implies. First, in Chapter Two, I wrote up my interviews with 15 other speakers on “How Did We Get into This Mess? And What is the Best Way Out?” Then, in Chapter 4, I wrote, “How Fed Policy Fuels Market Cycles.” My concluding paragraph is worth a full quote here:
“The future is not carved in stone. The decisions that President Obama, Congress, and the Fed make in the next year will determine whether we have 7 or 10 more bad years or can look back to March 6-9, 2009 as a major market bottom. Voters have the final word: The mid-term elections of 2010 may rescue our portfolios. Recent history shows the market soars and federal spending is restrained when one part controls the White House and the other controls Congress. Ironically, political ‘gridlock’ may be our best hopes.” – My closing paragraph in “Evergreen Portfolio.”
As it turns out, the 2010 mid-terms delivered, in spades, doubled and redoubled. The House seats went from a 62-seat Democratic majority to a 62-seat Republican majority, a record swing of 124-seats. My New Orleans panelist Charles Krauthammer called it a “restraining order” on spending.
But back in 2009, our investment speakers, attendees and the nation at large didn’t see this coming.
Bearish Sentiment Peaked on the Actual DAY of the Market’s Bottom in 2009
In March 2009, at the market bottom, bearish sentiment set all-time record highs. First, the American Association for Individual Investors (AAII) sentiment poll reached a record high 70.3% bears on March 5, 2009, in their last poll before the market bottom of that cycle. Only 18.9% of investors were bullish, with 9.8% neutral, providing the widest bull-bear spread to that date – at +51.4 points).
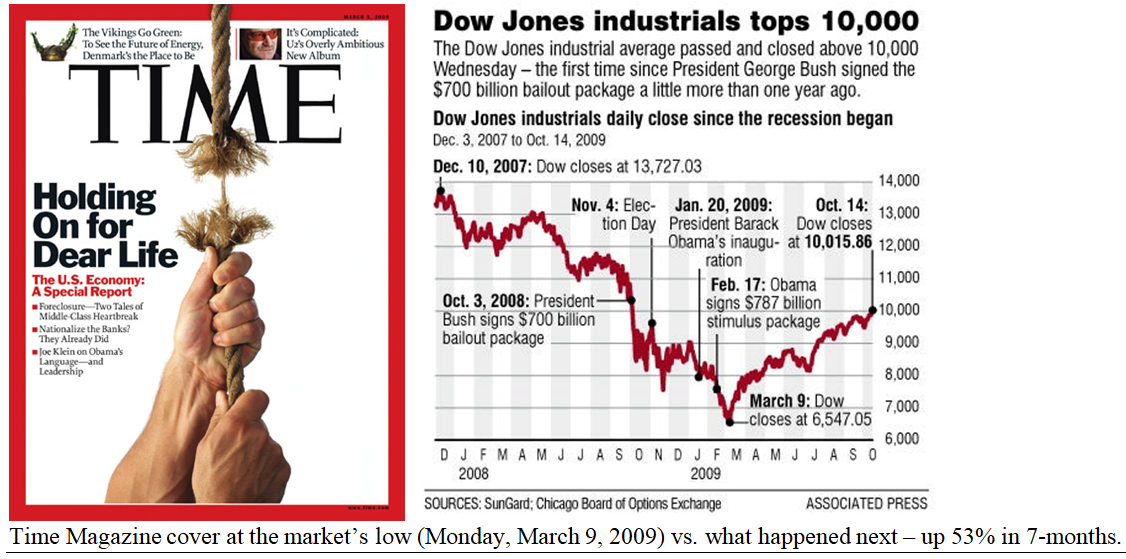
The professionals weren’t any wiser. On the very date of the Dow’s bottom at 6,547 on March 9, 2009, The Wall Street Journal published an article titled: “The Case for Dow 5000,” but the opposite happened.
The Dow closed above 10,000 on October 14, 2009, rising by over 50% in barely seven months in 2009.
Graphs are for illustrative and discussion purposes only. Please read important disclosures at the end of this commentary.
I bring up this ancient history to put my April 2009 Atlanta speakers in a somewhat kinder light, since most of them predicted further declines in the market and economy. One of the five questions I asked each speaker (on audio and video tape, and for the book) was “what shape will the next recovery take?”
I explained the four basic choices they could make, summarized here from worst case to best case:
- An “L” shaped recovery goes down and stays down for a very long time.
- A “W” shaped recovery starts to recover but then falls into a second deep recession.
- A “U” shaped recovery stays down in the dumps for a long time before recovering.
- A “V” shaped recovery implies a quick and strong recovery with no follow-up decline.
Among my 15-taped experts, the majority (as on Wall Street and in the AAII polls) predicted an “L” shaped long-term recession. I wrote, at the time, “The general consensus was for an “L” non-recovery, but that only means that our eyes can’t see very far for now.” Here’s some of what nine of the bears said:
- “I believe we’re in an L that hasn’t reached its 90-degree bottom yet.”
- “I see an L ahead, even though we’ve seen a V in the stock market.”
- “I foresee a flat line, an L, very much like the 1970s.”
- “We’re more on the lines of an L, a very long recession.”
- “Before the bottom happens, we may see more social conflicts…the Dow could go below 1,000.”
- “There is a real potential for a catastrophic failure in our system.”
- “This has already been a longer recession, since the regular tools aren’t working.”
- “I see lots of ups and downs with quite a few W’s, perhaps a WWW….”
- “I wish I could create a Chinese character…more complex than your U-V-W-L options.”
That’s nine of our 15-analysts. Another four or five were neutral (with a “U” shaped recover), and the most bullish of the 15 was economist Mark Skousen, who predicted a “Dow above 14,280 within two-years, by 2011.” He wasn’t far off, as the Dow reached 12,876 two-years later, and 16,575 by late 2013. (The main authors, Martin Truax and Ron Miller, also had sound articles, with long-term bullish views).
Let me close with my own story. I also gave a talk at that April 2009 Georgia conference – later repeated in these pages as my second column for Louis Navellier’s early version of MarketMail – paralleling Mark Skousen’s predictions with a headline, “Historically deep declines imply historically strong recoveries.”
To my surprise, Matt Krantz, financial editor at USA Today, saw my article and recognized how bold and “out of the box” my forecast (published by Navellier) was at the time, so he called the Navellier office to get my phone number and rang me up. He wondered what made me think we actually had a chance for a historically strong recovery. I answered with some of my data-heavy details, and he liked what I said, so he published a short article on my Navellier post for USA Today, which was picked up by other media.
At that time, the editor of Louis Navellier’s newsletters (which I helped launch) told me, “You hit the Internet jackpot, Gary, Congratulations.” I didn’t know then, or even knew the term, but I had become a “media influencer.” I haven’t had another major media splash since 2009, but that was a flattering start.
So, in context and hindsight, I want to thank Louis Navellier for giving me the platform to write what I wrote then, and now. Being bullish was an unpopular stance then. In fact, my previous publisher seemed spooked by bearish fears and laid off bulls like me in late February 2009, while also cancelling the bullish newsletter I was editing then for another great positive mentor. So, as March opened, my nest egg was cut in half by the crash and I was jobless when Martin Truax invited me to MC a seminar where all the profits supported a wonderful charity, with no speaker fees, but my bullish views helped Louis decide to hire me.
So, thanks, Martin, and Louis! The Dow is now at 50,000, not 5,000, or 1,000, and we saw that coming…
All content above represents the opinion of Gary Alexander of Navellier & Associates, Inc.
Also In This Issue
A Look Ahead by Louis Navellier
Some Surprising AI-Related Stock Selections
Income Mail by Bryan Perry
It’s Prime Time for Selling Covered Calls
Growth Mail by Gary Alexander
Forget the 1930s Market – The 2000-09 Crash Was Worse!
Global Mail by Ivan Martchev
What’s Behind This Late Cycle Acceleration?
Sector Spotlight by Jason Bodner
The Quietest Signals Often Have the Loudest Impact
View Full Archive
Read Past Issues Here
About The Author

Gary Alexander
SENIOR EDITOR
Gary Alexander has been Senior Writer at Navellier since 2009. He edits Navellier’s weekly Marketmail and writes a weekly Growth Mail column, in which he uses market history to support the case for growth stocks. For the previous 20-years before joining Navellier, he was Senior Executive Editor at InvestorPlace Media (formerly Phillips Publishing), where he worked with several leading investment analysts, including Louis Navellier (since 1997), helping launch Louis Navellier’s Blue Chip Growth and Global Growth newsletters.
Prior to that, Gary edited Wealth Magazine and Gold Newsletter and wrote various investment research reports for Jefferson Financial in New Orleans in the 1980s. He began his financial newsletter career with KCI Communications in 1980, where he served as consulting editor for Personal Finance newsletter while serving as general manager of KCI’s Alexandria House book division. Before that, he covered the economics beat for news magazines. All content of “Growth Mail” represents the opinion of Gary Alexander
Important Disclosures:
Although information in these reports has been obtained from and is based upon sources that Navellier believes to be reliable, Navellier does not guarantee its accuracy and it may be incomplete or condensed. All opinions and estimates constitute Navellier’s judgment as of the date the report was created and are subject to change without notice. These reports are for informational purposes only and are not a solicitation for the purchase or sale of a security. Any decision to purchase securities mentioned in these reports must take into account existing public information on such securities or any registered prospectus.To the extent permitted by law, neither Navellier & Associates, Inc., nor any of its affiliates, agents, or service providers assumes any liability or responsibility nor owes any duty of care for any consequences of any person acting or refraining to act in reliance on the information contained in this communication or for any decision based on it.
Past performance is no indication of future results. Investment in securities involves significant risk and has the potential for partial or complete loss of funds invested. It should not be assumed that any securities recommendations made by Navellier. in the future will be profitable or equal the performance of securities made in this report. Dividend payments are not guaranteed. The amount of a dividend payment, if any, can vary over time and issuers may reduce dividends paid on securities in the event of a recession or adverse event affecting a specific industry or issuer.
None of the stock information, data, and company information presented herein constitutes a recommendation by Navellier or a solicitation to buy or sell any securities. Any specific securities identified and described do not represent all of the securities purchased, sold, or recommended for advisory clients. The holdings identified do not represent all of the securities purchased, sold, or recommended for advisory clients and the reader should not assume that investments in the securities identified and discussed were or will be profitable.
Information presented is general information that does not take into account your individual circumstances, financial situation, or needs, nor does it present a personalized recommendation to you. Individual stocks presented may not be suitable for every investor. Investment in securities involves significant risk and has the potential for partial or complete loss of funds invested. Investment in fixed income securities has the potential for the investment return and principal value of an investment to fluctuate so that an investor’s holdings, when redeemed, may be worth less than their original cost.
One cannot invest directly in an index. Index is unmanaged and index performance does not reflect deduction of fees, expenses, or taxes. Presentation of Index data does not reflect a belief by Navellier that any stock index constitutes an investment alternative to any Navellier equity strategy or is necessarily comparable to such strategies. Among the most important differences between the Indices and Navellier strategies are that the Navellier equity strategies may (1) incur material management fees, (2) concentrate its investments in relatively few stocks, industries, or sectors, (3) have significantly greater trading activity and related costs, and (4) be significantly more or less volatile than the Indices.
ETF Risk: We may invest in exchange traded funds (“ETFs”) and some of our investment strategies are generally fully invested in ETFs. Like traditional mutual funds, ETFs charge asset-based fees, but they generally do not charge initial sales charges or redemption fees and investors typically pay only customary brokerage fees to buy and sell ETF shares. The fees and costs charged by ETFs held in client accounts will not be deducted from the compensation the client pays Navellier. ETF prices can fluctuate up or down, and a client account could lose money investing in an ETF if the prices of the securities owned by the ETF go down. ETFs are subject to additional risks:
- ETF shares may trade above or below their net asset value;
- An active trading market for an ETF’s shares may not develop or be maintained;
- The value of an ETF may be more volatile than the underlying portfolio of securities the ETF is designed to track;
- The cost of owning shares of the ETF may exceed those a client would incur by directly investing in the underlying securities; and
- Trading of an ETF’s shares may be halted if the listing exchange’s officials deem it appropriate, the shares are delisted from the exchange, or the activation of market-wide “circuit breakers” (which are tied to large decreases in stock prices) halts stock trading generally.
Grader Disclosures: Investment in equity strategies involves substantial risk and has the potential for partial or complete loss of funds invested. The sample portfolio and any accompanying charts are for informational purposes only and are not to be construed as a solicitation to buy or sell any financial instrument and should not be relied upon as the sole factor in an investment making decision. As a matter of normal and important disclosures to you, as a potential investor, please consider the following: The performance presented is not based on any actual securities trading, portfolio, or accounts, and the reported performance of the A, B, C, D, and F portfolios (collectively the “model portfolios”) should be considered mere “paper” or pro forma performance results based on Navellier’s research.
Investors evaluating any of Navellier & Associates, Inc.’s, (or its affiliates’) Investment Products must not use any information presented here, including the performance figures of the model portfolios, in their evaluation of any Navellier Investment Products. Navellier Investment Products include the firm’s mutual funds and managed accounts. The model portfolios, charts, and other information presented do not represent actual funded trades and are not actual funded portfolios. There are material differences between Navellier Investment Products’ portfolios and the model portfolios, research, and performance figures presented here. The model portfolios and the research results (1) may contain stocks or ETFs that are illiquid and difficult to trade; (2) may contain stock or ETF holdings materially different from actual funded Navellier Investment Product portfolios; (3) include the reinvestment of all dividends and other earnings, estimated trading costs, commissions, or management fees; and, (4) may not reflect prices obtained in an actual funded Navellier Investment Product portfolio. For these and other reasons, the reported performances of model portfolios do not reflect the performance results of Navellier’s actually funded and traded Investment Products. In most cases, Navellier’s Investment Products have materially lower performance results than the performances of the model portfolios presented.
This report contains statements that are, or may be considered to be, forward-looking statements. All statements that are not historical facts, including statements about our beliefs or expectations, are “forward-looking statements” within the meaning of The U.S. Private Securities Litigation Reform Act of 1995. These statements may be identified by such forward-looking terminology as “expect,” “estimate,” “plan,” “intend,” “believe,” “anticipate,” “may,” “will,” “should,” “could,” “continue,” “project,” or similar statements or variations of such terms. Our forward-looking statements are based on a series of expectations, assumptions, and projections, are not guarantees of future results or performance, and involve substantial risks and uncertainty as described in Form ADV Part 2A of our filing with the Securities and Exchange Commission (SEC), which is available at www.adviserinfo.sec.gov or by requesting a copy by emailing info@navellier.com. All of our forward-looking statements are as of the date of this report only. We can give no assurance that such expectations or forward-looking statements will prove to be correct. Actual results may differ materially. You are urged to carefully consider all such factors.
FEDERAL TAX ADVICE DISCLAIMER: As required by U.S. Treasury Regulations, you are informed that, to the extent this presentation includes any federal tax advice, the presentation is not written by Navellier to be used, and cannot be used, for the purpose of avoiding federal tax penalties. Navellier does not advise on any income tax requirements or issues. Use of any information presented by Navellier is for general information only and does not represent tax advice either express or implied. You are encouraged to seek professional tax advice for income tax questions and assistance.
IMPORTANT NEWSLETTER DISCLOSURE:The hypothetical performance results for investment newsletters that are authored or edited by Louis Navellier, including Louis Navellier’s Growth Investor, Louis Navellier’s Breakthrough Stocks, Louis Navellier’s Accelerated Profits, and Louis Navellier’s Platinum Club, are not based on any actual securities trading, portfolio, or accounts, and the newsletters’ reported hypothetical performances should be considered mere “paper” or proforma hypothetical performance results and are not actual performance of real world trades. Navellier & Associates, Inc. does not have any relation to or affiliation with the owner of these newsletters. There are material differences between Navellier Investment Products’ portfolios and the InvestorPlace Media, LLC newsletter portfolios authored by Louis Navellier. The InvestorPlace Media, LLC newsletters contain hypothetical performance that do not include transaction costs, advisory fees, or other fees a client might incur if actual investments and trades were being made by an investor. As a result, newsletter performance should not be used to evaluate Navellier Investment services which are separate and different from the newsletters. The owner of the newsletters is InvestorPlace Media, LLC and any questions concerning the newsletters, including any newsletter advertising or hypothetical Newsletter performance claims, (which are calculated solely by Investor Place Media and not Navellier) should be referred to InvestorPlace Media, LLC at (800) 718-8289.
Please note that Navellier & Associates and the Navellier Private Client Group are managed completely independent of the newsletters owned and published by InvestorPlace Media, LLC and written and edited by Louis Navellier, and investment performance of the newsletters should in no way be considered indicative of potential future investment performance for any Navellier & Associates separately managed account portfolio. Potential investors should consult with their financial advisor before investing in any Navellier Investment Product.
Navellier claims compliance with Global Investment Performance Standards (GIPS). To receive a complete list and descriptions of Navellier’s composites and/or a presentation that adheres to the GIPS standards, please contact Navellier or click here. It should not be assumed that any securities recommendations made by Navellier & Associates, Inc. in the future will be profitable or equal the performance of securities made in this report.
FactSet Disclosure: Navellier does not independently calculate the statistical information included in the attached report. The calculation and the information are provided by FactSet, a company not related to Navellier. Although information contained in the report has been obtained from FactSet and is based on sources Navellier believes to be reliable, Navellier does not guarantee its accuracy, and it may be incomplete or condensed. The report and the related FactSet sourced information are provided on an “as is” basis. The user assumes the entire risk of any use made of this information. Investors should consider the report as only a single factor in making their investment decision. The report is for informational purposes only and is not intended as an offer or solicitation for the purchase or sale of a security. FactSet sourced information is the exclusive property of FactSet. Without prior written permission of FactSet, this information may not be reproduced, disseminated or used to create any financial products. All indices are unmanaged and performance of the indices include reinvestment of dividends and interest income, unless otherwise noted, are not illustrative of any particular investment and an investment cannot be made in any index. Past performance is no guarantee of future results.