by Jason Bodner
May 23, 2023
It’s Friday morning and I’m tired.
Last night, I watched Game 1 of the Florida Panthers/Carolina Hurricanes Eastern Conference Finals in the National Hockey League Stanley Cup playoffs. If you listened to the media, Florida shouldn’t even be here, just squeaking into the playoffs in lowest seed in the East. But here they are, and the game went to quadruple overtime. Florida won with only 12.7 seconds remaining in the fourth overtime.
Watching hockey is boring for many. I still think hockey is the best sport but watching one game for 6-and-a-half-hours was tough for even me. I bailed after the first overtime at 11:30 pm. I imagine many would consider sitting through the whole thing a weird form of torture. Crazy enough, that wasn’t even the longest game in NHL history. No, that distinction came March 24, 1936, when the Detroit Red Wings beat the Montreal Maroons 1-0 in the sixth overtime after 176 minutes and 30 seconds of play.
Here’s the thing, though: Sure, there were herculean athletic displays, and crazy resolve, and superhuman strength in those four overtimes. For example, the Panthers’ Goalie, Sergei “Bob” Bobrovsky lost 20+ pounds in just one game of the playoffs! What became apparent after watching many periods of hockey- is the mental aspect of the game. Bob said it best when he called it a war of attrition, which is the process of gradually reducing the strength or effectiveness of someone through sustained attack or pressure.
It turns out that the first four NHL playoffs in this round of NHL games all went to overtime! It’s like the market, with the S&P trading in a range of 4,050-4,198 in April and May – unable to break out either way.
Trying to win at hockey is crazy. Trying to win at the stock market might be even crazier. Most people think it’s pretty easy to beat the market: Just pick a stock and lay your money down and watch it rise. Or be a long-term buy-and-hold investor. But the cold-hard truth is that only 4% of stocks provide the entire net gain of the stock market over the past 97 years, as proven by Hendrik Bessembinder. Investing in the stock market means you have only a 4% chance of winning. Put another way, the odds are stacked 96% against you. Perhaps like the computer Joshua said in War Games: the only winning move is not to play.
Well, rest assured that such a dire fate need not be true, provided you can find those 4% winning stocks. Constructing a system to do that has been my life’s work for the last 20 years. The key is using quantitative analytics to identify stocks with winning traits. But it also involves interpreting the market’s current status and the information it’s giving. And right now, there is a war of attrition happening on the order of quadruple overtime hockey – an exhausting battle that will leave a victor and a vanquished.
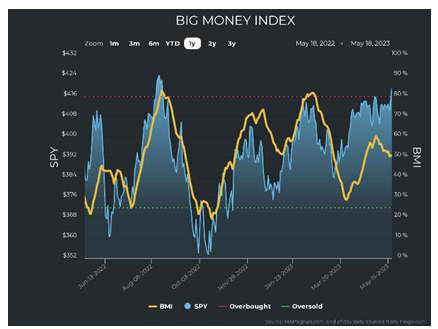
We can see that war unfolding in the buying and selling data. After rising in March and April, the Big Money Index (BMI) pulled back and churned sideways. The BMI is now coiling up tightly, looking primed to explode one way or the other, breaking out of this sideways deadlock.
Graphs are for illustrative and discussion purposes only. Please read important disclosures at the end of this commentary.
Buyers and sellers are battling it out, but who will win? The key to that answer comes in the data.
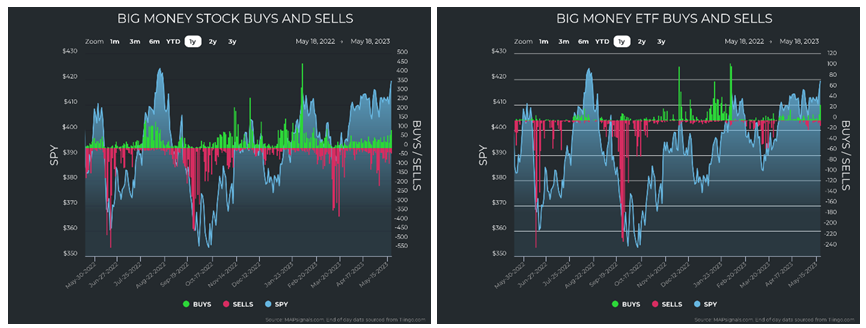
First let’s look at unusual stock and ETF buying and selling data:
Graphs are for illustrative and discussion purposes only. Please read important disclosures at the end of this commentary.
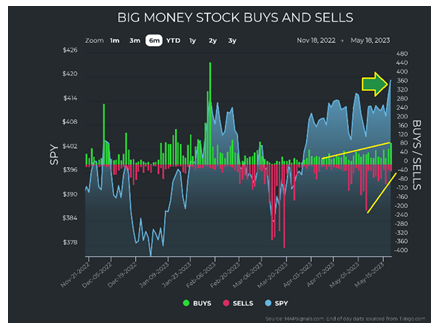
At first glance, it doesn’t look like much is happening. But if we zoom in, we can see a winner emerging – even if ever so slightly. Here we see stock buying increasing, selling decreasing, and the index lifting:
Graphs are for illustrative and discussion purposes only. Please read important disclosures at the end of this commentary.
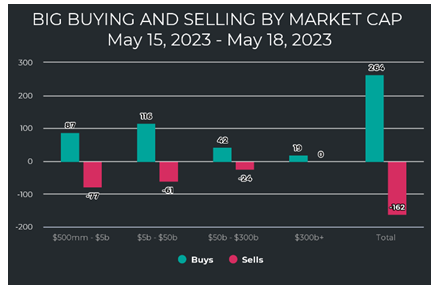
The SPY is clearly breaking out, with unusual buying increasing. Now let’s look at what is being bought. That can tell us if this is sustainable or not. First, we see accumulation last week of small- and mid-caps:
Graphs are for illustrative and discussion purposes only. Please read important disclosures at the end of this commentary.
Before we get to which sectors are leading the way – let’s ask why there is so much buying?
One reason is that it may have something to do with the no-show of the dreaded “earnings apocalypse.” Earnings season is pretty much done at this point. According to Fact-Set, as of 5/12/23, 92% of companies reported earnings for Q1, with 78% beating EPS estimates and 75% beating sales estimates.
What’s bad about that? I’m sure the bears out there will find something to say, but I see sunny skies.
Now as for what’s getting snapped up, growth areas continue to lead the way. Tech, discretionary, and Industrials round out the top 3 sectors. Strong growth leadership is not the behavior of a defensive market prepping for a crash. It is the opposite. We see the war of attrition playing out in front of our very eyes:
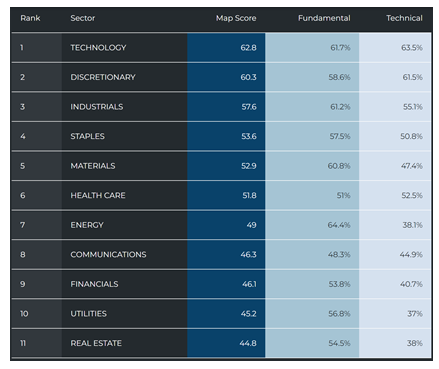
Graphs are for illustrative and discussion purposes only. Please read important disclosures at the end of this commentary.
We can also see the buying happening in these strong growth sectors too:
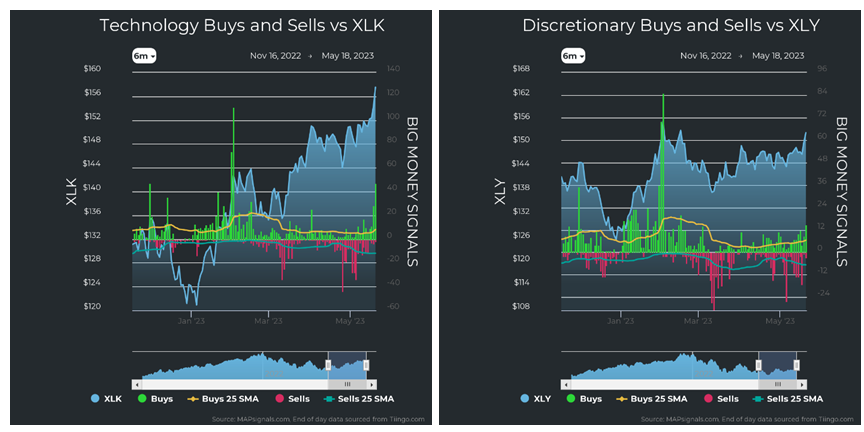
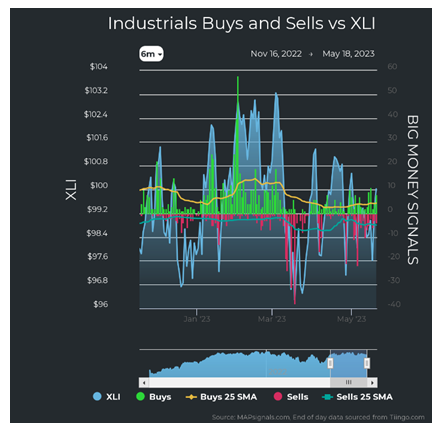
Graphs are for illustrative and discussion purposes only. Please read important disclosures at the end of this commentary.
Then we look at the “middle-meat” of the market sectors. We see constructive buying (green) in those, too. Staples, Materials, and health all are seeing young shoots of buying potentially foreshadowing more to come. Even Energy is seeing its first noticeable buying in a while:
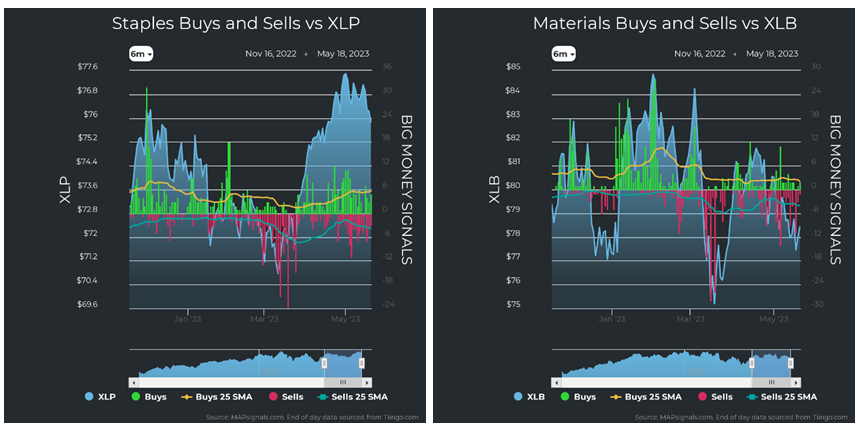
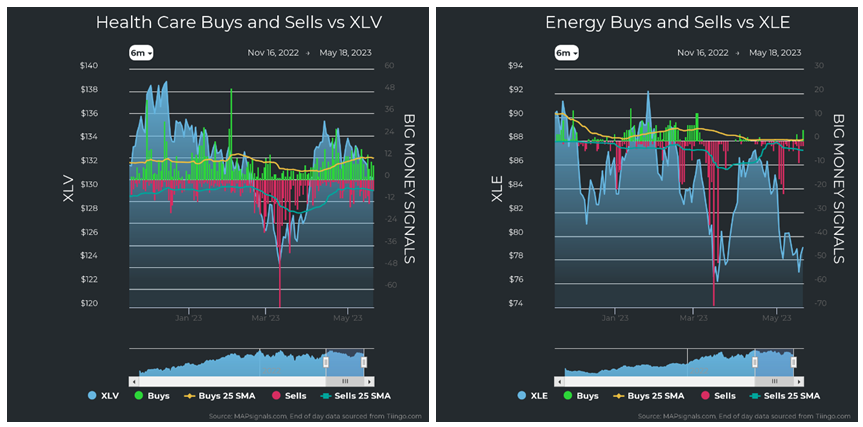
Graphs are for illustrative and discussion purposes only. Please read important disclosures at the end of this commentary.
When we turn to the laggard sectors, we still see promise. Perhaps we aren’t seeing convincing buying, but we do see selling dissipating to practically nothing. This is especially good news for the troubled banking sector, as relentless selling seems to have stopped for now:
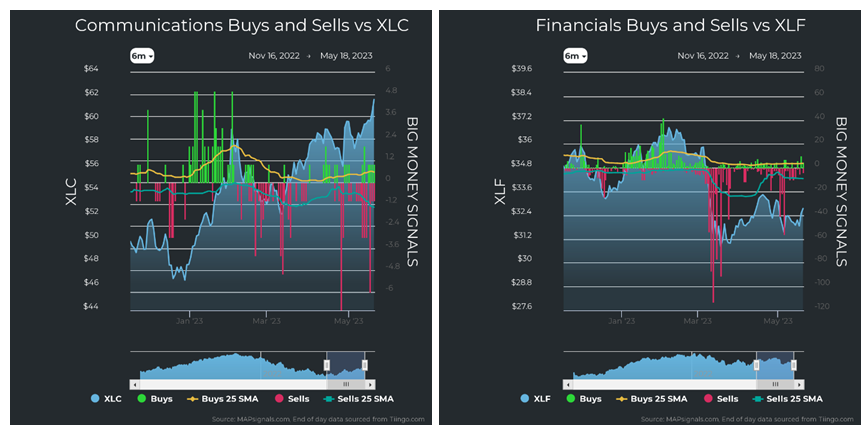
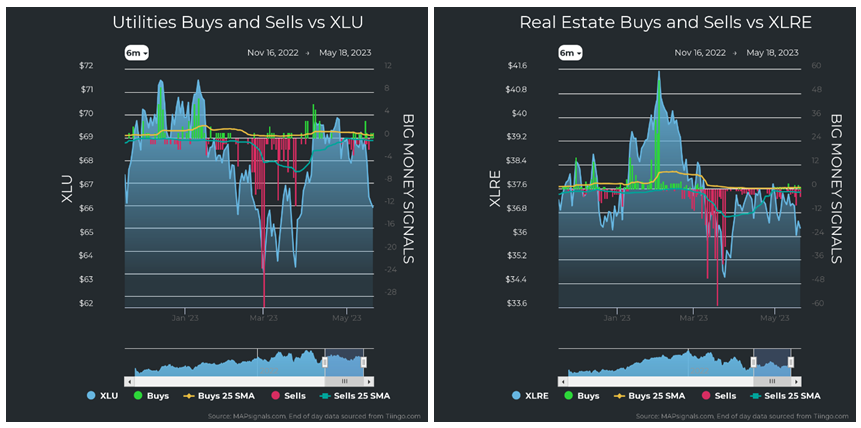
Graphs are for illustrative and discussion purposes only. Please read important disclosures at the end of this commentary.
So, without getting tainted by the media’s endless portrayal of doom, I look at some very promising data.
In summary:
- The BMI’s fall has slowed to a sideways coil, about to spring up.
- There is noticeably more buying than selling.
- The SPY (S&P 500 ETF) is breaking out.
- Small and mid-caps are being gobbled up.
- Earnings are working well.
- Leadership is in the growth sectors.
Wrapping up, logic says the Florida Panthers shouldn’t be this far in the playoffs, winning a second overtime game on the road Saturday night against the favored Carolina Hurricanes. The same logic says the market should be in worse shape. But the data in both cases supports an emerging picture of victory.
It’s still too early to tell in each case, but thus far, it’s black and white: The underdog Panthers are winning a lot of playoff hockey games, knocking off the best team in history on the way, and the stock market is also strengthening in many aspects, flying in the face of many pundits.
Like Benjamin Franklin said, “Believe none of what you hear, and half of what you see.”
All content above represents the opinion of Jason Bodner of Navellier & Associates, Inc.
Also In This Issue
A Look Ahead by Louis Navellier
Global Leaders Fail to Lead (or Even Compromise)
Income Mail by Bryan Perry
Regional Banks Are Setting Up for a Summer of Tough Love
Growth Mail by Gary Alexander
In This “Age of Funemployment,” Is a Recession Possible?
Global Mail by Ivan Martchev
Narrow Market Breadth Continues to Concern Investors
Sector Spotlight by Jason Bodner
The Market’s “Doldrums” Are Well into Overtime
View Full Archive
Read Past Issues Here

Jason Bodner
MARKETMAIL EDITOR FOR SECTOR SPOTLIGHT
Jason Bodner writes Sector Spotlight in the weekly Marketmail publication and has authored several white papers for the company. He is also Co-Founder of Macro Analytics for Professionals which produces proprietary equity accumulation/distribution research for its clients. Previously, Mr. Bodner served as Director of European Equity Derivatives for Cantor Fitzgerald Europe in London, then moved to the role of Head of Equity Derivatives North America for the same company in New York. He also served as S.V.P. Equity Derivatives for Jefferies, LLC. He received a B.S. in business administration in 1996, with honors, from Skidmore College as a member of the Periclean Honors Society. All content of “Sector Spotlight” represents the opinion of Jason Bodner
Important Disclosures:
Jason Bodner is a co-founder and co-owner of Mapsignals. Mr. Bodner is an independent contractor who is occasionally hired by Navellier & Associates to write an article and or provide opinions for possible use in articles that appear in Navellier & Associates weekly Market Mail. Mr. Bodner is not employed or affiliated with Louis Navellier, Navellier & Associates, Inc., or any other Navellier owned entity. The opinions and statements made here are those of Mr. Bodner and not necessarily those of any other persons or entities. This is not an endorsement, or solicitation or testimonial or investment advice regarding the BMI Index or any statements or recommendations or analysis in the article or the BMI Index or Mapsignals or its products or strategies.
Although information in these reports has been obtained from and is based upon sources that Navellier believes to be reliable, Navellier does not guarantee its accuracy and it may be incomplete or condensed. All opinions and estimates constitute Navellier’s judgment as of the date the report was created and are subject to change without notice. These reports are for informational purposes only and are not a solicitation for the purchase or sale of a security. Any decision to purchase securities mentioned in these reports must take into account existing public information on such securities or any registered prospectus.To the extent permitted by law, neither Navellier & Associates, Inc., nor any of its affiliates, agents, or service providers assumes any liability or responsibility nor owes any duty of care for any consequences of any person acting or refraining to act in reliance on the information contained in this communication or for any decision based on it.
Past performance is no indication of future results. Investment in securities involves significant risk and has the potential for partial or complete loss of funds invested. It should not be assumed that any securities recommendations made by Navellier. in the future will be profitable or equal the performance of securities made in this report. Dividend payments are not guaranteed. The amount of a dividend payment, if any, can vary over time and issuers may reduce dividends paid on securities in the event of a recession or adverse event affecting a specific industry or issuer.
None of the stock information, data, and company information presented herein constitutes a recommendation by Navellier or a solicitation to buy or sell any securities. Any specific securities identified and described do not represent all of the securities purchased, sold, or recommended for advisory clients. The holdings identified do not represent all of the securities purchased, sold, or recommended for advisory clients and the reader should not assume that investments in the securities identified and discussed were or will be profitable.
Information presented is general information that does not take into account your individual circumstances, financial situation, or needs, nor does it present a personalized recommendation to you. Individual stocks presented may not be suitable for every investor. Investment in securities involves significant risk and has the potential for partial or complete loss of funds invested. Investment in fixed income securities has the potential for the investment return and principal value of an investment to fluctuate so that an investor’s holdings, when redeemed, may be worth less than their original cost.
One cannot invest directly in an index. Index is unmanaged and index performance does not reflect deduction of fees, expenses, or taxes. Presentation of Index data does not reflect a belief by Navellier that any stock index constitutes an investment alternative to any Navellier equity strategy or is necessarily comparable to such strategies. Among the most important differences between the Indices and Navellier strategies are that the Navellier equity strategies may (1) incur material management fees, (2) concentrate its investments in relatively few stocks, industries, or sectors, (3) have significantly greater trading activity and related costs, and (4) be significantly more or less volatile than the Indices.
ETF Risk: We may invest in exchange traded funds (“ETFs”) and some of our investment strategies are generally fully invested in ETFs. Like traditional mutual funds, ETFs charge asset-based fees, but they generally do not charge initial sales charges or redemption fees and investors typically pay only customary brokerage fees to buy and sell ETF shares. The fees and costs charged by ETFs held in client accounts will not be deducted from the compensation the client pays Navellier. ETF prices can fluctuate up or down, and a client account could lose money investing in an ETF if the prices of the securities owned by the ETF go down. ETFs are subject to additional risks:
- ETF shares may trade above or below their net asset value;
- An active trading market for an ETF’s shares may not develop or be maintained;
- The value of an ETF may be more volatile than the underlying portfolio of securities the ETF is designed to track;
- The cost of owning shares of the ETF may exceed those a client would incur by directly investing in the underlying securities; and
- Trading of an ETF’s shares may be halted if the listing exchange’s officials deem it appropriate, the shares are delisted from the exchange, or the activation of market-wide “circuit breakers” (which are tied to large decreases in stock prices) halts stock trading generally.
Grader Disclosures: Investment in equity strategies involves substantial risk and has the potential for partial or complete loss of funds invested. The sample portfolio and any accompanying charts are for informational purposes only and are not to be construed as a solicitation to buy or sell any financial instrument and should not be relied upon as the sole factor in an investment making decision. As a matter of normal and important disclosures to you, as a potential investor, please consider the following: The performance presented is not based on any actual securities trading, portfolio, or accounts, and the reported performance of the A, B, C, D, and F portfolios (collectively the “model portfolios”) should be considered mere “paper” or pro forma performance results based on Navellier’s research.
Investors evaluating any of Navellier & Associates, Inc.’s, (or its affiliates’) Investment Products must not use any information presented here, including the performance figures of the model portfolios, in their evaluation of any Navellier Investment Products. Navellier Investment Products include the firm’s mutual funds and managed accounts. The model portfolios, charts, and other information presented do not represent actual funded trades and are not actual funded portfolios. There are material differences between Navellier Investment Products’ portfolios and the model portfolios, research, and performance figures presented here. The model portfolios and the research results (1) may contain stocks or ETFs that are illiquid and difficult to trade; (2) may contain stock or ETF holdings materially different from actual funded Navellier Investment Product portfolios; (3) include the reinvestment of all dividends and other earnings, estimated trading costs, commissions, or management fees; and, (4) may not reflect prices obtained in an actual funded Navellier Investment Product portfolio. For these and other reasons, the reported performances of model portfolios do not reflect the performance results of Navellier’s actually funded and traded Investment Products. In most cases, Navellier’s Investment Products have materially lower performance results than the performances of the model portfolios presented.
This report contains statements that are, or may be considered to be, forward-looking statements. All statements that are not historical facts, including statements about our beliefs or expectations, are “forward-looking statements” within the meaning of The U.S. Private Securities Litigation Reform Act of 1995. These statements may be identified by such forward-looking terminology as “expect,” “estimate,” “plan,” “intend,” “believe,” “anticipate,” “may,” “will,” “should,” “could,” “continue,” “project,” or similar statements or variations of such terms. Our forward-looking statements are based on a series of expectations, assumptions, and projections, are not guarantees of future results or performance, and involve substantial risks and uncertainty as described in Form ADV Part 2A of our filing with the Securities and Exchange Commission (SEC), which is available at www.adviserinfo.sec.gov or by requesting a copy by emailing info@navellier.com. All of our forward-looking statements are as of the date of this report only. We can give no assurance that such expectations or forward-looking statements will prove to be correct. Actual results may differ materially. You are urged to carefully consider all such factors.
FEDERAL TAX ADVICE DISCLAIMER: As required by U.S. Treasury Regulations, you are informed that, to the extent this presentation includes any federal tax advice, the presentation is not written by Navellier to be used, and cannot be used, for the purpose of avoiding federal tax penalties. Navellier does not advise on any income tax requirements or issues. Use of any information presented by Navellier is for general information only and does not represent tax advice either express or implied. You are encouraged to seek professional tax advice for income tax questions and assistance.
IMPORTANT NEWSLETTER DISCLOSURE:The hypothetical performance results for investment newsletters that are authored or edited by Louis Navellier, including Louis Navellier’s Growth Investor, Louis Navellier’s Breakthrough Stocks, Louis Navellier’s Accelerated Profits, and Louis Navellier’s Platinum Club, are not based on any actual securities trading, portfolio, or accounts, and the newsletters’ reported hypothetical performances should be considered mere “paper” or proforma hypothetical performance results and are not actual performance of real world trades. Navellier & Associates, Inc. does not have any relation to or affiliation with the owner of these newsletters. There are material differences between Navellier Investment Products’ portfolios and the InvestorPlace Media, LLC newsletter portfolios authored by Louis Navellier. The InvestorPlace Media, LLC newsletters contain hypothetical performance that do not include transaction costs, advisory fees, or other fees a client might incur if actual investments and trades were being made by an investor. As a result, newsletter performance should not be used to evaluate Navellier Investment services which are separate and different from the newsletters. The owner of the newsletters is InvestorPlace Media, LLC and any questions concerning the newsletters, including any newsletter advertising or hypothetical Newsletter performance claims, (which are calculated solely by Investor Place Media and not Navellier) should be referred to InvestorPlace Media, LLC at (800) 718-8289.
Please note that Navellier & Associates and the Navellier Private Client Group are managed completely independent of the newsletters owned and published by InvestorPlace Media, LLC and written and edited by Louis Navellier, and investment performance of the newsletters should in no way be considered indicative of potential future investment performance for any Navellier & Associates separately managed account portfolio. Potential investors should consult with their financial advisor before investing in any Navellier Investment Product.
Navellier claims compliance with Global Investment Performance Standards (GIPS). To receive a complete list and descriptions of Navellier’s composites and/or a presentation that adheres to the GIPS standards, please contact Navellier or click here. It should not be assumed that any securities recommendations made by Navellier & Associates, Inc. in the future will be profitable or equal the performance of securities made in this report.
FactSet Disclosure: Navellier does not independently calculate the statistical information included in the attached report. The calculation and the information are provided by FactSet, a company not related to Navellier. Although information contained in the report has been obtained from FactSet and is based on sources Navellier believes to be reliable, Navellier does not guarantee its accuracy, and it may be incomplete or condensed. The report and the related FactSet sourced information are provided on an “as is” basis. The user assumes the entire risk of any use made of this information. Investors should consider the report as only a single factor in making their investment decision. The report is for informational purposes only and is not intended as an offer or solicitation for the purchase or sale of a security. FactSet sourced information is the exclusive property of FactSet. Without prior written permission of FactSet, this information may not be reproduced, disseminated or used to create any financial products. All indices are unmanaged and performance of the indices include reinvestment of dividends and interest income, unless otherwise noted, are not illustrative of any particular investment and an investment cannot be made in any index. Past performance is no guarantee of future results.