by Bryan Perry
May 23, 2023
Debt ceiling talks are ongoing and both sides have promised that there will be no default, yet the Parties are miles apart on terms. There is little time for brinksmanship, yet once again, it looks like the midnight oil is going to burn when procrastinators are pushed to the point of partial shutdowns to buy more time.
Turning to the markets, some beaten down sectors (energy, banks) are getting a bounce, but the focus of the bulls remains on big-cap tech, home building, and various special situations in the healthcare space, where there is some merger & acquisition action. A resolution to the debt ceiling, a Fed pause, some further proposed backstopping by the FDIC for regional banks, and a continuation of inflation trending lower opens the way for the market to maintain its recent range or even break higher as these clouds lift.
The jury is out on what, if any, kind of “landing” the U.S. economy will endure, but it’s safe to say there is both anecdotal and empirical evidence that the consumer is more watchful of their spending habits. There is no sugar-coating the numbers on how the consumer is spending. The numbers are trending lower.
As reported on May 12, the University of Michigan’s gauge of consumer sentiment fell to a preliminary May reading of 57.7, down from an April reading of 63.5. That is the lowest level since November 2022. Economists polled by The Wall Street Journal had expected a May reading of 63, a fairly substantial miss.
Inflation expectations are only down slightly in May. Americans now expect the inflation rate in the next year to average about 4.5%, down from a sharp surge to 4.6% in April from 3.6% in March. The more personal “Current Economic Conditions Index,” a gauge that measures what consumers think about their own financial situation in light of the current health of the economy, fell from 68.2 in April to 64.5 in May, and the Index of Consumer Expectations, another measure that asks about expectations for the next six months, moved down to 53.4 in May from 60.5 in the prior month. (Data from Marketwatch)
With the consumer caution flag now out, there is good reason for investors to check their stock and ETF holdings carefully, heading into what could be a period of extended uncertainty for the broad market.
In my view, the market has already priced in some form of a debt ceiling deal, as well as a Fed pause on a further rate hike at the upcoming June 14 FOMC meeting. I think it remains unclear as to whether the recent good news on inflation trending lower is anywhere near being considered “mission accomplished,” by all the previous Fed tightening moves. I also think the waters ahead for the regional banks will remain very choppy and worrisome if short-term rates remain at the 5.0%+ level for too long.
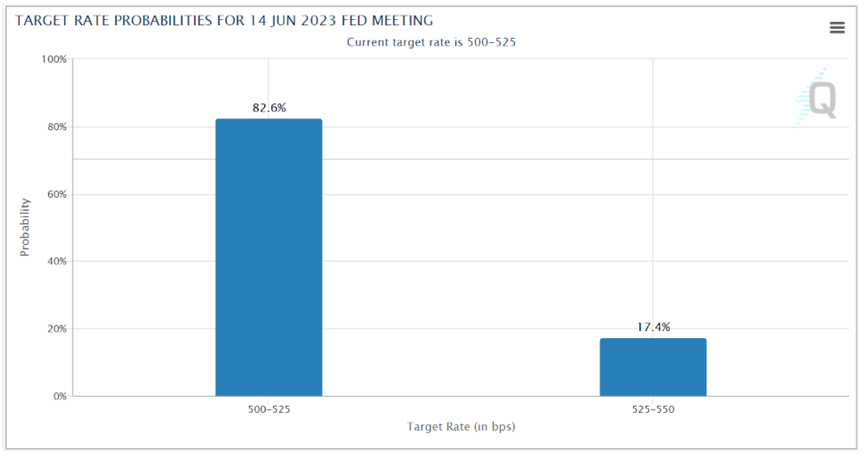
The current betting is almost 5-to-1 that the Fed will stand pat on rates in June (source: CMEgroup Fed Watch tool)
Graphs are for illustrative and discussion purposes only. Please read important disclosures at the end of this commentary.
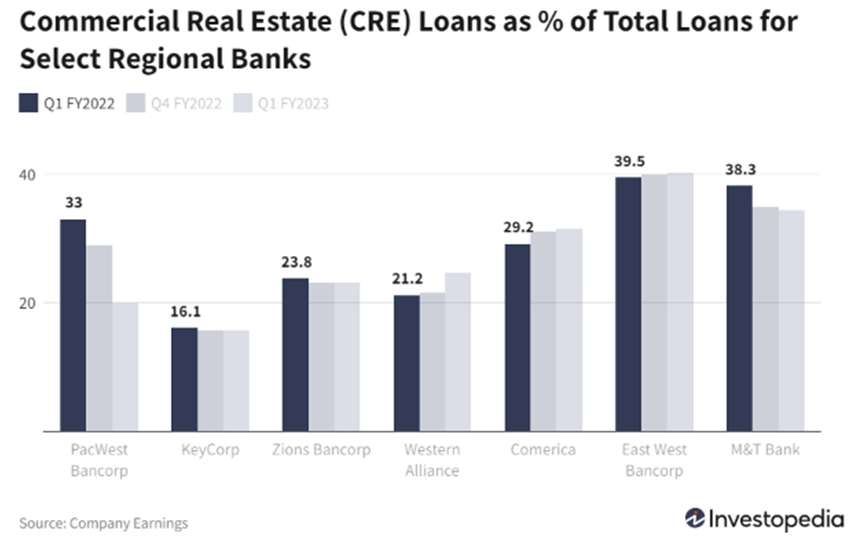
To get a handle on the numbers impacting regional and community banks regarding their commercial real estate exposure, you don’t have to look far to get the latest data. The most recent Financial Stability Report issued by the Fed clearly states that commercial real estate poses a clear and present danger, especially to smaller regional lenders exposed to the sector. Among the 60% of all commercial real estate (CRE) loans held by banks, more than two thirds are held by lenders with less than $100 billion in assets, as defined by the Fed. Collectively, they have nonfarm, nonresidential CRE loan portfolios totaling $1.55 trillion, of which $500 billion is invested in office and downtown commercial real estate.
Losses on CRE loans will depend on the borrower’s degree of leverage, as property owners with high equity cushions are less likely to default, according to the report. Also, banks that issue loans with higher loan-to-value (LTV) ratios are more likely to experience financial difficulty as these loans are harder to refinance or modify. When real estate prices fall, as they have in recent months, LTV ratios rise.
Graphs are for illustrative and discussion purposes only. Please read important disclosures at the end of this commentary.
Navellier & Associates does not PacWest Bancorp, KeyCorp, Zion Bancorp, Western Alliance, Comerica, East West Bancorp, or M&T Bank, in managed accounts. Bryan Perry does not own PacWest Bancorp, KeyCorp, Zion Bancorp, Western Alliance, Comerica, East West Bancorp, M&T Bank, personally.
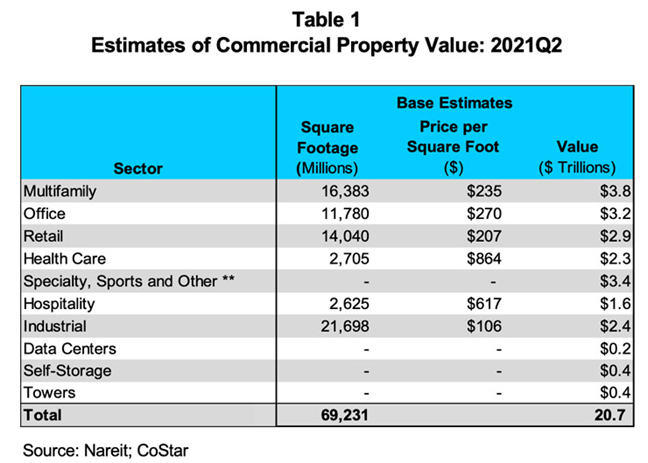
While many economists have warned about commercial real estate as a broad sector, most of the worst distress has been confined to office properties, which make up 24.2% of the $10+ trillion CRE market. Estimates vary widely on the total value. One estimate puts the CRE market over $20 trillion as of 2021.
Graphs are for illustrative and discussion purposes only. Please read important disclosures at the end of this commentary.
Mack Wilkowski of Investopedia (in “Fed Report Highlights Risk of Bank Exposure to Commercial Real Estate, May 10, 2023) reported on the concentration of bad loans in parts of this sector:
‘Among the categories of CRE, only offices—particularly those in big cities—are struggling right now due to the rise of remote work, along with certain retail properties like restaurants that depend on office workers,’ said Joseph Wang, CIO at MonetaryMacro.com. Loans on office properties are disproportionately issued by the smallest lenders, which have greater exposure to the sector than big banks and mid-sized regional lenders. ‘The smallest banks—those which few people have heard of—tend to be the most exposed to commercial real estate and are most at risk,’ Wang said. ‘I don’t believe this crisis is systemic, as big banks and even most regional lenders have little exposure,’ Wang added.”
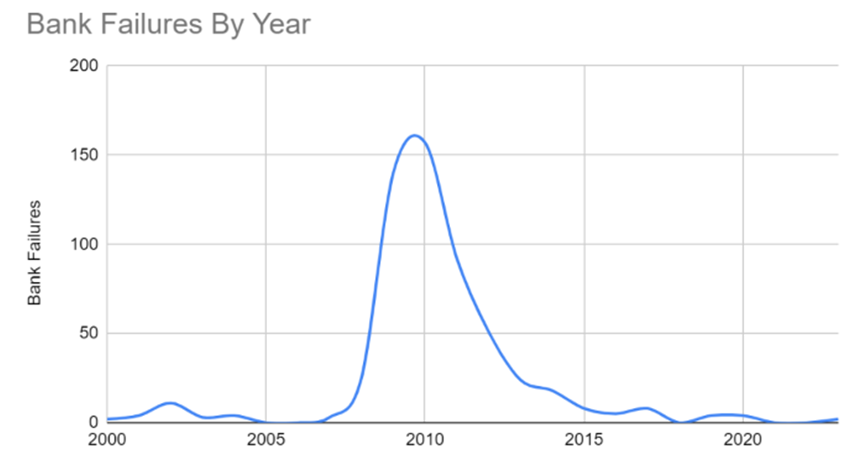
This last statement about big banks and regional lenders having little exposure should be somewhat gratifying to markets in the short-term, but unless rates come down significantly from current levels, refinancing office properties with high vacancy rates and low occupancy levels could trigger a wave of defaults. In the wake of the Great Recession of 2008-09, 140 banks failed in 2009, 157 in 2010, 92 in 2011, 51 in 2012, 24 in 2013, 18 in 2014, and about 5 per year thereafter average. Recently, 2021 and 2022 saw zero failures before this year’s three beached whales, SVB, Signature Bank, and First Republic.
Graphs are for illustrative and discussion purposes only. Please read important disclosures at the end of this commentary.
Source: Forbes (https://www.forbes.com/advisor/banking/list-of-failed-banks/)
Trepp, the leading research firm analyzing commercial real estate debt, has a front-row seat to the reckoning. Trepp says that about $270 billion in commercial real estate debt is coming due this year, which means that landlords will need to refinance their properties at today’s higher interest rates — and face significantly higher monthly payments. Roughly $80 billion, about 30%, are on office properties.
Rich Hill, head of real estate strategy at Cohen & Steers pointed out, “You have fundamentals under pressure from work from home at a time when lending is less available than over the last decade. Those two factors will lead to a pretty significant decline in valuations.
So, while some of the strife related to deposit outflows seems to have calmed, investors should brace for a wave of headlines regarding troubled or failed office property refinancing when properties are valued well below where they were when first financed years ago, against an environment of considerably higher rates and tighter loan terms. It is not an overnight problem – like a run on bank deposits – but it is one that looms exponentially larger in scope, scale, and potential risk to the banking system.
All content above represents the opinion of Bryan Perry of Navellier & Associates, Inc.
Also In This Issue
A Look Ahead by Louis Navellier
Global Leaders Fail to Lead (or Even Compromise)
Income Mail by Bryan Perry
Regional Banks Are Setting Up for a Summer of Tough Love
Growth Mail by Gary Alexander
In This “Age of Funemployment,” Is a Recession Possible?
Global Mail by Ivan Martchev
Narrow Market Breadth Continues to Concern Investors
Sector Spotlight by Jason Bodner
The Market’s “Doldrums” Are Well into Overtime
View Full Archive
Read Past Issues Here

Bryan Perry
SENIOR DIRECTOR
Bryan Perry is a Senior Director with Navellier Private Client Group, advising and facilitating high net worth investors in the pursuit of their financial goals.
Bryan’s financial services career spanning the past three decades includes over 20 years of wealth management experience with Wall Street firms that include Bear Stearns, Lehman Brothers and Paine Webber, working with both retail and institutional clients. Bryan earned a B.A. in Political Science from Virginia Polytechnic Institute & State University and currently holds a Series 65 license. All content of “Income Mail” represents the opinion of Bryan Perry
Important Disclosures:
Although information in these reports has been obtained from and is based upon sources that Navellier believes to be reliable, Navellier does not guarantee its accuracy and it may be incomplete or condensed. All opinions and estimates constitute Navellier’s judgment as of the date the report was created and are subject to change without notice. These reports are for informational purposes only and are not a solicitation for the purchase or sale of a security. Any decision to purchase securities mentioned in these reports must take into account existing public information on such securities or any registered prospectus.To the extent permitted by law, neither Navellier & Associates, Inc., nor any of its affiliates, agents, or service providers assumes any liability or responsibility nor owes any duty of care for any consequences of any person acting or refraining to act in reliance on the information contained in this communication or for any decision based on it.
Past performance is no indication of future results. Investment in securities involves significant risk and has the potential for partial or complete loss of funds invested. It should not be assumed that any securities recommendations made by Navellier. in the future will be profitable or equal the performance of securities made in this report. Dividend payments are not guaranteed. The amount of a dividend payment, if any, can vary over time and issuers may reduce dividends paid on securities in the event of a recession or adverse event affecting a specific industry or issuer.
None of the stock information, data, and company information presented herein constitutes a recommendation by Navellier or a solicitation to buy or sell any securities. Any specific securities identified and described do not represent all of the securities purchased, sold, or recommended for advisory clients. The holdings identified do not represent all of the securities purchased, sold, or recommended for advisory clients and the reader should not assume that investments in the securities identified and discussed were or will be profitable.
Information presented is general information that does not take into account your individual circumstances, financial situation, or needs, nor does it present a personalized recommendation to you. Individual stocks presented may not be suitable for every investor. Investment in securities involves significant risk and has the potential for partial or complete loss of funds invested. Investment in fixed income securities has the potential for the investment return and principal value of an investment to fluctuate so that an investor’s holdings, when redeemed, may be worth less than their original cost.
One cannot invest directly in an index. Index is unmanaged and index performance does not reflect deduction of fees, expenses, or taxes. Presentation of Index data does not reflect a belief by Navellier that any stock index constitutes an investment alternative to any Navellier equity strategy or is necessarily comparable to such strategies. Among the most important differences between the Indices and Navellier strategies are that the Navellier equity strategies may (1) incur material management fees, (2) concentrate its investments in relatively few stocks, industries, or sectors, (3) have significantly greater trading activity and related costs, and (4) be significantly more or less volatile than the Indices.
ETF Risk: We may invest in exchange traded funds (“ETFs”) and some of our investment strategies are generally fully invested in ETFs. Like traditional mutual funds, ETFs charge asset-based fees, but they generally do not charge initial sales charges or redemption fees and investors typically pay only customary brokerage fees to buy and sell ETF shares. The fees and costs charged by ETFs held in client accounts will not be deducted from the compensation the client pays Navellier. ETF prices can fluctuate up or down, and a client account could lose money investing in an ETF if the prices of the securities owned by the ETF go down. ETFs are subject to additional risks:
- ETF shares may trade above or below their net asset value;
- An active trading market for an ETF’s shares may not develop or be maintained;
- The value of an ETF may be more volatile than the underlying portfolio of securities the ETF is designed to track;
- The cost of owning shares of the ETF may exceed those a client would incur by directly investing in the underlying securities; and
- Trading of an ETF’s shares may be halted if the listing exchange’s officials deem it appropriate, the shares are delisted from the exchange, or the activation of market-wide “circuit breakers” (which are tied to large decreases in stock prices) halts stock trading generally.
Grader Disclosures: Investment in equity strategies involves substantial risk and has the potential for partial or complete loss of funds invested. The sample portfolio and any accompanying charts are for informational purposes only and are not to be construed as a solicitation to buy or sell any financial instrument and should not be relied upon as the sole factor in an investment making decision. As a matter of normal and important disclosures to you, as a potential investor, please consider the following: The performance presented is not based on any actual securities trading, portfolio, or accounts, and the reported performance of the A, B, C, D, and F portfolios (collectively the “model portfolios”) should be considered mere “paper” or pro forma performance results based on Navellier’s research.
Investors evaluating any of Navellier & Associates, Inc.’s, (or its affiliates’) Investment Products must not use any information presented here, including the performance figures of the model portfolios, in their evaluation of any Navellier Investment Products. Navellier Investment Products include the firm’s mutual funds and managed accounts. The model portfolios, charts, and other information presented do not represent actual funded trades and are not actual funded portfolios. There are material differences between Navellier Investment Products’ portfolios and the model portfolios, research, and performance figures presented here. The model portfolios and the research results (1) may contain stocks or ETFs that are illiquid and difficult to trade; (2) may contain stock or ETF holdings materially different from actual funded Navellier Investment Product portfolios; (3) include the reinvestment of all dividends and other earnings, estimated trading costs, commissions, or management fees; and, (4) may not reflect prices obtained in an actual funded Navellier Investment Product portfolio. For these and other reasons, the reported performances of model portfolios do not reflect the performance results of Navellier’s actually funded and traded Investment Products. In most cases, Navellier’s Investment Products have materially lower performance results than the performances of the model portfolios presented.
This report contains statements that are, or may be considered to be, forward-looking statements. All statements that are not historical facts, including statements about our beliefs or expectations, are “forward-looking statements” within the meaning of The U.S. Private Securities Litigation Reform Act of 1995. These statements may be identified by such forward-looking terminology as “expect,” “estimate,” “plan,” “intend,” “believe,” “anticipate,” “may,” “will,” “should,” “could,” “continue,” “project,” or similar statements or variations of such terms. Our forward-looking statements are based on a series of expectations, assumptions, and projections, are not guarantees of future results or performance, and involve substantial risks and uncertainty as described in Form ADV Part 2A of our filing with the Securities and Exchange Commission (SEC), which is available at www.adviserinfo.sec.gov or by requesting a copy by emailing info@navellier.com. All of our forward-looking statements are as of the date of this report only. We can give no assurance that such expectations or forward-looking statements will prove to be correct. Actual results may differ materially. You are urged to carefully consider all such factors.
FEDERAL TAX ADVICE DISCLAIMER: As required by U.S. Treasury Regulations, you are informed that, to the extent this presentation includes any federal tax advice, the presentation is not written by Navellier to be used, and cannot be used, for the purpose of avoiding federal tax penalties. Navellier does not advise on any income tax requirements or issues. Use of any information presented by Navellier is for general information only and does not represent tax advice either express or implied. You are encouraged to seek professional tax advice for income tax questions and assistance.
IMPORTANT NEWSLETTER DISCLOSURE:The hypothetical performance results for investment newsletters that are authored or edited by Louis Navellier, including Louis Navellier’s Growth Investor, Louis Navellier’s Breakthrough Stocks, Louis Navellier’s Accelerated Profits, and Louis Navellier’s Platinum Club, are not based on any actual securities trading, portfolio, or accounts, and the newsletters’ reported hypothetical performances should be considered mere “paper” or proforma hypothetical performance results and are not actual performance of real world trades. Navellier & Associates, Inc. does not have any relation to or affiliation with the owner of these newsletters. There are material differences between Navellier Investment Products’ portfolios and the InvestorPlace Media, LLC newsletter portfolios authored by Louis Navellier. The InvestorPlace Media, LLC newsletters contain hypothetical performance that do not include transaction costs, advisory fees, or other fees a client might incur if actual investments and trades were being made by an investor. As a result, newsletter performance should not be used to evaluate Navellier Investment services which are separate and different from the newsletters. The owner of the newsletters is InvestorPlace Media, LLC and any questions concerning the newsletters, including any newsletter advertising or hypothetical Newsletter performance claims, (which are calculated solely by Investor Place Media and not Navellier) should be referred to InvestorPlace Media, LLC at (800) 718-8289.
Please note that Navellier & Associates and the Navellier Private Client Group are managed completely independent of the newsletters owned and published by InvestorPlace Media, LLC and written and edited by Louis Navellier, and investment performance of the newsletters should in no way be considered indicative of potential future investment performance for any Navellier & Associates separately managed account portfolio. Potential investors should consult with their financial advisor before investing in any Navellier Investment Product.
Navellier claims compliance with Global Investment Performance Standards (GIPS). To receive a complete list and descriptions of Navellier’s composites and/or a presentation that adheres to the GIPS standards, please contact Navellier or click here. It should not be assumed that any securities recommendations made by Navellier & Associates, Inc. in the future will be profitable or equal the performance of securities made in this report.
FactSet Disclosure: Navellier does not independently calculate the statistical information included in the attached report. The calculation and the information are provided by FactSet, a company not related to Navellier. Although information contained in the report has been obtained from FactSet and is based on sources Navellier believes to be reliable, Navellier does not guarantee its accuracy, and it may be incomplete or condensed. The report and the related FactSet sourced information are provided on an “as is” basis. The user assumes the entire risk of any use made of this information. Investors should consider the report as only a single factor in making their investment decision. The report is for informational purposes only and is not intended as an offer or solicitation for the purchase or sale of a security. FactSet sourced information is the exclusive property of FactSet. Without prior written permission of FactSet, this information may not be reproduced, disseminated or used to create any financial products. All indices are unmanaged and performance of the indices include reinvestment of dividends and interest income, unless otherwise noted, are not illustrative of any particular investment and an investment cannot be made in any index. Past performance is no guarantee of future results.