by Bryan Perry
April 8, 2025
Those of us who contribute to Market-mail are required to submit these columns by Sunday afternoon, so we don’t have the luxury to react to how the market will trade on Monday – whether the current correction deepens, or the market begins to recover. Friday’s session, which saw the Dow drop 2,200 points felt like “capitulation day,” in that defensive stocks that were seeing bullish rotation were sold off aggressively.
Shares of utilities, consumer staples, gold, telecommunications, insurance providers, and, to some extent, healthcare REITs, all succumbed to the cascade of indiscriminate selling pressure by investors looking to raise cash going into the weekend. When defensive stocks start selling off aggressively, it can signal a market bottom, or several different things, depending on the broader market context.
Market bottoms are notoriously difficult to time, but watching investor sentiment, economic indicators, and earnings trends can provide clues. Investor sentiment is in the tank, economic indicators are stable, inflation ticked higher, and earnings are now on deck. In the S&P 500, 68 out of 107 companies that provided earnings guidance so far have issued negative EPS guidance, well above multi-year averages.
The swiftness with which the major indexes have declined, to where investors threw in the towel on the most defensive stocks Friday, following several weeks of steady selling, raised the question of whether a tradable bottom is in or if there is more downside ahead. One can look at this scenario in different ways:
- We May Be Near a Market Bottom: If defensive stocks are being sold alongside everything else, it could indicate capitulation – a time when investors panic and sell indiscriminately. This often happens near market bottoms, as fear peaks and liquidity dries up. Historically, broad-based selling, including defensive stocks, has sometimes preceded a rebound.
- Further Correction May Be Ahead: On the other hand, if defensive stocks are selling off while growth and cyclical stocks are already down, it might suggest investors are shifting out of safety and into cash, fearing deeper declines. This could indicate that the correction is still unfolding.
Here is a sample of how the largest market swings worked out last year, and in the last 45 years:
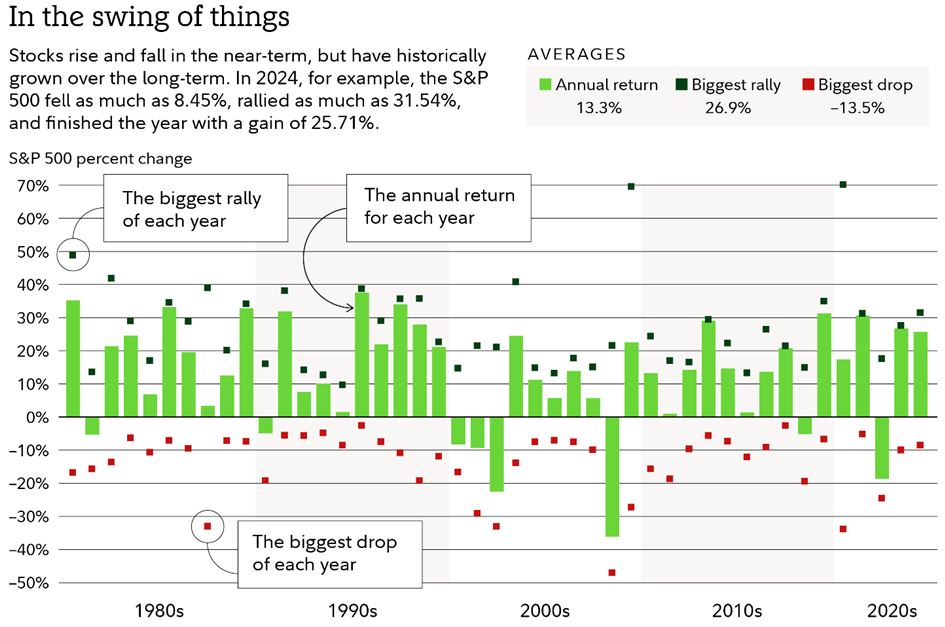
Sources: Standard & Poor’s, Bloomberg Finance L.P., Fidelity Investments.
Graphs are for illustrative and discussion purposes only. Please read important disclosures at the end of this commentary.
As a welcome relief from the tariff news, this week will usher in first-quarter earnings season, featuring results from money center banks on Friday, the first “tell” on the state of businesses and consumers.
For the next two weeks, companies will continue to report – relentlessly. At this point, the bar is very low, given the substantial declines in share prices that have now hit all 11 market sectors.
For the market to stabilize and attract buyers back into this fear-filled environment, one can assume that companies will have to address what level of impact tariffs will have on their businesses. To fail to include tariff-related guidance will invite further uncertainty and probably further selling pressure, so CEOs and their teams will have to take the time to crunch the financial scenarios that are specific to their businesses.
The level of uncertainty is sky-high, so earnings season will need to deliver a level of clarity that sends a clear message that tariffs are priced into this 17.5% correction for the S&P 500 from its peak of 6,147 on February 19 to Friday’s close of 5,074. Trading volume last Thursday and Friday was through the roof, typically a sign of real panic. The CBOE Volatility Index (VIX) exploded higher, closing at 45.31.
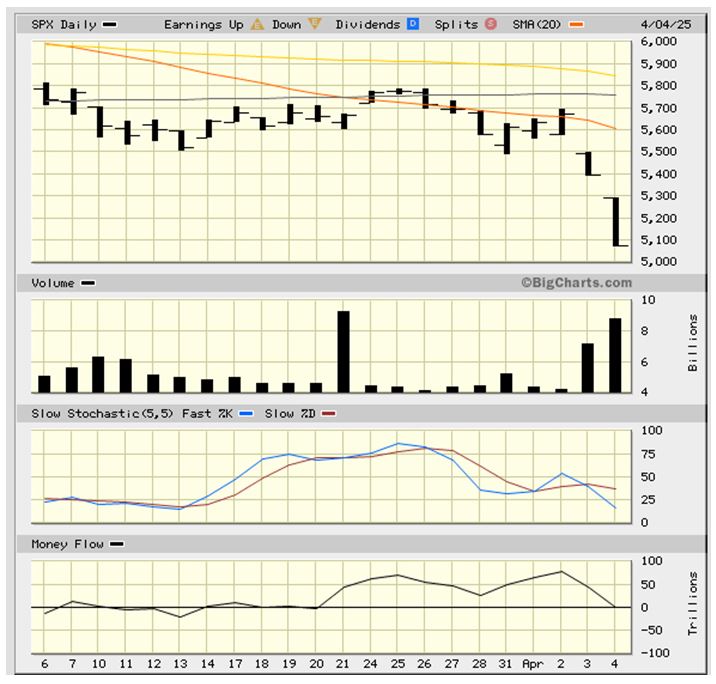
Source: bigcharts
Graphs are for illustrative and discussion purposes only. Please read important disclosures at the end of this commentary.
This kind of reaction has historically been the stuff of market bottoms. We’ll hope that history repeats itself and earnings season is the salve that heals a wounded bull. One other, maybe more important catalyst, would be some real give and take on tariffs – meaning agreements to radically lower tariffs.
Elon Musk has proposed that the U.S. and E.U. drop tariffs to zero and let free trade determine winners and losers. In theory, free trade is meant to eliminate tariffs and other trade barriers, allowing goods and services to move across borders without additional costs imposed by governments. However, in practice, free trade agreements (FTAs) can still include some tariffs, especially during transitional periods or for sensitive industries. Some FTAs gradually phase out tariffs rather than eliminating them immediately.
Certain industries, like agriculture or manufacturing, may have exceptions or protections built into agreements. If a country violates trade rules (like dumping products below cost), retaliatory tariffs can still be imposed even within a free trade framework. So, while free trade aims to minimize tariffs, real-world trade policies are often more nuanced. The main thing is to see the trend reverse course and start moving toward free trade being phased in, which would stop the bleeding and propel stocks higher.
All content above represents the opinion of Bryan Perry of Navellier & Associates, Inc.
Also In This Issue
A Look Ahead by Louis Navellier
Friday’s Jobs Report Was Bullish – On an Ultra-Bearish Market Day
Income Mail by Bryan Perry
Time to Brace for Earnings Season – And Much-Needed Tariff Guidance
Growth Mail by Gary Alexander
Trade Deficits are Not Like Budget Deficits…or Tariffs
Global Mail by Ivan Martchev
A High-Stakes Game of Tariff Chicken
Sector Spotlight by Jason Bodner
The Tariffs Will…Anyone? Anyone?… Raise or Lower Revenue?
View Full Archive
Read Past Issues Here

Bryan Perry
SENIOR DIRECTOR
Bryan Perry is a Senior Director with Navellier Private Client Group, advising and facilitating high net worth investors in the pursuit of their financial goals.
Bryan’s financial services career spanning the past three decades includes over 20-years of wealth management experience with Wall Street firms that include Bear Stearns, Lehman Brothers and Paine Webber, working with both retail and institutional clients. Bryan earned a B.A. in Political Science from Virginia Polytechnic Institute & State University and currently holds a Series 65 license. All content of “Income Mail” represents the opinion of Bryan Perry
Important Disclosures:
Although information in these reports has been obtained from and is based upon sources that Navellier believes to be reliable, Navellier does not guarantee its accuracy and it may be incomplete or condensed. All opinions and estimates constitute Navellier’s judgment as of the date the report was created and are subject to change without notice. These reports are for informational purposes only and are not a solicitation for the purchase or sale of a security. Any decision to purchase securities mentioned in these reports must take into account existing public information on such securities or any registered prospectus.To the extent permitted by law, neither Navellier & Associates, Inc., nor any of its affiliates, agents, or service providers assumes any liability or responsibility nor owes any duty of care for any consequences of any person acting or refraining to act in reliance on the information contained in this communication or for any decision based on it.
Past performance is no indication of future results. Investment in securities involves significant risk and has the potential for partial or complete loss of funds invested. It should not be assumed that any securities recommendations made by Navellier. in the future will be profitable or equal the performance of securities made in this report. Dividend payments are not guaranteed. The amount of a dividend payment, if any, can vary over time and issuers may reduce dividends paid on securities in the event of a recession or adverse event affecting a specific industry or issuer.
None of the stock information, data, and company information presented herein constitutes a recommendation by Navellier or a solicitation to buy or sell any securities. Any specific securities identified and described do not represent all of the securities purchased, sold, or recommended for advisory clients. The holdings identified do not represent all of the securities purchased, sold, or recommended for advisory clients and the reader should not assume that investments in the securities identified and discussed were or will be profitable.
Information presented is general information that does not take into account your individual circumstances, financial situation, or needs, nor does it present a personalized recommendation to you. Individual stocks presented may not be suitable for every investor. Investment in securities involves significant risk and has the potential for partial or complete loss of funds invested. Investment in fixed income securities has the potential for the investment return and principal value of an investment to fluctuate so that an investor’s holdings, when redeemed, may be worth less than their original cost.
One cannot invest directly in an index. Index is unmanaged and index performance does not reflect deduction of fees, expenses, or taxes. Presentation of Index data does not reflect a belief by Navellier that any stock index constitutes an investment alternative to any Navellier equity strategy or is necessarily comparable to such strategies. Among the most important differences between the Indices and Navellier strategies are that the Navellier equity strategies may (1) incur material management fees, (2) concentrate its investments in relatively few stocks, industries, or sectors, (3) have significantly greater trading activity and related costs, and (4) be significantly more or less volatile than the Indices.
ETF Risk: We may invest in exchange traded funds (“ETFs”) and some of our investment strategies are generally fully invested in ETFs. Like traditional mutual funds, ETFs charge asset-based fees, but they generally do not charge initial sales charges or redemption fees and investors typically pay only customary brokerage fees to buy and sell ETF shares. The fees and costs charged by ETFs held in client accounts will not be deducted from the compensation the client pays Navellier. ETF prices can fluctuate up or down, and a client account could lose money investing in an ETF if the prices of the securities owned by the ETF go down. ETFs are subject to additional risks:
- ETF shares may trade above or below their net asset value;
- An active trading market for an ETF’s shares may not develop or be maintained;
- The value of an ETF may be more volatile than the underlying portfolio of securities the ETF is designed to track;
- The cost of owning shares of the ETF may exceed those a client would incur by directly investing in the underlying securities; and
- Trading of an ETF’s shares may be halted if the listing exchange’s officials deem it appropriate, the shares are delisted from the exchange, or the activation of market-wide “circuit breakers” (which are tied to large decreases in stock prices) halts stock trading generally.
Grader Disclosures: Investment in equity strategies involves substantial risk and has the potential for partial or complete loss of funds invested. The sample portfolio and any accompanying charts are for informational purposes only and are not to be construed as a solicitation to buy or sell any financial instrument and should not be relied upon as the sole factor in an investment making decision. As a matter of normal and important disclosures to you, as a potential investor, please consider the following: The performance presented is not based on any actual securities trading, portfolio, or accounts, and the reported performance of the A, B, C, D, and F portfolios (collectively the “model portfolios”) should be considered mere “paper” or pro forma performance results based on Navellier’s research.
Investors evaluating any of Navellier & Associates, Inc.’s, (or its affiliates’) Investment Products must not use any information presented here, including the performance figures of the model portfolios, in their evaluation of any Navellier Investment Products. Navellier Investment Products include the firm’s mutual funds and managed accounts. The model portfolios, charts, and other information presented do not represent actual funded trades and are not actual funded portfolios. There are material differences between Navellier Investment Products’ portfolios and the model portfolios, research, and performance figures presented here. The model portfolios and the research results (1) may contain stocks or ETFs that are illiquid and difficult to trade; (2) may contain stock or ETF holdings materially different from actual funded Navellier Investment Product portfolios; (3) include the reinvestment of all dividends and other earnings, estimated trading costs, commissions, or management fees; and, (4) may not reflect prices obtained in an actual funded Navellier Investment Product portfolio. For these and other reasons, the reported performances of model portfolios do not reflect the performance results of Navellier’s actually funded and traded Investment Products. In most cases, Navellier’s Investment Products have materially lower performance results than the performances of the model portfolios presented.
This report contains statements that are, or may be considered to be, forward-looking statements. All statements that are not historical facts, including statements about our beliefs or expectations, are “forward-looking statements” within the meaning of The U.S. Private Securities Litigation Reform Act of 1995. These statements may be identified by such forward-looking terminology as “expect,” “estimate,” “plan,” “intend,” “believe,” “anticipate,” “may,” “will,” “should,” “could,” “continue,” “project,” or similar statements or variations of such terms. Our forward-looking statements are based on a series of expectations, assumptions, and projections, are not guarantees of future results or performance, and involve substantial risks and uncertainty as described in Form ADV Part 2A of our filing with the Securities and Exchange Commission (SEC), which is available at www.adviserinfo.sec.gov or by requesting a copy by emailing info@navellier.com. All of our forward-looking statements are as of the date of this report only. We can give no assurance that such expectations or forward-looking statements will prove to be correct. Actual results may differ materially. You are urged to carefully consider all such factors.
FEDERAL TAX ADVICE DISCLAIMER: As required by U.S. Treasury Regulations, you are informed that, to the extent this presentation includes any federal tax advice, the presentation is not written by Navellier to be used, and cannot be used, for the purpose of avoiding federal tax penalties. Navellier does not advise on any income tax requirements or issues. Use of any information presented by Navellier is for general information only and does not represent tax advice either express or implied. You are encouraged to seek professional tax advice for income tax questions and assistance.
IMPORTANT NEWSLETTER DISCLOSURE:The hypothetical performance results for investment newsletters that are authored or edited by Louis Navellier, including Louis Navellier’s Growth Investor, Louis Navellier’s Breakthrough Stocks, Louis Navellier’s Accelerated Profits, and Louis Navellier’s Platinum Club, are not based on any actual securities trading, portfolio, or accounts, and the newsletters’ reported hypothetical performances should be considered mere “paper” or proforma hypothetical performance results and are not actual performance of real world trades. Navellier & Associates, Inc. does not have any relation to or affiliation with the owner of these newsletters. There are material differences between Navellier Investment Products’ portfolios and the InvestorPlace Media, LLC newsletter portfolios authored by Louis Navellier. The InvestorPlace Media, LLC newsletters contain hypothetical performance that do not include transaction costs, advisory fees, or other fees a client might incur if actual investments and trades were being made by an investor. As a result, newsletter performance should not be used to evaluate Navellier Investment services which are separate and different from the newsletters. The owner of the newsletters is InvestorPlace Media, LLC and any questions concerning the newsletters, including any newsletter advertising or hypothetical Newsletter performance claims, (which are calculated solely by Investor Place Media and not Navellier) should be referred to InvestorPlace Media, LLC at (800) 718-8289.
Please note that Navellier & Associates and the Navellier Private Client Group are managed completely independent of the newsletters owned and published by InvestorPlace Media, LLC and written and edited by Louis Navellier, and investment performance of the newsletters should in no way be considered indicative of potential future investment performance for any Navellier & Associates separately managed account portfolio. Potential investors should consult with their financial advisor before investing in any Navellier Investment Product.
Navellier claims compliance with Global Investment Performance Standards (GIPS). To receive a complete list and descriptions of Navellier’s composites and/or a presentation that adheres to the GIPS standards, please contact Navellier or click here. It should not be assumed that any securities recommendations made by Navellier & Associates, Inc. in the future will be profitable or equal the performance of securities made in this report.
FactSet Disclosure: Navellier does not independently calculate the statistical information included in the attached report. The calculation and the information are provided by FactSet, a company not related to Navellier. Although information contained in the report has been obtained from FactSet and is based on sources Navellier believes to be reliable, Navellier does not guarantee its accuracy, and it may be incomplete or condensed. The report and the related FactSet sourced information are provided on an “as is” basis. The user assumes the entire risk of any use made of this information. Investors should consider the report as only a single factor in making their investment decision. The report is for informational purposes only and is not intended as an offer or solicitation for the purchase or sale of a security. FactSet sourced information is the exclusive property of FactSet. Without prior written permission of FactSet, this information may not be reproduced, disseminated or used to create any financial products. All indices are unmanaged and performance of the indices include reinvestment of dividends and interest income, unless otherwise noted, are not illustrative of any particular investment and an investment cannot be made in any index. Past performance is no guarantee of future results.