by Jason Bodner
April 8, 2025
There was a classic scene from the 1986 movie Ferris Bueller’s Day Off, in which the high school teacher (played by economist Ben Stein) was talking to a bored class of teens about the effects of tariffs in 1930.
“In 1930, the Republican-controlled House of Representatives in an effort to alleviate the effects of the…. Anyone? Anyone? – the Great Depression, passed the… Anyone? Anyone? the tariff bill – the Hawley Smoot Tarriff Act which, Anyone? Raised or lowered? Raised tariffs in an effort to collect more revenue for the federal government. Did it work? Anyone? Anyone know the effects? It did not work, and the United States sank deeper into the Great Depression.”
Well, this time the teacher is our President, and no one in the chattering class was disinterested.

Even my kids know what’s going on with the tariff on their favorite products. They know that the price of the new Nintendo Switch in Japan will be $300, and in the U.S., the price will be $450 – a 50% tariff.
The idea behind the Smoot-Hawley Tariff Act of 1930 was to protect American jobs during the Great Depression. It raised tariffs on over 20,000 imported goods, trying to shield domestic industries from foreign competition by making imported goods more expensive. But a global trade war ensued, and international trade plummeted. The act is often blamed for worsening the downturn of the depression.
Countries turned inward and trade barriers soared.
That doesn’t bode well for Trump’s latest announcements. Markets reacted very poorly on April 3rd and 4th, down over 10% in two days. There are, however, key differences between 1930 and 2025, not the least of which we are not in a Great Depression. Recession odds are climbing, but we are not there yet.
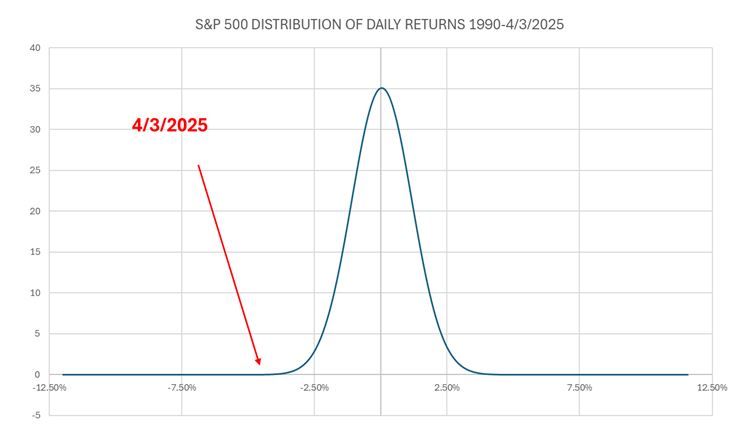
Let’s contextualize April 3rd’s shocking -4.84% drop in the S&P 500. If we plot each daily return for the S&P 500 on a histogram, we can see how rare it was. It is a rare event, indeed – either a two or three standard deviation event, depending on whether extreme events are discarded as noise:
Graphs are for illustrative and discussion purposes only. Please read important disclosures at the end of this commentary.
Put another way, last Thursday was the 25th worst day in over 34 years of the S&P 500’s history of 8,854 observed days. In other words, 99.7% of market days since 1990 were better, and Friday was worse, -6%!
The questions on everyone’s mind are: When will this end? And when will we recover?
My crystal ball is in the shop for repairs, so what I’ll do, like always, is turn to history for answers. I delved into the data of all of those 8,854 days to arrive at the graphs above. We already know it was a rare day, indeed. Unfortunately, today is not looking much better.
But there is a patch of blue sky in this storm if you look for it.
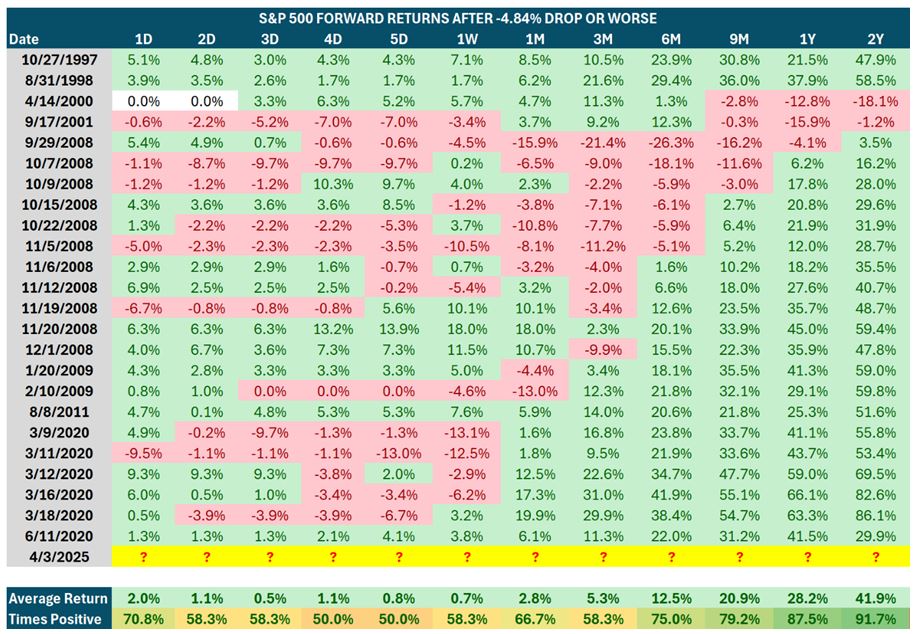
First, let’s look at all days that were as bad or worse. Here they are:
Graphs are for illustrative and discussion purposes only. Please read important disclosures at the end of this commentary.
Here are the main takeaways:
- The next five trading days are usually volatile: While the average returns are higher, the rate at which the market is up after five days is just 50%, like a coin flip, 50/50.
- One week later, the S&P is slightly higher 58% of the time, so there is no real good news to report there.
- Long-term predictions have a higher success rate than the immediate term. Since 2009, as you can see above, 3-, 6-, 9-months, 1-year, and 2-years later, stocks were higher 100% of the time.
In another view of the same chart, I’ll highlight the environment at the time of the big market drop:

Graphs are for illustrative and discussion purposes only. Please read important disclosures at the end of this commentary.
In my opinion, the environment closest to the economic uncertainty sewn by the high-tariff threats last week is the 2011 European Sovereign Debt Crisis. All other events were driven either by extreme greed, terrorism, or a once-in-a-century global pandemic. While Wednesday’s tariff announcements have serious potential consequences, I don’t think the announcement is on par with any of those events.
Last Thursday’s down day had an immense number of outflow signals in my data – totaling 606.

Graphs are for illustrative and discussion purposes only. Please read important disclosures at the end of this commentary.
For context, the average daily outflow signal since 1990 is 36.8, so April 3rd was 16.5 times the 34-year average. We haven’t seen selling like this since the darkest days of COVID-19 five years ago.
Looking at all days of this level of outflows, or worse, we see 20 instances including April 3rd. Again, 99.7% of all days since 1990 were better. The days were the same time periods of heavy market uncertainty. This will, of course, reduce the cost of consumer debt and adjustable-rate mortgages.
The cost of gasoline is also immensely cheaper. Oil has fallen 23%, to under $62, from its January peak of $80 to $61.80. That means filling up at the pump is cheaper now. During this storm of negative press criticism over tariffs, I believe Trump will roll out tax cut proposals for individuals and corporations.
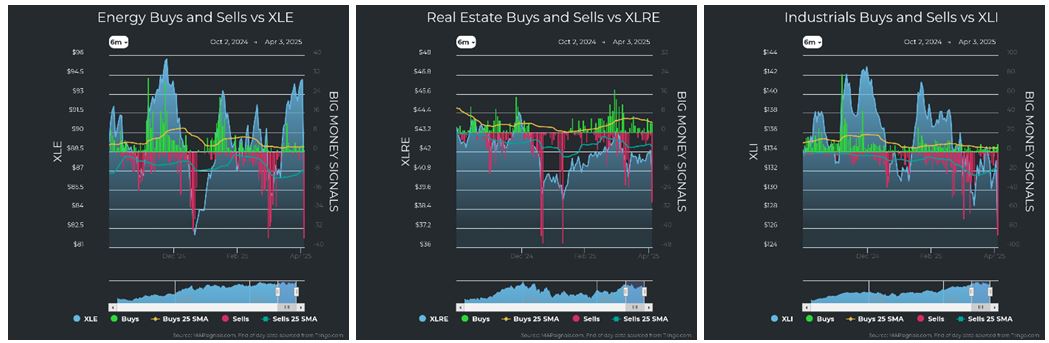
These combined effects alone, with a dollar that is likely to strengthen, means the consumer may feel the tariffs far less than the initial reaction assumes. A rallying dollar would absorb most of the sensation of a 10% tariff to the consumer. Most sectors feel the burn although some are more resilient than others:
![]()
Graphs are for illustrative and discussion purposes only. Please read important disclosures at the end of this commentary.


Graphs are for illustrative and discussion purposes only. Please read important disclosures at the end of this commentary.
These times are definitely not fun, nor did I expect them to be this bad. Everyone was caught off-guard, which is exactly how President Trump likes it, but the good news is that history is on our side.
Face the future with bravery, for as Seneca said: “He who is brave is free.”
All content above represents the opinion of Jason Bodner of Navellier & Associates, Inc.
Also In This Issue
A Look Ahead by Louis Navellier
Friday’s Jobs Report Was Bullish – On an Ultra-Bearish Market Day
Income Mail by Bryan Perry
Time to Brace for Earnings Season – And Much-Needed Tariff Guidance
Growth Mail by Gary Alexander
Trade Deficits are Not Like Budget Deficits…or Tariffs
Global Mail by Ivan Martchev
A High-Stakes Game of Tariff Chicken
Sector Spotlight by Jason Bodner
The Tariffs Will…Anyone? Anyone?… Raise or Lower Revenue?
View Full Archive
Read Past Issues Here

Jason Bodner
MARKETMAIL EDITOR FOR SECTOR SPOTLIGHT
Jason Bodner writes Sector Spotlight in the weekly Marketmail publication and has authored several white papers for the company. He is also Co-Founder of Macro Analytics for Professionals which produces proprietary equity accumulation and distribution research for its clients. Previously, Mr. Bodner served as Director of European Equity Derivatives for Cantor Fitzgerald Europe in London, then moved to the role of Head of Equity Derivatives North America for the same company in New York. He also served as S.V.P. Equity Derivatives for Jefferies, LLC. He received a B.S. in business administration in 1996, with honors, from Skidmore College as a member of the Periclean Honors Society. All content of “Sector Spotlight” represents the opinion of Jason Bodner
Important Disclosures:
Jason Bodner is a co-founder and co-owner of Mapsignals. Mr. Bodner is an independent contractor who is occasionally hired by Navellier & Associates to write an article and or provide opinions for possible use in articles that appear in Navellier & Associates weekly Market Mail. Mr. Bodner is not employed or affiliated with Louis Navellier, Navellier & Associates, Inc., or any other Navellier owned entity. The opinions and statements made here are those of Mr. Bodner and not necessarily those of any other persons or entities. This is not an endorsement, or solicitation or testimonial or investment advice regarding the BMI Index or any statements or recommendations or analysis in the article or the BMI Index or Mapsignals or its products or strategies.
Although information in these reports has been obtained from and is based upon sources that Navellier believes to be reliable, Navellier does not guarantee its accuracy and it may be incomplete or condensed. All opinions and estimates constitute Navellier’s judgment as of the date the report was created and are subject to change without notice. These reports are for informational purposes only and are not a solicitation for the purchase or sale of a security. Any decision to purchase securities mentioned in these reports must take into account existing public information on such securities or any registered prospectus.To the extent permitted by law, neither Navellier & Associates, Inc., nor any of its affiliates, agents, or service providers assumes any liability or responsibility nor owes any duty of care for any consequences of any person acting or refraining to act in reliance on the information contained in this communication or for any decision based on it.
Past performance is no indication of future results. Investment in securities involves significant risk and has the potential for partial or complete loss of funds invested. It should not be assumed that any securities recommendations made by Navellier. in the future will be profitable or equal the performance of securities made in this report. Dividend payments are not guaranteed. The amount of a dividend payment, if any, can vary over time and issuers may reduce dividends paid on securities in the event of a recession or adverse event affecting a specific industry or issuer.
None of the stock information, data, and company information presented herein constitutes a recommendation by Navellier or a solicitation to buy or sell any securities. Any specific securities identified and described do not represent all of the securities purchased, sold, or recommended for advisory clients. The holdings identified do not represent all of the securities purchased, sold, or recommended for advisory clients and the reader should not assume that investments in the securities identified and discussed were or will be profitable.
Information presented is general information that does not take into account your individual circumstances, financial situation, or needs, nor does it present a personalized recommendation to you. Individual stocks presented may not be suitable for every investor. Investment in securities involves significant risk and has the potential for partial or complete loss of funds invested. Investment in fixed income securities has the potential for the investment return and principal value of an investment to fluctuate so that an investor’s holdings, when redeemed, may be worth less than their original cost.
One cannot invest directly in an index. Index is unmanaged and index performance does not reflect deduction of fees, expenses, or taxes. Presentation of Index data does not reflect a belief by Navellier that any stock index constitutes an investment alternative to any Navellier equity strategy or is necessarily comparable to such strategies. Among the most important differences between the Indices and Navellier strategies are that the Navellier equity strategies may (1) incur material management fees, (2) concentrate its investments in relatively few stocks, industries, or sectors, (3) have significantly greater trading activity and related costs, and (4) be significantly more or less volatile than the Indices.
ETF Risk: We may invest in exchange traded funds (“ETFs”) and some of our investment strategies are generally fully invested in ETFs. Like traditional mutual funds, ETFs charge asset-based fees, but they generally do not charge initial sales charges or redemption fees and investors typically pay only customary brokerage fees to buy and sell ETF shares. The fees and costs charged by ETFs held in client accounts will not be deducted from the compensation the client pays Navellier. ETF prices can fluctuate up or down, and a client account could lose money investing in an ETF if the prices of the securities owned by the ETF go down. ETFs are subject to additional risks:
- ETF shares may trade above or below their net asset value;
- An active trading market for an ETF’s shares may not develop or be maintained;
- The value of an ETF may be more volatile than the underlying portfolio of securities the ETF is designed to track;
- The cost of owning shares of the ETF may exceed those a client would incur by directly investing in the underlying securities and;
- Trading of an ETF’s shares may be halted if the listing exchange’s officials deem it appropriate, the shares are delisted from the exchange, or the activation of market-wide “circuit breakers” (which are tied to large decreases in stock prices) halts stock trading generally.
Grader Disclosures: Investment in equity strategies involves substantial risk and has the potential for partial or complete loss of funds invested. The sample portfolio and any accompanying charts are for informational purposes only and are not to be construed as a solicitation to buy or sell any financial instrument and should not be relied upon as the sole factor in an investment making decision. As a matter of normal and important disclosures to you, as a potential investor, please consider the following: The performance presented is not based on any actual securities trading, portfolio, or accounts, and the reported performance of the A, B, C, D, and F portfolios (collectively the “model portfolios”) should be considered mere “paper” or pro forma performance results based on Navellier’s research.
Investors evaluating any of Navellier & Associates, Inc.’s, (or its affiliates’) Investment Products must not use any information presented here, including the performance figures of the model portfolios, in their evaluation of any Navellier Investment Products. Navellier Investment Products include the firm’s mutual funds and managed accounts. The model portfolios, charts, and other information presented do not represent actual funded trades and are not actual funded portfolios. There are material differences between Navellier Investment Products’ portfolios and the model portfolios, research, and performance figures presented here. The model portfolios and the research results (1) may contain stocks or ETFs that are illiquid and difficult to trade; (2) may contain stock or ETF holdings materially different from actual funded Navellier Investment Product portfolios; (3) include the reinvestment of all dividends and other earnings, estimated trading costs, commissions, or management fees; and, (4) may not reflect prices obtained in an actual funded Navellier Investment Product portfolio. For these and other reasons, the reported performances of model portfolios do not reflect the performance results of Navellier’s actually funded and traded Investment Products. In most cases, Navellier’s Investment Products have materially lower performance results than the performances of the model portfolios presented.
This report contains statements that are, or may be considered to be, forward-looking statements. All statements that are not historical facts, including statements about our beliefs or expectations, are “forward-looking statements” within the meaning of The U.S. Private Securities Litigation Reform Act of 1995. These statements may be identified by such forward-looking terminology as “expect,” “estimate,” “plan,” “intend,” “believe,” “anticipate,” “may,” “will,” “should,” “could,” “continue,” “project,” or similar statements or variations of such terms. Our forward-looking statements are based on a series of expectations, assumptions, and projections, are not guarantees of future results or performance, and involve substantial risks and uncertainty as described in Form ADV Part 2A of our filing with the Securities and Exchange Commission (SEC), which is available at www.adviserinfo.sec.gov or by requesting a copy by emailing info@navellier.com. All of our forward-looking statements are as of the date of this report only. We can give no assurance that such expectations or forward-looking statements will prove to be correct. Actual results may differ materially. You are urged to carefully consider all such factors.
FEDERAL TAX ADVICE DISCLAIMER: As required by U.S. Treasury Regulations, you are informed that, to the extent this presentation includes any federal tax advice, the presentation is not written by Navellier to be used, and cannot be used, for the purpose of avoiding federal tax penalties. Navellier does not advise on any income tax requirements or issues. Use of any information presented by Navellier is for general information only and does not represent tax advice either express or implied. You are encouraged to seek professional tax advice for income tax questions and assistance.
IMPORTANT NEWSLETTER DISCLOSURE:The hypothetical performance results for investment newsletters that are authored or edited by Louis Navellier, including Louis Navellier’s Growth Investor, Louis Navellier’s Breakthrough Stocks, Louis Navellier’s Accelerated Profits, and Louis Navellier’s Platinum Club, are not based on any actual securities trading, portfolio, or accounts, and the newsletters’ reported hypothetical performances should be considered mere “paper” or proforma hypothetical performance results and are not actual performance of real world trades. Navellier & Associates, Inc. does not have any relation to or affiliation with the owner of these newsletters. There are material differences between Navellier Investment Products’ portfolios and the InvestorPlace Media, LLC newsletter portfolios authored by Louis Navellier. The InvestorPlace Media, LLC newsletters contain hypothetical performance that do not include transaction costs, advisory fees, or other fees a client might incur if actual investments and trades were being made by an investor. As a result, newsletter performance should not be used to evaluate Navellier Investment services which are separate and different from the newsletters. The owner of the newsletters is InvestorPlace Media, LLC and any questions concerning the newsletters, including any newsletter advertising or hypothetical Newsletter performance claims, (which are calculated solely by Investor Place Media and not Navellier) should be referred to InvestorPlace Media, LLC at (800) 718-8289.
Please note that Navellier & Associates and the Navellier Private Client Group are managed completely independent of the newsletters owned and published by InvestorPlace Media, LLC and written and edited by Louis Navellier, and investment performance of the newsletters should in no way be considered indicative of potential future investment performance for any Navellier & Associates separately managed account portfolio. Potential investors should consult with their financial advisor before investing in any Navellier Investment Product.
Navellier claims compliance with Global Investment Performance Standards (GIPS). To receive a complete list and descriptions of Navellier’s composites and/or a presentation that adheres to the GIPS standards, please contact Navellier or click here. It should not be assumed that any securities recommendations made by Navellier & Associates, Inc. in the future will be profitable or equal the performance of securities made in this report.
FactSet Disclosure: Navellier does not independently calculate the statistical information included in the attached report. The calculation and the information are provided by FactSet, a company not related to Navellier. Although information contained in the report has been obtained from FactSet and is based on sources Navellier believes to be reliable, Navellier does not guarantee its accuracy, and it may be incomplete or condensed. The report and the related FactSet sourced information are provided on an “as is” basis. The user assumes the entire risk of any use made of this information. Investors should consider the report as only a single factor in making their investment decision. The report is for informational purposes only and is not intended as an offer or solicitation for the purchase or sale of a security. FactSet sourced information is the exclusive property of FactSet. Without prior written permission of FactSet, this information may not be reproduced, disseminated or used to create any financial products. All indices are unmanaged and performance of the indices include reinvestment of dividends and interest income, unless otherwise noted, are not illustrative of any particular investment and an investment cannot be made in any index. Past performance is no guarantee of future results.