by Bryan Perry
April 18, 2023
Opinions about how the first-quarter earnings season will play out are very mixed. There are those who believe the market’s resiliency is about to get a major wake-up call, where profits and guidance will sorely disappoint, and there are just as many who believe that companies will deliver top- and bottom-line results that surprise to the upside, despite some recent softer data on retail sales and manufacturing.
The parade of Q1 earnings officially kicked off last Friday, and it looked like a very good start to the reporting season. Major money center banks, led by JPMorgan Chase & Co. (JPM), did not disappoint, enjoying huge deposit inflows from the regional banks. “The Empire strikes back,” quipped Jason Goldberg, a senior research analyst at Barclays. As depositors and other market participants responded to regional bank uncertainty in recent weeks, he added, “There’s been a flight to bigness,” and Chase is BIG.
Although big banks posted record revenues, they issued a cautious note about recent stress in the financial sector and the negative impact it could have on future lending. Considering their guarded outlook, JPM rallied with a few of the biggest banks showing bullish price action, which probably came as a surprise to many market participants. The real test will come when the regional banks report what’s really happening “under the hood” in the specifics of Held to Maturity (HTM) versus Available for Sale (AFS) securities.
More banks and brokerages are shifting AFS assets to the HTM side of their balance sheets, as HTM securities are not “marked to market,” but this accounting maneuver, which looks better when earnings are released, doesn’t fix the underlying problem if there is a bank run. Even with the Treasury and the Fed creating a $2 trillion Bank Term Funding Program (BTFP), following the collapse of SVB, that virtually guarantees 100% of deposits above $250k, it has done little to bring buyers back to regional bank stocks.
Contrary to a couple of money center banks, price action in regional banks is downright disturbing, as they retreated back to levels not seen since the outbreak of Covid-19. More disturbing, one would have thought that end-of-quarter window dressing in late March would have seen most fund managers erasing their exposure to this troubled sector. But heading into the third week of April, average daily volume is still brisk, as seen by this chart of the S&P Regional Banking ETF SPDR (KRE), implying little if any support, even with some Wall Street upgrades on the basis of babies getting thrown out with bathwater.
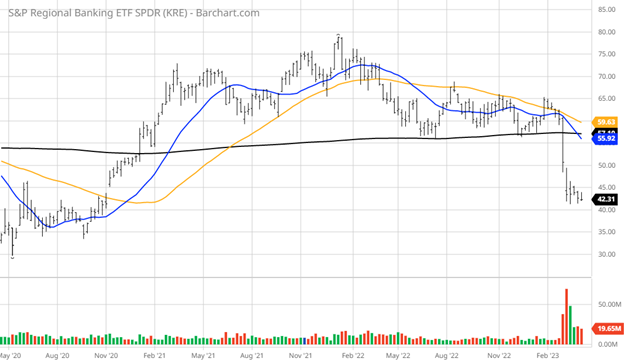
Graphs are for illustrative and discussion purposes only. Please read important disclosures at the end of this commentary.
When paper losses-per-share of current stock prices are carved out and brought to light, it is no wonder the price action is so bearish. While many factors impact the valuation of a bank stock, here is a list of banks with their unrealized loss per share compared to their stock price as of March 12 (from “A List of Some Banks And Their Shocking Paper Losses on Debt Securities Holdings,” Seeking Alpha, March 12, 2023) that gives some hard insight as to the extent of the problem banks are facing, and the impending risks if bond yields start climbing again.
Citigroup (C) loss per share ($16.02), 33% of stock price
AFS $256,608 million cost – $249,679 million fair value = $5,929 million loss
HTM $268,863 million cost – $243,648 million fair value = $25,215 million loss
*Total loss $31,144 million
(AFS = Available for Sale accounting; HTM = Held to Maturity (HTM) accounting)
JPMorgan Chase (JPM) loss per share ($16.00), 12% of stock price
AFS $216,217 million cost – $205,857 million fair value = $10,360 million loss
HTM $425,372 million cost – $388,648 million fair value = $36,724 million loss
*Total loss $47,084 million
Signature Bank (SBNY) loss per share ($51.44), 73% of stock price
AFS $21,071 million cost – $18,594 million fair value = $2,477 million loss
HTM $7,780 million cost – $7,018 million fair value = $762 million loss
*Total loss $3,239 million
U.S. Bancorp (USB) loss per share ($12.68), 31% of stock price
AFS $81,450 million cost – $72,910 million fair value = $8,540 million loss
HTM $88,740 million cost – $77,874 million fair value = $10,866 million loss
*Total loss $19,406 million
First Republic Bank (FRC) loss per share ($28.15), 34% of stock price
AFS $3,817 million cost – $3,347 million fair value = $470 million loss
HTM $28,359 million cost – $23,587 million fair value = $4,772 million loss
*Total loss $5,242 million
Wells Fargo (WFC) loss per share ($13.09), 32% of stock price
AFS $121,725 million cost – $113,594 million fair value = $8,131 million loss
HTM $297,059 million cost – $255,521 million fair value = $41,538 million loss
*Total loss $49,669 million
Western Alliance Bancorp (WAL) loss per share ($9.61), 19% of stock price
AFS $7,973 million cost – $7,092 million fair value = $881 million loss
HTM $1,284 million cost – $1,112 million fair value =$172 million loss
*Total loss $1,053 million
Bank of America (BAC) loss per share ($14.28), 47% of stock price
AFS $225,485 million cost – $220,788 million fair value = $5,697 million loss
HTM $632,863 million cost – $524,267 million fair value = $108,596 million loss
*Total Loss $114,293 million
PacWest Bancorp (PACW) loss per share ($8.25), 67% of stock price
AFS $5,655 million cost – $4,843 million fair value = $812 million loss
HTM $2,271 million cost – $2,110 million fair value = $161 million loss
*Total loss $973 million
Navellier & Associates does not own PacWest Bancorp (PACW), Bank of America (BAC), Western Alliance Bancorp (WAL), Wells Fargo (WFC), First Republic Bank (FRC), U.S. Bancorp (USB), Signature Bank (SBNY), JPMorgan Chase (JPM), and Citigroup (C), in Managed accounts. Bryan Perry does not personally own PacWest Bancorp (PACW), Bank of America (BAC), Western Alliance Bancorp (WAL), Wells Fargo (WFC), First Republic Bank (FRC), U.S. Bancorp (USB), Signature Bank (SBNY), JPMorgan Chase (JPM), and Citigroup (C).
This data comes from the respective banks’ latest 10-Ks that reflect December 31, 2022 numbers, before the quarter-point rate hike on February 1 and the second quarter-point rate hike on March 2 by the Federal Reserve, with another one possibly coming on May 1. These are glaring numbers and are only a small sample of what’s probably out there. I can only imagine the Q&A on the earnings calls with bank CEOs in the coming weeks, which may eventually result in the release of a movie the likes of Margin Call.
Thankfully, bond yields have come down recently, but they need to come down considerably more to plug some of the gaps created by the poor practice of locking in miniscule yields on long-date debt. Aside from JPMorgan Chase & Co., investors should consider bargain hunting in other sectors. Until the price action improves (rising share prices on rising volume), further downside is a very real risk. For income investors, as long as T-Bills are paying 5.0%, it’s hard to imagine this situation improving anytime soon.
All content above represents the opinion of Bryan Perry of Navellier & Associates, Inc.
Also In This Issue
A Look Ahead by Louis Navellier
The First-Quarter Earnings Outlook Remains “Mixed,” At Best
Income Mail by Bryan Perry
Massive Paper Losses Turn Banks into a “Zombie” Sector
Growth Mail by Gary Alexander
Investors Follow the Money While Politicians Fail at Basic Math
Global Mail by Ivan Martchev
What’s Behind the New 2023 VIX Closing Low?
Sector Spotlight by Jason Bodner
Finding Answers in Quiet Data Mining – Not Manic News Noise
View Full Archive
Read Past Issues Here

Bryan Perry
SENIOR DIRECTOR
Bryan Perry is a Senior Director with Navellier Private Client Group, advising and facilitating high net worth investors in the pursuit of their financial goals.
Bryan’s financial services career spanning the past three decades includes over 20 years of wealth management experience with Wall Street firms that include Bear Stearns, Lehman Brothers and Paine Webber, working with both retail and institutional clients. Bryan earned a B.A. in Political Science from Virginia Polytechnic Institute & State University and currently holds a Series 65 license. All content of “Income Mail” represents the opinion of Bryan Perry
Important Disclosures:
Although information in these reports has been obtained from and is based upon sources that Navellier believes to be reliable, Navellier does not guarantee its accuracy and it may be incomplete or condensed. All opinions and estimates constitute Navellier’s judgment as of the date the report was created and are subject to change without notice. These reports are for informational purposes only and are not a solicitation for the purchase or sale of a security. Any decision to purchase securities mentioned in these reports must take into account existing public information on such securities or any registered prospectus.To the extent permitted by law, neither Navellier & Associates, Inc., nor any of its affiliates, agents, or service providers assumes any liability or responsibility nor owes any duty of care for any consequences of any person acting or refraining to act in reliance on the information contained in this communication or for any decision based on it.
Past performance is no indication of future results. Investment in securities involves significant risk and has the potential for partial or complete loss of funds invested. It should not be assumed that any securities recommendations made by Navellier. in the future will be profitable or equal the performance of securities made in this report. Dividend payments are not guaranteed. The amount of a dividend payment, if any, can vary over time and issuers may reduce dividends paid on securities in the event of a recession or adverse event affecting a specific industry or issuer.
None of the stock information, data, and company information presented herein constitutes a recommendation by Navellier or a solicitation to buy or sell any securities. Any specific securities identified and described do not represent all of the securities purchased, sold, or recommended for advisory clients. The holdings identified do not represent all of the securities purchased, sold, or recommended for advisory clients and the reader should not assume that investments in the securities identified and discussed were or will be profitable.
Information presented is general information that does not take into account your individual circumstances, financial situation, or needs, nor does it present a personalized recommendation to you. Individual stocks presented may not be suitable for every investor. Investment in securities involves significant risk and has the potential for partial or complete loss of funds invested. Investment in fixed income securities has the potential for the investment return and principal value of an investment to fluctuate so that an investor’s holdings, when redeemed, may be worth less than their original cost.
One cannot invest directly in an index. Index is unmanaged and index performance does not reflect deduction of fees, expenses, or taxes. Presentation of Index data does not reflect a belief by Navellier that any stock index constitutes an investment alternative to any Navellier equity strategy or is necessarily comparable to such strategies. Among the most important differences between the Indices and Navellier strategies are that the Navellier equity strategies may (1) incur material management fees, (2) concentrate its investments in relatively few stocks, industries, or sectors, (3) have significantly greater trading activity and related costs, and (4) be significantly more or less volatile than the Indices.
ETF Risk: We may invest in exchange traded funds (“ETFs”) and some of our investment strategies are generally fully invested in ETFs. Like traditional mutual funds, ETFs charge asset-based fees, but they generally do not charge initial sales charges or redemption fees and investors typically pay only customary brokerage fees to buy and sell ETF shares. The fees and costs charged by ETFs held in client accounts will not be deducted from the compensation the client pays Navellier. ETF prices can fluctuate up or down, and a client account could lose money investing in an ETF if the prices of the securities owned by the ETF go down. ETFs are subject to additional risks:
- ETF shares may trade above or below their net asset value;
- An active trading market for an ETF’s shares may not develop or be maintained;
- The value of an ETF may be more volatile than the underlying portfolio of securities the ETF is designed to track;
- The cost of owning shares of the ETF may exceed those a client would incur by directly investing in the underlying securities; and
- Trading of an ETF’s shares may be halted if the listing exchange’s officials deem it appropriate, the shares are delisted from the exchange, or the activation of market-wide “circuit breakers” (which are tied to large decreases in stock prices) halts stock trading generally.
Grader Disclosures: Investment in equity strategies involves substantial risk and has the potential for partial or complete loss of funds invested. The sample portfolio and any accompanying charts are for informational purposes only and are not to be construed as a solicitation to buy or sell any financial instrument and should not be relied upon as the sole factor in an investment making decision. As a matter of normal and important disclosures to you, as a potential investor, please consider the following: The performance presented is not based on any actual securities trading, portfolio, or accounts, and the reported performance of the A, B, C, D, and F portfolios (collectively the “model portfolios”) should be considered mere “paper” or pro forma performance results based on Navellier’s research.
Investors evaluating any of Navellier & Associates, Inc.’s, (or its affiliates’) Investment Products must not use any information presented here, including the performance figures of the model portfolios, in their evaluation of any Navellier Investment Products. Navellier Investment Products include the firm’s mutual funds and managed accounts. The model portfolios, charts, and other information presented do not represent actual funded trades and are not actual funded portfolios. There are material differences between Navellier Investment Products’ portfolios and the model portfolios, research, and performance figures presented here. The model portfolios and the research results (1) may contain stocks or ETFs that are illiquid and difficult to trade; (2) may contain stock or ETF holdings materially different from actual funded Navellier Investment Product portfolios; (3) include the reinvestment of all dividends and other earnings, estimated trading costs, commissions, or management fees; and, (4) may not reflect prices obtained in an actual funded Navellier Investment Product portfolio. For these and other reasons, the reported performances of model portfolios do not reflect the performance results of Navellier’s actually funded and traded Investment Products. In most cases, Navellier’s Investment Products have materially lower performance results than the performances of the model portfolios presented.
This report contains statements that are, or may be considered to be, forward-looking statements. All statements that are not historical facts, including statements about our beliefs or expectations, are “forward-looking statements” within the meaning of The U.S. Private Securities Litigation Reform Act of 1995. These statements may be identified by such forward-looking terminology as “expect,” “estimate,” “plan,” “intend,” “believe,” “anticipate,” “may,” “will,” “should,” “could,” “continue,” “project,” or similar statements or variations of such terms. Our forward-looking statements are based on a series of expectations, assumptions, and projections, are not guarantees of future results or performance, and involve substantial risks and uncertainty as described in Form ADV Part 2A of our filing with the Securities and Exchange Commission (SEC), which is available at www.adviserinfo.sec.gov or by requesting a copy by emailing info@navellier.com. All of our forward-looking statements are as of the date of this report only. We can give no assurance that such expectations or forward-looking statements will prove to be correct. Actual results may differ materially. You are urged to carefully consider all such factors.
FEDERAL TAX ADVICE DISCLAIMER: As required by U.S. Treasury Regulations, you are informed that, to the extent this presentation includes any federal tax advice, the presentation is not written by Navellier to be used, and cannot be used, for the purpose of avoiding federal tax penalties. Navellier does not advise on any income tax requirements or issues. Use of any information presented by Navellier is for general information only and does not represent tax advice either express or implied. You are encouraged to seek professional tax advice for income tax questions and assistance.
IMPORTANT NEWSLETTER DISCLOSURE:The hypothetical performance results for investment newsletters that are authored or edited by Louis Navellier, including Louis Navellier’s Growth Investor, Louis Navellier’s Breakthrough Stocks, Louis Navellier’s Accelerated Profits, and Louis Navellier’s Platinum Club, are not based on any actual securities trading, portfolio, or accounts, and the newsletters’ reported hypothetical performances should be considered mere “paper” or proforma hypothetical performance results and are not actual performance of real world trades. Navellier & Associates, Inc. does not have any relation to or affiliation with the owner of these newsletters. There are material differences between Navellier Investment Products’ portfolios and the InvestorPlace Media, LLC newsletter portfolios authored by Louis Navellier. The InvestorPlace Media, LLC newsletters contain hypothetical performance that do not include transaction costs, advisory fees, or other fees a client might incur if actual investments and trades were being made by an investor. As a result, newsletter performance should not be used to evaluate Navellier Investment services which are separate and different from the newsletters. The owner of the newsletters is InvestorPlace Media, LLC and any questions concerning the newsletters, including any newsletter advertising or hypothetical Newsletter performance claims, (which are calculated solely by Investor Place Media and not Navellier) should be referred to InvestorPlace Media, LLC at (800) 718-8289.
Please note that Navellier & Associates and the Navellier Private Client Group are managed completely independent of the newsletters owned and published by InvestorPlace Media, LLC and written and edited by Louis Navellier, and investment performance of the newsletters should in no way be considered indicative of potential future investment performance for any Navellier & Associates separately managed account portfolio. Potential investors should consult with their financial advisor before investing in any Navellier Investment Product.
Navellier claims compliance with Global Investment Performance Standards (GIPS). To receive a complete list and descriptions of Navellier’s composites and/or a presentation that adheres to the GIPS standards, please contact Navellier or click here. It should not be assumed that any securities recommendations made by Navellier & Associates, Inc. in the future will be profitable or equal the performance of securities made in this report.
FactSet Disclosure: Navellier does not independently calculate the statistical information included in the attached report. The calculation and the information are provided by FactSet, a company not related to Navellier. Although information contained in the report has been obtained from FactSet and is based on sources Navellier believes to be reliable, Navellier does not guarantee its accuracy, and it may be incomplete or condensed. The report and the related FactSet sourced information are provided on an “as is” basis. The user assumes the entire risk of any use made of this information. Investors should consider the report as only a single factor in making their investment decision. The report is for informational purposes only and is not intended as an offer or solicitation for the purchase or sale of a security. FactSet sourced information is the exclusive property of FactSet. Without prior written permission of FactSet, this information may not be reproduced, disseminated or used to create any financial products. All indices are unmanaged and performance of the indices include reinvestment of dividends and interest income, unless otherwise noted, are not illustrative of any particular investment and an investment cannot be made in any index. Past performance is no guarantee of future results.