by Gary Alexander
April 18, 2023
Now that we are entering the heart of earnings season, investors will “follow the money” of first-quarter corporate earnings and revenue reports, along with their best projections for future quarters. Everything depends on the bottom-line profits a company can deliver. How different this is from the political world.
Axios reported that math proficiency in Washington DC public schools, grades 3-12, decreased from an abysmal 31% in 2019 to a thoroughly rotten 19% in 2022, partly due to COVID closings, but it’s even worse in nearby Baltimore, where the Maryland Comprehensive Assessment Program (MCAP) revealed that 23 elementary, middle, and high schools couldn’t find even one student able to do math at grade level.
Those serving in Congress can’t do much better, if you go by recent pronouncements and actions. Let me give you just four examples that aren’t much in the headlines yet but will be big news by year’s end. They cover the most important financial challenges we face – deficits, inflation, jobs, and the dollar.
Math myth #1: We’re reducing the deficit. In his 2023 State of the Union address, President Biden said, “In the last two years, my administration has cut the deficit by more than $1.7 trillion – the largest deficit reduction in American history,” and, looking forward, he added, “I just signed a law to reduce the deficit by $114 billion by cracking down on wealthy tax cheats. That’s being fiscally responsible.” Those are a couple of Whoppers. It’s true that the post-COVID tax windfall brought in record tax receipts, but also record spending, so the deficit was lower than during COVID, but here’s the truth for this Fiscal Year:
- In the first half of Fiscal Year 2023 (October 1, 2022, to March 31, 2023), total federal spending rose by 13%, but revenues decreased 3%, resulting in a $1.1 trillion deficit (a $2.2 trillion annual rate), according to the U.S. Treasury. The rush in new spending resulted in large part from the inflationary Cost of Living Allowance (COLA) for Social Security (+10%) and Medicare Spending (+14%), but especially the 41% increases in the cost of servicing the national debt, due to the Fed’s rate increases.
With that in mind, Congress faces a debate on raising the debt ceiling this June. They better get realistic about their deficit math equations by then, or we’ll hear a chorus of “June is Busting Out All Over.”
Math myth #2: We’ve licked inflation, so let’s move on. The March Producer Price Index (PPI) was particularly soothing – down 0.5% in March and up only 2.7% in the past 12 months – pretty close to the Fed’s 2% goal – but alas, that number is backward-looking. Instead, let’s look at this April Fool’s Joke:
- On April 1, OPEC+ cut their combined crude oil production by 1.2 million barrels per day, and the price of crude oil quickly rose 9.3%, from $75.67 to $82.68 per barrel in two weeks.
- Gold shot up to near a record high, up 2% in April and silver is up 6% in April to $26 per ounce.
- Sugar prices are at a 10-year high, up 20.5% so far this year, through last Friday.
In addition, the Biden EPA has virtually guaranteed a huge rise, perhaps doubling, of the minerals needed for electric vehicles (EVs) and their batteries – cobalt (70% coming from the Congo, often from small, hand-dug mines by children), lithium (60% from China), and copper (40% from Peru and Chile, and 47% of the smelting coming from China). These are not stable sources, and the demand will be super-high.
Commodity price inflation could revive soon. If so, the PPI will soar, followed by an equivalent surge in the CPI. This will catch politicians and the Fed by surprise, just as the “transitory” inflation of 2021 did.
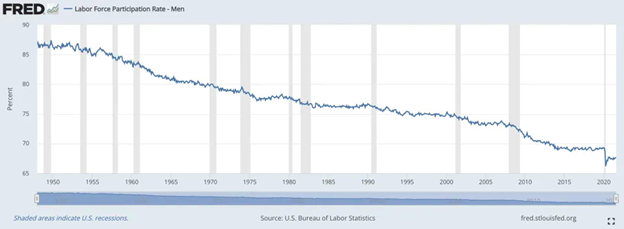
Math myth #3: The jobless rate is at an all-time low. The U.S. unemployment rate hit a 53-year low of 3.4% in January 2023 and it has been under 3.8% for over a year now, but that number only counts those “looking for a job” who allegedly can’t find one, even though over 10 million listed jobs were going unfilled during that time, unclaimed jobs. (That total is available in the JOLTS report each month).
February’s open job listings, according to economist Ed Yardeni, were in professional & business services (1.8 million), health care & social assistance (1.7 million), leisure & hospitality (1.5 million), retail trade (829,000), state & local government ex-education (535,000), transportation, warehousing & utilities (488,000), financial activities (476,000), durable goods manufacturing (475,000), and construction (412,000). But the Labor Force Participation Rate, at 62.6%, remained below its pre-Covid 63.3% rate, as men of working age have been dropping out of the Labor Force for decades – particularly since 2008, mostly due to alternative living arrangements and the rising array of benefits available for not working.
Graphs are for illustrative and discussion purposes only. Please read important disclosures at the end of this commentary.
Businesses all over America need help, but workers don’t want those jobs. How can there be a recession when jobs go begging? Until we reduce rewards for not working and value work, this trend will continue.
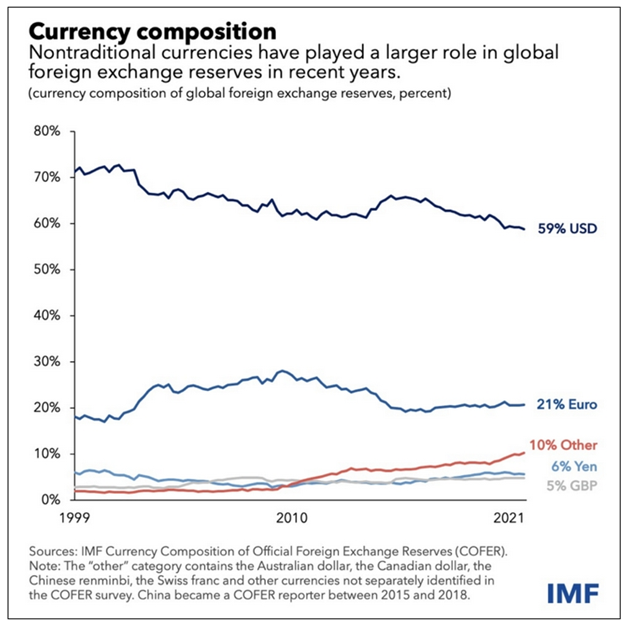
Math myth #4: The dollar is doomed, but compared to what? With currencies, it’s always a beauty contest, or rather a “least ugly” contest. Einstein’s Theory of Relativity applies. What paper money is better managed than the other guy’s paper? The dollar may be over-printed, at the moment, but compared to the euro, yen, yuan, British pound, and other contenders, who manages their paper currency better?
Graphs are for illustrative and discussion purposes only. Please read important disclosures at the end of this commentary.
In a greater sense, the world’s leading currency usually reflects the world’s strongest nation. As Dennis Gartman used to say at the New Orleans Investment Conference, “The U.S. has 11 aircraft carriers. China has just one. That’s why the Dollar is King.” Alas, his math no longer applies, as China is catching up fast in the Naval department, but that gain comes at great cost. China’s debt-to-GDP ratio exceeds ours, if you count all their ambitious off-the-books military expansion and Belt and Road managed economic projects.
The Economist reminds us (this week, in “Riding High”) that “America’s dominance of the rich world is startling. Today it accounts for 58% of the G7’s GDP, compared with 40% in 1990. Adjusted for purchasing power, only those in über-rich petrostates and financial hubs enjoy a higher income per person. Average incomes have grown much faster than in western Europe or Japan. Also, adjusted for purchasing power, they exceed $50,000 in Mississippi, America’s poorest state—higher than in France.”

The Economist continues: “American firms own more than a fifth of patents registered abroad, more than China and Germany put together. All of the five biggest corporate sources of research and development (r&d) are American; in the past year they have spent $200 billion. Consumers everywhere have benefited from their innovations in everything from the laptop and the iPhone to artificial intelligence chatbots. Investors who put $100 into the S&P 500 in 1990 would have more than $2,000 today, four times what they would have earned had they invested elsewhere in the rich world.” That’s why the dollar still rules!
The lesson is clear to investors – don’t give up on America. Keep investing in home-grown companies.
All content above represents the opinion of Gary Alexander of Navellier & Associates, Inc.
Also In This Issue
A Look Ahead by Louis Navellier
The First-Quarter Earnings Outlook Remains “Mixed,” At Best
Income Mail by Bryan Perry
Massive Paper Losses Turn Banks into a “Zombie” Sector
Growth Mail by Gary Alexander
Investors Follow the Money While Politicians Fail at Basic Math
Global Mail by Ivan Martchev
What’s Behind the New 2023 VIX Closing Low?
Sector Spotlight by Jason Bodner
Finding Answers in Quiet Data Mining – Not Manic News Noise
View Full Archive
Read Past Issues Here
About The Author

Gary Alexander
SENIOR EDITOR
Gary Alexander has been Senior Writer at Navellier since 2009. He edits Navellier’s weekly Marketmail and writes a weekly Growth Mail column, in which he uses market history to support the case for growth stocks. For the previous 20 years before joining Navellier, he was Senior Executive Editor at InvestorPlace Media (formerly Phillips Publishing), where he worked with several leading investment analysts, including Louis Navellier (since 1997), helping launch Louis Navellier’s Blue Chip Growth and Global Growth newsletters.
Prior to that, Gary edited Wealth Magazine and Gold Newsletter and wrote various investment research reports for Jefferson Financial in New Orleans in the 1980s. He began his financial newsletter career with KCI Communications in 1980, where he served as consulting editor for Personal Finance newsletter while serving as general manager of KCI’s Alexandria House book division. Before that, he covered the economics beat for news magazines. All content of “Growth Mail” represents the opinion of Gary Alexander
Important Disclosures:
Although information in these reports has been obtained from and is based upon sources that Navellier believes to be reliable, Navellier does not guarantee its accuracy and it may be incomplete or condensed. All opinions and estimates constitute Navellier’s judgment as of the date the report was created and are subject to change without notice. These reports are for informational purposes only and are not a solicitation for the purchase or sale of a security. Any decision to purchase securities mentioned in these reports must take into account existing public information on such securities or any registered prospectus.To the extent permitted by law, neither Navellier & Associates, Inc., nor any of its affiliates, agents, or service providers assumes any liability or responsibility nor owes any duty of care for any consequences of any person acting or refraining to act in reliance on the information contained in this communication or for any decision based on it.
Past performance is no indication of future results. Investment in securities involves significant risk and has the potential for partial or complete loss of funds invested. It should not be assumed that any securities recommendations made by Navellier. in the future will be profitable or equal the performance of securities made in this report. Dividend payments are not guaranteed. The amount of a dividend payment, if any, can vary over time and issuers may reduce dividends paid on securities in the event of a recession or adverse event affecting a specific industry or issuer.
None of the stock information, data, and company information presented herein constitutes a recommendation by Navellier or a solicitation to buy or sell any securities. Any specific securities identified and described do not represent all of the securities purchased, sold, or recommended for advisory clients. The holdings identified do not represent all of the securities purchased, sold, or recommended for advisory clients and the reader should not assume that investments in the securities identified and discussed were or will be profitable.
Information presented is general information that does not take into account your individual circumstances, financial situation, or needs, nor does it present a personalized recommendation to you. Individual stocks presented may not be suitable for every investor. Investment in securities involves significant risk and has the potential for partial or complete loss of funds invested. Investment in fixed income securities has the potential for the investment return and principal value of an investment to fluctuate so that an investor’s holdings, when redeemed, may be worth less than their original cost.
One cannot invest directly in an index. Index is unmanaged and index performance does not reflect deduction of fees, expenses, or taxes. Presentation of Index data does not reflect a belief by Navellier that any stock index constitutes an investment alternative to any Navellier equity strategy or is necessarily comparable to such strategies. Among the most important differences between the Indices and Navellier strategies are that the Navellier equity strategies may (1) incur material management fees, (2) concentrate its investments in relatively few stocks, industries, or sectors, (3) have significantly greater trading activity and related costs, and (4) be significantly more or less volatile than the Indices.
ETF Risk: We may invest in exchange traded funds (“ETFs”) and some of our investment strategies are generally fully invested in ETFs. Like traditional mutual funds, ETFs charge asset-based fees, but they generally do not charge initial sales charges or redemption fees and investors typically pay only customary brokerage fees to buy and sell ETF shares. The fees and costs charged by ETFs held in client accounts will not be deducted from the compensation the client pays Navellier. ETF prices can fluctuate up or down, and a client account could lose money investing in an ETF if the prices of the securities owned by the ETF go down. ETFs are subject to additional risks:
- ETF shares may trade above or below their net asset value;
- An active trading market for an ETF’s shares may not develop or be maintained;
- The value of an ETF may be more volatile than the underlying portfolio of securities the ETF is designed to track;
- The cost of owning shares of the ETF may exceed those a client would incur by directly investing in the underlying securities; and
- Trading of an ETF’s shares may be halted if the listing exchange’s officials deem it appropriate, the shares are delisted from the exchange, or the activation of market-wide “circuit breakers” (which are tied to large decreases in stock prices) halts stock trading generally.
Grader Disclosures: Investment in equity strategies involves substantial risk and has the potential for partial or complete loss of funds invested. The sample portfolio and any accompanying charts are for informational purposes only and are not to be construed as a solicitation to buy or sell any financial instrument and should not be relied upon as the sole factor in an investment making decision. As a matter of normal and important disclosures to you, as a potential investor, please consider the following: The performance presented is not based on any actual securities trading, portfolio, or accounts, and the reported performance of the A, B, C, D, and F portfolios (collectively the “model portfolios”) should be considered mere “paper” or pro forma performance results based on Navellier’s research.
Investors evaluating any of Navellier & Associates, Inc.’s, (or its affiliates’) Investment Products must not use any information presented here, including the performance figures of the model portfolios, in their evaluation of any Navellier Investment Products. Navellier Investment Products include the firm’s mutual funds and managed accounts. The model portfolios, charts, and other information presented do not represent actual funded trades and are not actual funded portfolios. There are material differences between Navellier Investment Products’ portfolios and the model portfolios, research, and performance figures presented here. The model portfolios and the research results (1) may contain stocks or ETFs that are illiquid and difficult to trade; (2) may contain stock or ETF holdings materially different from actual funded Navellier Investment Product portfolios; (3) include the reinvestment of all dividends and other earnings, estimated trading costs, commissions, or management fees; and, (4) may not reflect prices obtained in an actual funded Navellier Investment Product portfolio. For these and other reasons, the reported performances of model portfolios do not reflect the performance results of Navellier’s actually funded and traded Investment Products. In most cases, Navellier’s Investment Products have materially lower performance results than the performances of the model portfolios presented.
This report contains statements that are, or may be considered to be, forward-looking statements. All statements that are not historical facts, including statements about our beliefs or expectations, are “forward-looking statements” within the meaning of The U.S. Private Securities Litigation Reform Act of 1995. These statements may be identified by such forward-looking terminology as “expect,” “estimate,” “plan,” “intend,” “believe,” “anticipate,” “may,” “will,” “should,” “could,” “continue,” “project,” or similar statements or variations of such terms. Our forward-looking statements are based on a series of expectations, assumptions, and projections, are not guarantees of future results or performance, and involve substantial risks and uncertainty as described in Form ADV Part 2A of our filing with the Securities and Exchange Commission (SEC), which is available at www.adviserinfo.sec.gov or by requesting a copy by emailing info@navellier.com. All of our forward-looking statements are as of the date of this report only. We can give no assurance that such expectations or forward-looking statements will prove to be correct. Actual results may differ materially. You are urged to carefully consider all such factors.
FEDERAL TAX ADVICE DISCLAIMER: As required by U.S. Treasury Regulations, you are informed that, to the extent this presentation includes any federal tax advice, the presentation is not written by Navellier to be used, and cannot be used, for the purpose of avoiding federal tax penalties. Navellier does not advise on any income tax requirements or issues. Use of any information presented by Navellier is for general information only and does not represent tax advice either express or implied. You are encouraged to seek professional tax advice for income tax questions and assistance.
IMPORTANT NEWSLETTER DISCLOSURE:The hypothetical performance results for investment newsletters that are authored or edited by Louis Navellier, including Louis Navellier’s Growth Investor, Louis Navellier’s Breakthrough Stocks, Louis Navellier’s Accelerated Profits, and Louis Navellier’s Platinum Club, are not based on any actual securities trading, portfolio, or accounts, and the newsletters’ reported hypothetical performances should be considered mere “paper” or proforma hypothetical performance results and are not actual performance of real world trades. Navellier & Associates, Inc. does not have any relation to or affiliation with the owner of these newsletters. There are material differences between Navellier Investment Products’ portfolios and the InvestorPlace Media, LLC newsletter portfolios authored by Louis Navellier. The InvestorPlace Media, LLC newsletters contain hypothetical performance that do not include transaction costs, advisory fees, or other fees a client might incur if actual investments and trades were being made by an investor. As a result, newsletter performance should not be used to evaluate Navellier Investment services which are separate and different from the newsletters. The owner of the newsletters is InvestorPlace Media, LLC and any questions concerning the newsletters, including any newsletter advertising or hypothetical Newsletter performance claims, (which are calculated solely by Investor Place Media and not Navellier) should be referred to InvestorPlace Media, LLC at (800) 718-8289.
Please note that Navellier & Associates and the Navellier Private Client Group are managed completely independent of the newsletters owned and published by InvestorPlace Media, LLC and written and edited by Louis Navellier, and investment performance of the newsletters should in no way be considered indicative of potential future investment performance for any Navellier & Associates separately managed account portfolio. Potential investors should consult with their financial advisor before investing in any Navellier Investment Product.
Navellier claims compliance with Global Investment Performance Standards (GIPS). To receive a complete list and descriptions of Navellier’s composites and/or a presentation that adheres to the GIPS standards, please contact Navellier or click here. It should not be assumed that any securities recommendations made by Navellier & Associates, Inc. in the future will be profitable or equal the performance of securities made in this report.
FactSet Disclosure: Navellier does not independently calculate the statistical information included in the attached report. The calculation and the information are provided by FactSet, a company not related to Navellier. Although information contained in the report has been obtained from FactSet and is based on sources Navellier believes to be reliable, Navellier does not guarantee its accuracy, and it may be incomplete or condensed. The report and the related FactSet sourced information are provided on an “as is” basis. The user assumes the entire risk of any use made of this information. Investors should consider the report as only a single factor in making their investment decision. The report is for informational purposes only and is not intended as an offer or solicitation for the purchase or sale of a security. FactSet sourced information is the exclusive property of FactSet. Without prior written permission of FactSet, this information may not be reproduced, disseminated or used to create any financial products. All indices are unmanaged and performance of the indices include reinvestment of dividends and interest income, unless otherwise noted, are not illustrative of any particular investment and an investment cannot be made in any index. Past performance is no guarantee of future results.