by Bryan Perry
April 11, 2023
Nothing resolves market ills and pains more than rising corporate profits. The old saying of “sales fixes everything” applies to just about every kind of business, but for the stock market, the phrase “earnings fixes everything” seems more fitting, especially after the first-quarter roller coaster ride we’ve been on.
The bulls made several attempts to build a sustainable uptrend, only to be broken by a surprisingly hot inflation reading, a hawkish Fed bumping the Fed Funds rate by 75 basis points so far in 2023, a banking crisis that had the makings of a contagion, and a surprise slashing of crude output by OPEC+. Friday’s robust jobs report was released with markets closed, but it raised the specter of more Fed tightening.
Following Friday’s release of the jobs data, MarketWatch reported that, “traders of Fed funds futures priced in nearly 70% chance of a 25-basis point rate hike by the Federal Reserve when the central bank meets in May. The probability of a hike rose to 67.4% after the data, up from 49.2% a day earlier, according to data from the CME’s FedWatch tool. Analysts said the March jobs report would likely embolden the Fed to hike in May, as the labor market continued to see signs of strength last month. The U.S. economy created 236,000 jobs, just shy of the 238,000 median estimate from economists polled by The Wall Street Journal. Average hourly earnings for private-sector employees also slowed to 4.2% over the prior 12 months. Wage growth is seen by the Fed as an important inflation driver.”
Although the job gains were the lowest since December 2020, that fact is not likely to sway the Fed from increasing rates once more. Another quarter-point hike will be their tenth straight hike, taking Fed Funds up to 5.00%-5.25%. Friday’s jobs report comes after the Labor Department last Thursday revised its latest data on jobless claims, indicating that Americans filed an additional 142,000 first-time unemployment claims over the past three weeks—up 24% from levels previously reported. The revisions fueled recession concerns that intensified during the week, with “every major data point” — including jobless claims, manufacturing activity, and construction spending — signaling an economy slowing down, pushing some experts to worry that it may be slowing down too quickly, says Sevens Report founder Tom Essaye.
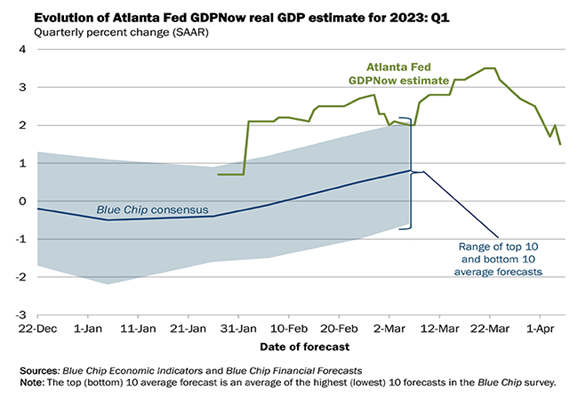
“A rising trend in claims has been a key missing part of the labor market story, but it is now clear layoffs are increasing,” said Pantheon Macro chief economist Ian Shepherdson last Thursday. “These data alone won’t stop the Fed from raising rates again in May, but they are a warning sign that should not be ignored.” Adding to the rising level of recession talk is the sudden and disconcerting slide in first-quarter earnings estimates and first-quarter GDP, as published by the Atlanta Fed, showing a forecast of only 1.5% growth in GDP for the first quarter, down from 3.5% in only two weeks.
Graphs are for illustrative and discussion purposes only. Please read important disclosures at the end of this commentary.
By the time this column is distributed, the next GDPNow report from the Atlanta Fed will have been released on Monday, April 10, and that estimate may also show further weakness, especially with oil prices spiking on the recently announced production cuts by OPEC+, to take place as of May 1.
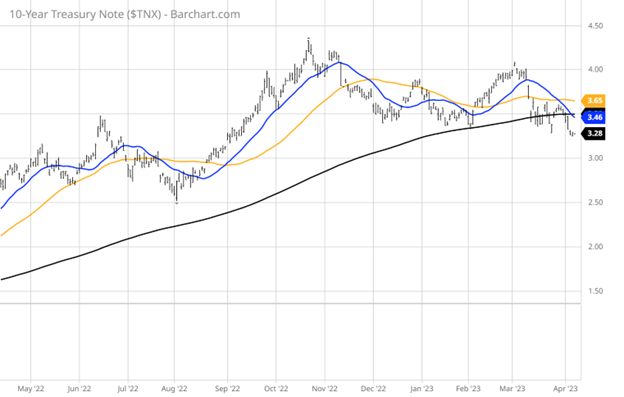
Even with all this negativity that is broadly known – where the majority expect another rate hike and slower overall growth – the S&P 500 and the NASDAQ are trading very well, considering the rapid sector rotation that has occurred these past two weeks, even in the face of plunging long-term bond yields that are typically a hard landing caution flag. The yield on the 10-year Treasury is coming down, and it looks like 3.0% is the next stop – essentially daring the Fed to raise rates further. And yet, there isn’t one Fed official that I can find that thinks the Fed should pause until the Fed Funds stand at 5.00%-5.25%.
Graphs are for illustrative and discussion purposes only. Please read important disclosures at the end of this commentary.
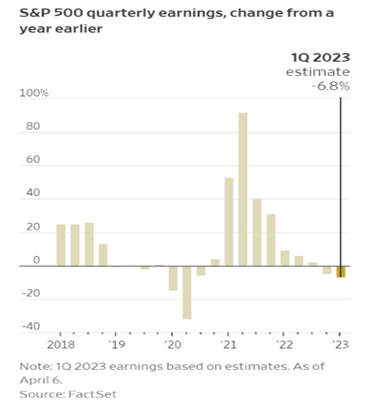
With that said, the market knows this and, in my view, is holding its ground because the tightening cycle is coming to an end, and the Fed is pumping liquidity into the banking system to backstop deposits. Most data points show inflation is trending lower and the job market is finally softening, aside from a buoyant services sector. What the market doesn’t know is what earnings season will deliver in the way of profits and guidance. As of this week, FactSet is forecasting Q1 earnings to decline by a sobering -6.8%.
Graphs are for illustrative and discussion purposes only. Please read important disclosures at the end of this commentary.
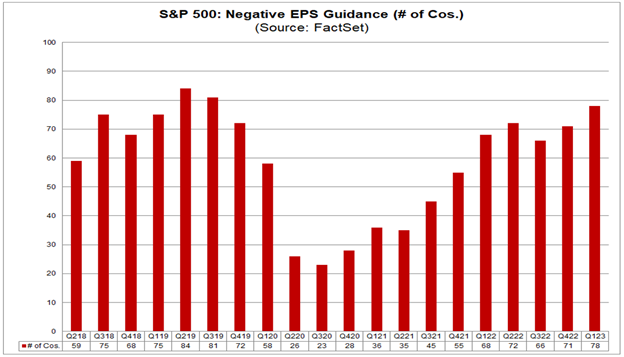
FactSet lays out the pre-announcement season, stating that as of March 24, 106 S&P 500 companies have issued EPS guidance for the first quarter. Of these, 78 (74%) have issued negative EPS guidance and 28 (26%) have issued positive EPS guidance. In fact, the first quarter has seen the highest number of S&P 500 companies issuing negative EPS guidance for a quarter since Q3 2019 (81). If 78 is the final number for the quarter, it will mark the fourth-highest number of companies in the S&P 500 issuing negative EPS guidance for a quarter since FactSet began tracking this metric in 2006.
Graphs are for illustrative and discussion purposes only. Please read important disclosures at the end of this commentary.
So, here we are, in the week of April 9-15, heading into the first full week of earnings season highlighted by the money center banks reporting this Friday, with the highest number of earnings warnings going back 17 years, and both the S&P and the NASDAQ are not caving in, as predicted by some very smart people. Sure, some heavyweight tech stocks are holding their ground, but it stands to reason that the market should be trading lower based on all the recent relatively weak data being released.
If all these bearish indicators noted above can’t break the S&P, then maybe the hard landing campers are wrong. Just maybe, the market is already in an earnings recession that will have run its course by the end of Q2, with a rebound in earnings beginning in Q3 and accelerating in Q4.
Assuming inflation is peaking, and earnings are troughing, it makes for an interesting setup, where the early gains of 7% for the S&P and 11% for the NASDAQ not only hold, but potentially double or more from here. For whatever reason (or reasons) there are to talk the market lower, it sure seems from the price action of the stocks that matter most, the clear path of preference for this market is higher.
All content above represents the opinion of Bryan Perry of Navellier & Associates, Inc.
Also In This Issue
A Look Ahead by Louis Navellier
President Biden’s Saudi Insults Have Come Home to Roost
Income Mail by Bryan Perry
Earnings Season is the Next Big Hurdle for Equities
Growth Mail by Gary Alexander
A Tax Time Bomb is Ticking
Global Mail by Ivan Martchev
The Odds of a May Rate Hike Just Rose
Sector Spotlight by Jason Bodner
Investing Isn’t as Easy as Child’s Play…But It’s Close
View Full Archive
Read Past Issues Here

Bryan Perry
SENIOR DIRECTOR
Bryan Perry is a Senior Director with Navellier Private Client Group, advising and facilitating high net worth investors in the pursuit of their financial goals.
Bryan’s financial services career spanning the past three decades includes over 20 years of wealth management experience with Wall Street firms that include Bear Stearns, Lehman Brothers and Paine Webber, working with both retail and institutional clients. Bryan earned a B.A. in Political Science from Virginia Polytechnic Institute & State University and currently holds a Series 65 license. All content of “Income Mail” represents the opinion of Bryan Perry
Important Disclosures:
Although information in these reports has been obtained from and is based upon sources that Navellier believes to be reliable, Navellier does not guarantee its accuracy and it may be incomplete or condensed. All opinions and estimates constitute Navellier’s judgment as of the date the report was created and are subject to change without notice. These reports are for informational purposes only and are not a solicitation for the purchase or sale of a security. Any decision to purchase securities mentioned in these reports must take into account existing public information on such securities or any registered prospectus.To the extent permitted by law, neither Navellier & Associates, Inc., nor any of its affiliates, agents, or service providers assumes any liability or responsibility nor owes any duty of care for any consequences of any person acting or refraining to act in reliance on the information contained in this communication or for any decision based on it.
Past performance is no indication of future results. Investment in securities involves significant risk and has the potential for partial or complete loss of funds invested. It should not be assumed that any securities recommendations made by Navellier. in the future will be profitable or equal the performance of securities made in this report. Dividend payments are not guaranteed. The amount of a dividend payment, if any, can vary over time and issuers may reduce dividends paid on securities in the event of a recession or adverse event affecting a specific industry or issuer.
None of the stock information, data, and company information presented herein constitutes a recommendation by Navellier or a solicitation to buy or sell any securities. Any specific securities identified and described do not represent all of the securities purchased, sold, or recommended for advisory clients. The holdings identified do not represent all of the securities purchased, sold, or recommended for advisory clients and the reader should not assume that investments in the securities identified and discussed were or will be profitable.
Information presented is general information that does not take into account your individual circumstances, financial situation, or needs, nor does it present a personalized recommendation to you. Individual stocks presented may not be suitable for every investor. Investment in securities involves significant risk and has the potential for partial or complete loss of funds invested. Investment in fixed income securities has the potential for the investment return and principal value of an investment to fluctuate so that an investor’s holdings, when redeemed, may be worth less than their original cost.
One cannot invest directly in an index. Index is unmanaged and index performance does not reflect deduction of fees, expenses, or taxes. Presentation of Index data does not reflect a belief by Navellier that any stock index constitutes an investment alternative to any Navellier equity strategy or is necessarily comparable to such strategies. Among the most important differences between the Indices and Navellier strategies are that the Navellier equity strategies may (1) incur material management fees, (2) concentrate its investments in relatively few stocks, industries, or sectors, (3) have significantly greater trading activity and related costs, and (4) be significantly more or less volatile than the Indices.
ETF Risk: We may invest in exchange traded funds (“ETFs”) and some of our investment strategies are generally fully invested in ETFs. Like traditional mutual funds, ETFs charge asset-based fees, but they generally do not charge initial sales charges or redemption fees and investors typically pay only customary brokerage fees to buy and sell ETF shares. The fees and costs charged by ETFs held in client accounts will not be deducted from the compensation the client pays Navellier. ETF prices can fluctuate up or down, and a client account could lose money investing in an ETF if the prices of the securities owned by the ETF go down. ETFs are subject to additional risks:
- ETF shares may trade above or below their net asset value;
- An active trading market for an ETF’s shares may not develop or be maintained;
- The value of an ETF may be more volatile than the underlying portfolio of securities the ETF is designed to track;
- The cost of owning shares of the ETF may exceed those a client would incur by directly investing in the underlying securities; and
- Trading of an ETF’s shares may be halted if the listing exchange’s officials deem it appropriate, the shares are delisted from the exchange, or the activation of market-wide “circuit breakers” (which are tied to large decreases in stock prices) halts stock trading generally.
Grader Disclosures: Investment in equity strategies involves substantial risk and has the potential for partial or complete loss of funds invested. The sample portfolio and any accompanying charts are for informational purposes only and are not to be construed as a solicitation to buy or sell any financial instrument and should not be relied upon as the sole factor in an investment making decision. As a matter of normal and important disclosures to you, as a potential investor, please consider the following: The performance presented is not based on any actual securities trading, portfolio, or accounts, and the reported performance of the A, B, C, D, and F portfolios (collectively the “model portfolios”) should be considered mere “paper” or pro forma performance results based on Navellier’s research.
Investors evaluating any of Navellier & Associates, Inc.’s, (or its affiliates’) Investment Products must not use any information presented here, including the performance figures of the model portfolios, in their evaluation of any Navellier Investment Products. Navellier Investment Products include the firm’s mutual funds and managed accounts. The model portfolios, charts, and other information presented do not represent actual funded trades and are not actual funded portfolios. There are material differences between Navellier Investment Products’ portfolios and the model portfolios, research, and performance figures presented here. The model portfolios and the research results (1) may contain stocks or ETFs that are illiquid and difficult to trade; (2) may contain stock or ETF holdings materially different from actual funded Navellier Investment Product portfolios; (3) include the reinvestment of all dividends and other earnings, estimated trading costs, commissions, or management fees; and, (4) may not reflect prices obtained in an actual funded Navellier Investment Product portfolio. For these and other reasons, the reported performances of model portfolios do not reflect the performance results of Navellier’s actually funded and traded Investment Products. In most cases, Navellier’s Investment Products have materially lower performance results than the performances of the model portfolios presented.
This report contains statements that are, or may be considered to be, forward-looking statements. All statements that are not historical facts, including statements about our beliefs or expectations, are “forward-looking statements” within the meaning of The U.S. Private Securities Litigation Reform Act of 1995. These statements may be identified by such forward-looking terminology as “expect,” “estimate,” “plan,” “intend,” “believe,” “anticipate,” “may,” “will,” “should,” “could,” “continue,” “project,” or similar statements or variations of such terms. Our forward-looking statements are based on a series of expectations, assumptions, and projections, are not guarantees of future results or performance, and involve substantial risks and uncertainty as described in Form ADV Part 2A of our filing with the Securities and Exchange Commission (SEC), which is available at www.adviserinfo.sec.gov or by requesting a copy by emailing info@navellier.com. All of our forward-looking statements are as of the date of this report only. We can give no assurance that such expectations or forward-looking statements will prove to be correct. Actual results may differ materially. You are urged to carefully consider all such factors.
FEDERAL TAX ADVICE DISCLAIMER: As required by U.S. Treasury Regulations, you are informed that, to the extent this presentation includes any federal tax advice, the presentation is not written by Navellier to be used, and cannot be used, for the purpose of avoiding federal tax penalties. Navellier does not advise on any income tax requirements or issues. Use of any information presented by Navellier is for general information only and does not represent tax advice either express or implied. You are encouraged to seek professional tax advice for income tax questions and assistance.
IMPORTANT NEWSLETTER DISCLOSURE:The hypothetical performance results for investment newsletters that are authored or edited by Louis Navellier, including Louis Navellier’s Growth Investor, Louis Navellier’s Breakthrough Stocks, Louis Navellier’s Accelerated Profits, and Louis Navellier’s Platinum Club, are not based on any actual securities trading, portfolio, or accounts, and the newsletters’ reported hypothetical performances should be considered mere “paper” or proforma hypothetical performance results and are not actual performance of real world trades. Navellier & Associates, Inc. does not have any relation to or affiliation with the owner of these newsletters. There are material differences between Navellier Investment Products’ portfolios and the InvestorPlace Media, LLC newsletter portfolios authored by Louis Navellier. The InvestorPlace Media, LLC newsletters contain hypothetical performance that do not include transaction costs, advisory fees, or other fees a client might incur if actual investments and trades were being made by an investor. As a result, newsletter performance should not be used to evaluate Navellier Investment services which are separate and different from the newsletters. The owner of the newsletters is InvestorPlace Media, LLC and any questions concerning the newsletters, including any newsletter advertising or hypothetical Newsletter performance claims, (which are calculated solely by Investor Place Media and not Navellier) should be referred to InvestorPlace Media, LLC at (800) 718-8289.
Please note that Navellier & Associates and the Navellier Private Client Group are managed completely independent of the newsletters owned and published by InvestorPlace Media, LLC and written and edited by Louis Navellier, and investment performance of the newsletters should in no way be considered indicative of potential future investment performance for any Navellier & Associates separately managed account portfolio. Potential investors should consult with their financial advisor before investing in any Navellier Investment Product.
Navellier claims compliance with Global Investment Performance Standards (GIPS). To receive a complete list and descriptions of Navellier’s composites and/or a presentation that adheres to the GIPS standards, please contact Navellier or click here. It should not be assumed that any securities recommendations made by Navellier & Associates, Inc. in the future will be profitable or equal the performance of securities made in this report.
FactSet Disclosure: Navellier does not independently calculate the statistical information included in the attached report. The calculation and the information are provided by FactSet, a company not related to Navellier. Although information contained in the report has been obtained from FactSet and is based on sources Navellier believes to be reliable, Navellier does not guarantee its accuracy, and it may be incomplete or condensed. The report and the related FactSet sourced information are provided on an “as is” basis. The user assumes the entire risk of any use made of this information. Investors should consider the report as only a single factor in making their investment decision. The report is for informational purposes only and is not intended as an offer or solicitation for the purchase or sale of a security. FactSet sourced information is the exclusive property of FactSet. Without prior written permission of FactSet, this information may not be reproduced, disseminated or used to create any financial products. All indices are unmanaged and performance of the indices include reinvestment of dividends and interest income, unless otherwise noted, are not illustrative of any particular investment and an investment cannot be made in any index. Past performance is no guarantee of future results.