by Jason Bodner
April 11, 2023
Make money? No Problem! Or that’s what ads on TV want you to think. It’s so easy to make money in stocks that even a baby can do it. Remember this popular ad? It’s so easy, even a baby can do it.

If the ad execs take it one step further, we won’t even need a brain to navigate the never-ending puzzle of the stock market. It turns out that Physarum polycephalum, a type of slime mold, can solve complex mazes. It doesn’t even have a brain or a nervous system.

Well let’s get one thing straight: making money in the stock market is harder than the ads tell you it is.
You see, the market is a giant mass of investors – each with thoughts, feelings, and emotions, like fear and greed. Sure, the machines are there, too, but don’t forget: They are programmed by humans – at least for now they are. And these feelings and emotions are swayed heavily by the news media.
We have a huge plate full of anxieties these days – fears of a recession, concerns on interest rates and inflation, the Russia/Ukraine conflict, oil price volatility, and political scandals, just to name a few.
All of these things make it seem impossible to profit in a market that just won’t make it easy on us.
But I’ll let you in on a little secret: With the right tools, it can be easier than it seems. The right data can help identify stocks that outperform, sector leaders and laggards, and even help with timing the market.
Data trumps what the news is pumping out. Back in September, selling became unsustainable as evidenced by the Big Money Index (BMI). When it goes down into the green, it means unusual trading activity was 25% or less was unusual buying. That level is unsustainable and is a strong buy signal.
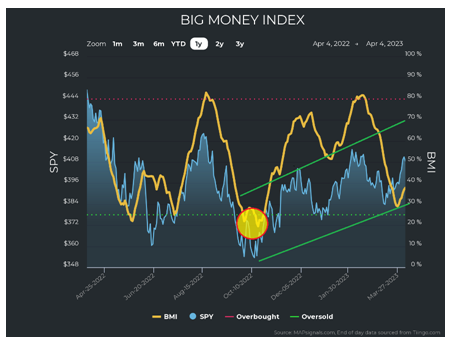
Graphs are for illustrative and discussion purposes only. Please read important disclosures at the end of this commentary.
Like clockwork, the market pivoted and started to rally. That rally has been happening despite all the negativity in sentiment and headlines.
Recently, the market came within a kiss of being oversold. That’s great. It means we could be going much higher. But on the other hand, it was due to selling disappearing as opposed to buying taking over:
Graphs are for illustrative and discussion purposes only. Please read important disclosures at the end of this commentary.
The Fed is likely at or near the end of its rate hike cycle, and their battle against inflation is working, as we are seeing some indications of economic cooling. Perhaps that helps explain why market leadership has been in tech and discretionary, two very powerful forces for a new bull market to emerge. We need growth sectors to drive prices higher, and this tells us the market sees fewer impediments ahead.
We can see this reflected in the sector leadership table below. Tech and discretionary are tops while financials and real estate are in the basement:
![]()
Graphs are for illustrative and discussion purposes only. Please read important disclosures at the end of this commentary.
When we dig into individual sector charts, we see not only that selling has dissipated, but we also are seeing signs of buying. Tech, Discretionary, and Materials are seeing little green shoots of buying lately:
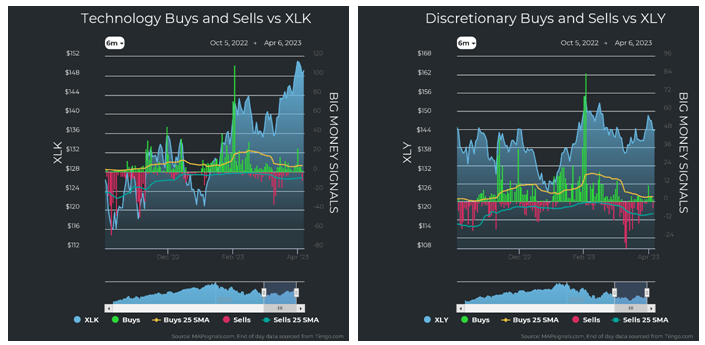
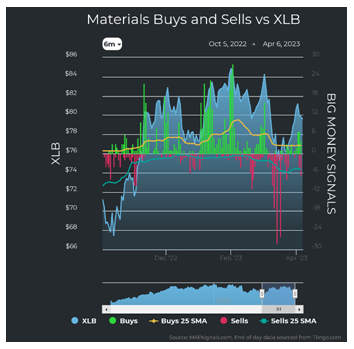
Graphs are for illustrative and discussion purposes only. Please read important disclosures at the end of this commentary.
Industrials saw some selling into recent strength:
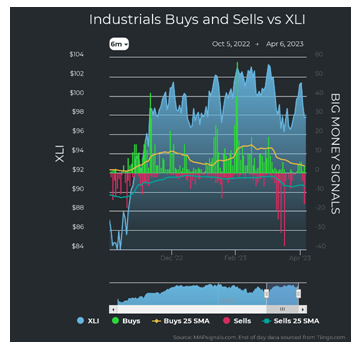
Graphs are for illustrative and discussion purposes only. Please read important disclosures at the end of this commentary.
After recent weakness, energy saw some tiny buying which is interesting given how deep the sector pulled back. There was also healthy buying in staples, utilities, health care, and communications stocks:
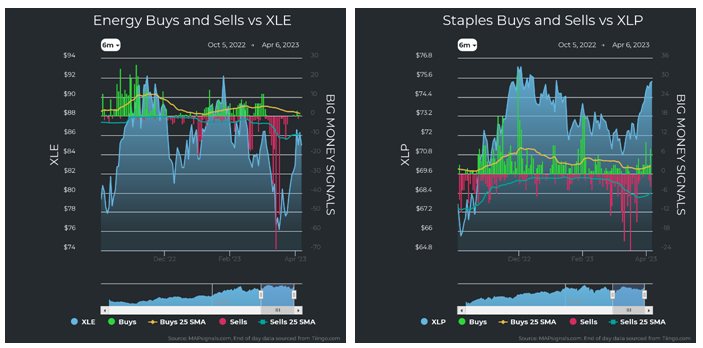
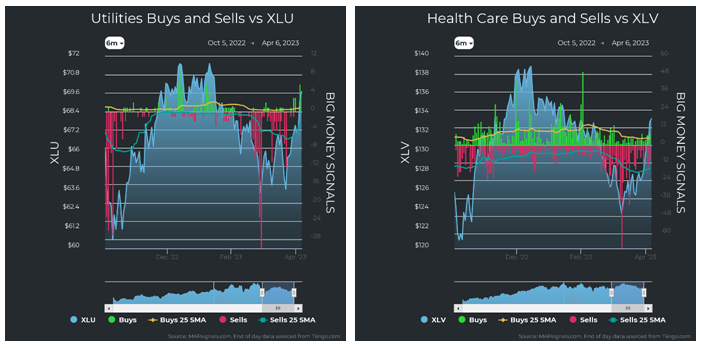
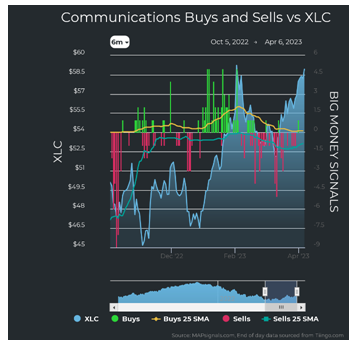
Graphs are for illustrative and discussion purposes only. Please read important disclosures at the end of this commentary.
And finally – we can see clearly why financials and real estate are ranked so poorly. The selling was heavily concentrated in those two sectors:
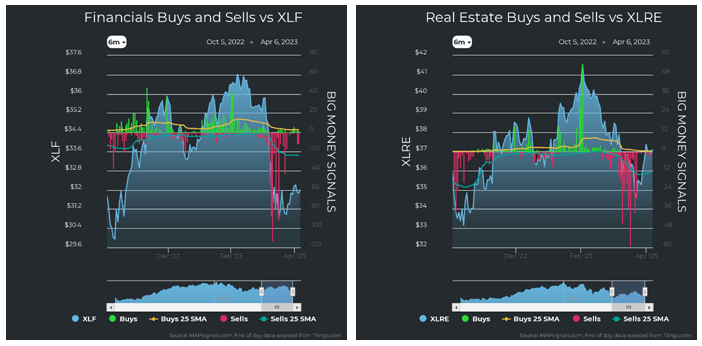
Graphs are for illustrative and discussion purposes only. Please read important disclosures at the end of this commentary.
Earnings season is nearly upon us, and everyone is still freaked out about a banking crisis and a recession. It feels like the market’s next move could be a coin toss. Fear gets in the way of objectivity and buying stocks at highs feels wrong. It becomes confusing, and in some cases paralytic. That’s the problem with making money. Once again, emotion gets in the way of practical objective thinking.
The other problem is that the pickings can get slim. What I mean by that is, stocks that rise to the top of screens become saturated. For instance, one stock can appear at the top of my list week after week. If that happens often, and we already own them, pickings become slim. I am seeing a lot of that now.
The good news is that with a quantitative approach, there are always opportunities, regardless of what the broader market is doing at the time. Sure, some days are easier than others. Think for instance, just after COVID-19 when the market screamed back to highs! But when COVID first hit, it wasn’t easy.
That’s why I am such a zealot for quantitative analysis. It filters out all the emotion, all the confusion, all the heartache of investing. It allows us to adopt a procedural, unemotional approach to managing our money. After all, if you hire money managers, I doubt you’re looking for the most volatile personality you can find. No – you want a cool customer when things get hot, so you don’t overreact.
When we start winning, we get addicted to a feeling of success… we want more. Emotion can take over and eschew logic. But in the world of investing, it is paramount to keep emotions out of the way.
That’s a time to focus on what the data says.
More is a great word. I forgot which movie, but one character asks the other: “You have everything anyone could possibly want… riches, power, fame… what else could you possibly want?”
The reply was simple: “More.”

All content above represents the opinion of Jason Bodner of Navellier & Associates, Inc.
Also In This Issue
A Look Ahead by Louis Navellier
President Biden’s Saudi Insults Have Come Home to Roost
Income Mail by Bryan Perry
Earnings Season is the Next Big Hurdle for Equities
Growth Mail by Gary Alexander
A Tax Time Bomb is Ticking
Global Mail by Ivan Martchev
The Odds of a May Rate Hike Just Rose
Sector Spotlight by Jason Bodner
Investing Isn’t as Easy as Child’s Play…But It’s Close
View Full Archive
Read Past Issues Here

Jason Bodner
MARKETMAIL EDITOR FOR SECTOR SPOTLIGHT
Jason Bodner writes Sector Spotlight in the weekly Marketmail publication and has authored several white papers for the company. He is also Co-Founder of Macro Analytics for Professionals which produces proprietary equity accumulation/distribution research for its clients. Previously, Mr. Bodner served as Director of European Equity Derivatives for Cantor Fitzgerald Europe in London, then moved to the role of Head of Equity Derivatives North America for the same company in New York. He also served as S.V.P. Equity Derivatives for Jefferies, LLC. He received a B.S. in business administration in 1996, with honors, from Skidmore College as a member of the Periclean Honors Society. All content of “Sector Spotlight” represents the opinion of Jason Bodner
Important Disclosures:
Jason Bodner is a co-founder and co-owner of Mapsignals. Mr. Bodner is an independent contractor who is occasionally hired by Navellier & Associates to write an article and or provide opinions for possible use in articles that appear in Navellier & Associates weekly Market Mail. Mr. Bodner is not employed or affiliated with Louis Navellier, Navellier & Associates, Inc., or any other Navellier owned entity. The opinions and statements made here are those of Mr. Bodner and not necessarily those of any other persons or entities. This is not an endorsement, or solicitation or testimonial or investment advice regarding the BMI Index or any statements or recommendations or analysis in the article or the BMI Index or Mapsignals or its products or strategies.
Although information in these reports has been obtained from and is based upon sources that Navellier believes to be reliable, Navellier does not guarantee its accuracy and it may be incomplete or condensed. All opinions and estimates constitute Navellier’s judgment as of the date the report was created and are subject to change without notice. These reports are for informational purposes only and are not a solicitation for the purchase or sale of a security. Any decision to purchase securities mentioned in these reports must take into account existing public information on such securities or any registered prospectus.To the extent permitted by law, neither Navellier & Associates, Inc., nor any of its affiliates, agents, or service providers assumes any liability or responsibility nor owes any duty of care for any consequences of any person acting or refraining to act in reliance on the information contained in this communication or for any decision based on it.
Past performance is no indication of future results. Investment in securities involves significant risk and has the potential for partial or complete loss of funds invested. It should not be assumed that any securities recommendations made by Navellier. in the future will be profitable or equal the performance of securities made in this report. Dividend payments are not guaranteed. The amount of a dividend payment, if any, can vary over time and issuers may reduce dividends paid on securities in the event of a recession or adverse event affecting a specific industry or issuer.
None of the stock information, data, and company information presented herein constitutes a recommendation by Navellier or a solicitation to buy or sell any securities. Any specific securities identified and described do not represent all of the securities purchased, sold, or recommended for advisory clients. The holdings identified do not represent all of the securities purchased, sold, or recommended for advisory clients and the reader should not assume that investments in the securities identified and discussed were or will be profitable.
Information presented is general information that does not take into account your individual circumstances, financial situation, or needs, nor does it present a personalized recommendation to you. Individual stocks presented may not be suitable for every investor. Investment in securities involves significant risk and has the potential for partial or complete loss of funds invested. Investment in fixed income securities has the potential for the investment return and principal value of an investment to fluctuate so that an investor’s holdings, when redeemed, may be worth less than their original cost.
One cannot invest directly in an index. Index is unmanaged and index performance does not reflect deduction of fees, expenses, or taxes. Presentation of Index data does not reflect a belief by Navellier that any stock index constitutes an investment alternative to any Navellier equity strategy or is necessarily comparable to such strategies. Among the most important differences between the Indices and Navellier strategies are that the Navellier equity strategies may (1) incur material management fees, (2) concentrate its investments in relatively few stocks, industries, or sectors, (3) have significantly greater trading activity and related costs, and (4) be significantly more or less volatile than the Indices.
ETF Risk: We may invest in exchange traded funds (“ETFs”) and some of our investment strategies are generally fully invested in ETFs. Like traditional mutual funds, ETFs charge asset-based fees, but they generally do not charge initial sales charges or redemption fees and investors typically pay only customary brokerage fees to buy and sell ETF shares. The fees and costs charged by ETFs held in client accounts will not be deducted from the compensation the client pays Navellier. ETF prices can fluctuate up or down, and a client account could lose money investing in an ETF if the prices of the securities owned by the ETF go down. ETFs are subject to additional risks:
- ETF shares may trade above or below their net asset value;
- An active trading market for an ETF’s shares may not develop or be maintained;
- The value of an ETF may be more volatile than the underlying portfolio of securities the ETF is designed to track;
- The cost of owning shares of the ETF may exceed those a client would incur by directly investing in the underlying securities; and
- Trading of an ETF’s shares may be halted if the listing exchange’s officials deem it appropriate, the shares are delisted from the exchange, or the activation of market-wide “circuit breakers” (which are tied to large decreases in stock prices) halts stock trading generally.
Grader Disclosures: Investment in equity strategies involves substantial risk and has the potential for partial or complete loss of funds invested. The sample portfolio and any accompanying charts are for informational purposes only and are not to be construed as a solicitation to buy or sell any financial instrument and should not be relied upon as the sole factor in an investment making decision. As a matter of normal and important disclosures to you, as a potential investor, please consider the following: The performance presented is not based on any actual securities trading, portfolio, or accounts, and the reported performance of the A, B, C, D, and F portfolios (collectively the “model portfolios”) should be considered mere “paper” or pro forma performance results based on Navellier’s research.
Investors evaluating any of Navellier & Associates, Inc.’s, (or its affiliates’) Investment Products must not use any information presented here, including the performance figures of the model portfolios, in their evaluation of any Navellier Investment Products. Navellier Investment Products include the firm’s mutual funds and managed accounts. The model portfolios, charts, and other information presented do not represent actual funded trades and are not actual funded portfolios. There are material differences between Navellier Investment Products’ portfolios and the model portfolios, research, and performance figures presented here. The model portfolios and the research results (1) may contain stocks or ETFs that are illiquid and difficult to trade; (2) may contain stock or ETF holdings materially different from actual funded Navellier Investment Product portfolios; (3) include the reinvestment of all dividends and other earnings, estimated trading costs, commissions, or management fees; and, (4) may not reflect prices obtained in an actual funded Navellier Investment Product portfolio. For these and other reasons, the reported performances of model portfolios do not reflect the performance results of Navellier’s actually funded and traded Investment Products. In most cases, Navellier’s Investment Products have materially lower performance results than the performances of the model portfolios presented.
This report contains statements that are, or may be considered to be, forward-looking statements. All statements that are not historical facts, including statements about our beliefs or expectations, are “forward-looking statements” within the meaning of The U.S. Private Securities Litigation Reform Act of 1995. These statements may be identified by such forward-looking terminology as “expect,” “estimate,” “plan,” “intend,” “believe,” “anticipate,” “may,” “will,” “should,” “could,” “continue,” “project,” or similar statements or variations of such terms. Our forward-looking statements are based on a series of expectations, assumptions, and projections, are not guarantees of future results or performance, and involve substantial risks and uncertainty as described in Form ADV Part 2A of our filing with the Securities and Exchange Commission (SEC), which is available at www.adviserinfo.sec.gov or by requesting a copy by emailing info@navellier.com. All of our forward-looking statements are as of the date of this report only. We can give no assurance that such expectations or forward-looking statements will prove to be correct. Actual results may differ materially. You are urged to carefully consider all such factors.
FEDERAL TAX ADVICE DISCLAIMER: As required by U.S. Treasury Regulations, you are informed that, to the extent this presentation includes any federal tax advice, the presentation is not written by Navellier to be used, and cannot be used, for the purpose of avoiding federal tax penalties. Navellier does not advise on any income tax requirements or issues. Use of any information presented by Navellier is for general information only and does not represent tax advice either express or implied. You are encouraged to seek professional tax advice for income tax questions and assistance.
IMPORTANT NEWSLETTER DISCLOSURE:The hypothetical performance results for investment newsletters that are authored or edited by Louis Navellier, including Louis Navellier’s Growth Investor, Louis Navellier’s Breakthrough Stocks, Louis Navellier’s Accelerated Profits, and Louis Navellier’s Platinum Club, are not based on any actual securities trading, portfolio, or accounts, and the newsletters’ reported hypothetical performances should be considered mere “paper” or proforma hypothetical performance results and are not actual performance of real world trades. Navellier & Associates, Inc. does not have any relation to or affiliation with the owner of these newsletters. There are material differences between Navellier Investment Products’ portfolios and the InvestorPlace Media, LLC newsletter portfolios authored by Louis Navellier. The InvestorPlace Media, LLC newsletters contain hypothetical performance that do not include transaction costs, advisory fees, or other fees a client might incur if actual investments and trades were being made by an investor. As a result, newsletter performance should not be used to evaluate Navellier Investment services which are separate and different from the newsletters. The owner of the newsletters is InvestorPlace Media, LLC and any questions concerning the newsletters, including any newsletter advertising or hypothetical Newsletter performance claims, (which are calculated solely by Investor Place Media and not Navellier) should be referred to InvestorPlace Media, LLC at (800) 718-8289.
Please note that Navellier & Associates and the Navellier Private Client Group are managed completely independent of the newsletters owned and published by InvestorPlace Media, LLC and written and edited by Louis Navellier, and investment performance of the newsletters should in no way be considered indicative of potential future investment performance for any Navellier & Associates separately managed account portfolio. Potential investors should consult with their financial advisor before investing in any Navellier Investment Product.
Navellier claims compliance with Global Investment Performance Standards (GIPS). To receive a complete list and descriptions of Navellier’s composites and/or a presentation that adheres to the GIPS standards, please contact Navellier or click here. It should not be assumed that any securities recommendations made by Navellier & Associates, Inc. in the future will be profitable or equal the performance of securities made in this report.
FactSet Disclosure: Navellier does not independently calculate the statistical information included in the attached report. The calculation and the information are provided by FactSet, a company not related to Navellier. Although information contained in the report has been obtained from FactSet and is based on sources Navellier believes to be reliable, Navellier does not guarantee its accuracy, and it may be incomplete or condensed. The report and the related FactSet sourced information are provided on an “as is” basis. The user assumes the entire risk of any use made of this information. Investors should consider the report as only a single factor in making their investment decision. The report is for informational purposes only and is not intended as an offer or solicitation for the purchase or sale of a security. FactSet sourced information is the exclusive property of FactSet. Without prior written permission of FactSet, this information may not be reproduced, disseminated or used to create any financial products. All indices are unmanaged and performance of the indices include reinvestment of dividends and interest income, unless otherwise noted, are not illustrative of any particular investment and an investment cannot be made in any index. Past performance is no guarantee of future results.