by Gary Alexander
April 11, 2023
As April 15 approaches this weekend, rest assured that your tax-filing deadline has been postponed, not just one day, not just two days to Monday, which turns out to be Emancipation Day in Washington DC, where federal workers have more days off than anyone in America, but to Tuesday, April 18 this year.
April 18 happens to be Patriot’s Day in Boston, the evening when Paul Revere made his midnight ride, replicated these days in the Boston Marathon, when feather-weight East Africans won 19 of the last 20 races, running 26 miles in the opposite direction – toward Boston – with this year’s race held on April 17.
Americans fought for freedom from lower British taxes than we face today, but tomorrow’s date, ironically, marks a little-observed tax victory. On April 12, 1770, the British Parliament actually listened to our faraway tax protest by repealing most of the dreaded Townshend Acts, the bills passed in 1767 and named after their sponsor, Charles Townshend. These acts levied a controversial set of tariffs, including duties on paint, paper, and tea. Colonial outrage prompted the British to roll back all of those hated acts and revenue duties, except that pesky one, the tea tax, which led to a certain Tea Party in Boston later on.
But don’t get complacent. President Biden is no Charles Townshend. Our fearless leader, who looked us in the eye and said he would never raise taxes on anyone earning less than $400,000, has proposed a gigantic tax increase that will hit those earning well under $400,000 as well as almost everyone else.
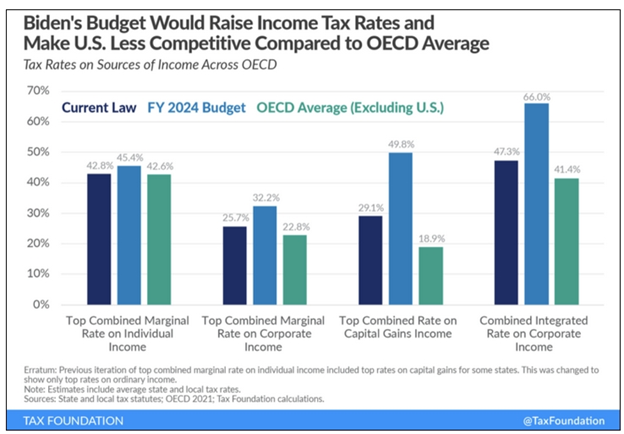
Within the President’s massive 2024 budget are tax increases that the Tax Foundation computes would leave the USA with the highest income tax burden of any of the 38 Western OECD countries:
Graphs are for illustrative and discussion purposes only. Please read important disclosures at the end of this commentary.
The top capital gains tax rate (near 50%) is particularly chilling, as well as the near two-thirds (66%) total rate on corporate income. Investors and corporations might as well throw in the towel if this bill passes.
The good news is this bill won’t pass. President Biden’s budget (and this tax rip-off) are dead on arrival on Capitol Hill, thanks to last November’s narrow Republican majority in the House, but something like this level of highway robbery will be on the table in conference rooms between now and the end of 2023.
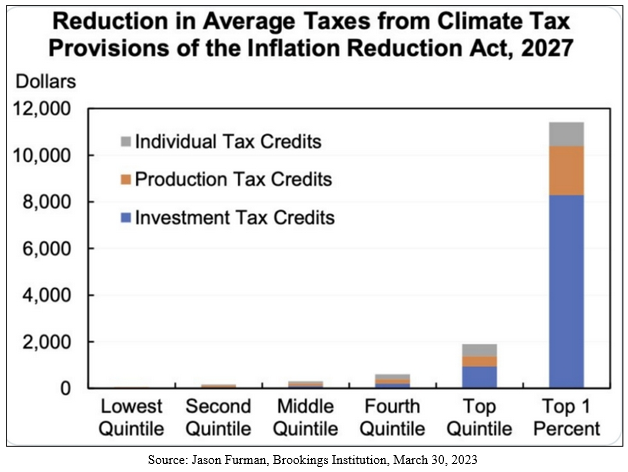
Also, don’t forget that inflation is pushing many Americans into higher tax brackets. Inflation is the quiet tax increase on the middle class and poor. The recent Inflation Reduction Act “may go down as one of the greatest confidence tricks on taxpayers in history,” said The Wall Street Journal in an editorial on March 25, 2023. It was promised to cost $391 billion in the decade from 2022 to 2031, but now, the Journal says, “A Goldman Sachs report projects its myriad green subsidies will cost $1.2 trillion – more than three times what the law’s supporters claimed.” Furthermore, Jason Furman of Harvard University and the left-of-center Brookings Institution (Furman was also head of the National Economic Council in the Obama Administration) said the green energy subsidies of this “Inflation Reduction Act,” went mainly to the rich.
Graphs are for illustrative and discussion purposes only. Please read important disclosures at the end of this commentary.
Another Headline That May Go Down in History
In one of the world’s worst market predictions, the New York Times editorialized 130 years ago last week, on April 5, 1893, that, “It is too soon to say that a bull market is upon us, but the figures show that the tendency is toward higher prices.” In that same month, however, many of the smaller Wall Street houses defaulted, and the worst market slide in decades began by the end of April. The worldwide Panic of 1893 began in April of 1893, when foreigners (mostly British) began to withdraw their capital from U.S. banks.
Last Friday’s Top-of-Page-1 headline may not go down in history as that big of a blunder, but I wonder about its placement. It screams atop Page 1, “Stocks Haven’t Looked This Ugly in Years.” By a certain measure “relative to bonds,” stocks are at their “lowest level in years.” Normally, this is the kind of arcane statistical study that belongs in the Business & Finance section, not on the news slot. (The main news story was pretty flimsy, too: “U.S. Proposal Forbids Outright School Bans on Trans Athletes.”)

You wouldn’t know that there was a war in Ukraine, saber-rattling in China over Taiwan, nuclear bombs coming in Iran, a 40-year-high inflation and interest rates, Israel conducting strikes on two nations, the threat of artificial intelligence snooping into your computer searches, the IRS adding thousands more enforcement agents (see first article), trillion-dollar deficits, and a looming debt ceiling debate coming.
This article, by Eric Wallerstein, says “The equity risk premium – the gap between the S&P 500’s earnings yield and that of the 10-year Treasurys – sits around 1.59 percentage points, a low not seen since October 2007. That is well below the average gap of around 3.5 points since 2008. The reduction is a challenge for stocks going forward. Equities need to promise a higher reward than bonds over the longer term.”
True enough, on all points, but stocks are in an “earnings trough” after a very long period of exceptional earnings, and bond yields are rising again, after a 40-year decline. This is rare, but “this too shall pass.”
We’ll know more as first-quarter earnings come in, starting this week, but our favorite market economist, Ed Yardeni, reports that as of the week ending March 31, industry analysts projected S&P 500 earnings per share of $220.45 this year and $247.57 next year, which means a slight gain of 0.3% this year and a healthier rise of 12.0% next year, but bear in mind that results actually beat estimates 74% of the time.

Graphs are for illustrative and discussion purposes only. Please read important disclosures at the end of this commentary.
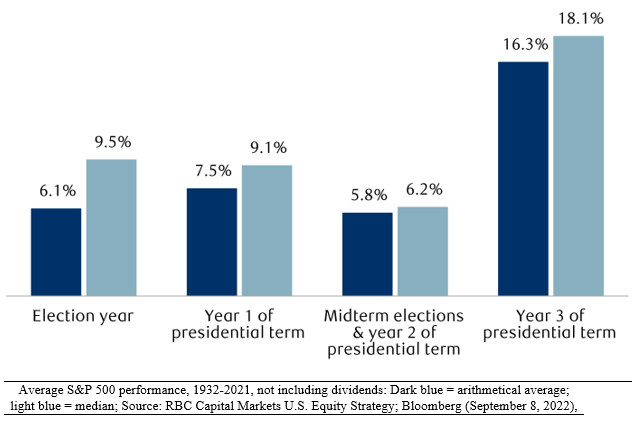
Also bear in mind that this is the third year of the Presidential cycle – a very strong year, historically, as I have pointed out in several past columns here. Year #3 is twice as good as any other year, historically.
Graphs are for illustrative and discussion purposes only. Please read important disclosures at the end of this commentary.
Normally, I wouldn’t quibble with such an article if it were placed in Section 2 of the Journal, midway down the page, with a docile headline, like “Stock/bond ratio at 15-year low, favoring bonds,” but using the two words “STOCKS…UGLY” atop page 1 seemed to send a message to investors – Avoid Stocks!
But I like that – it’s a perfect contrarian Refrigerator Magnet “Gotcha” button for future reference, so let’s cut and paste this headline now, in April, then look at it a year from now and see how “ugly” stocks look.
All content above represents the opinion of Gary Alexander of Navellier & Associates, Inc.
Also In This Issue
A Look Ahead by Louis Navellier
President Biden’s Saudi Insults Have Come Home to Roost
Income Mail by Bryan Perry
Earnings Season is the Next Big Hurdle for Equities
Growth Mail by Gary Alexander
A Tax Time Bomb is Ticking
Global Mail by Ivan Martchev
The Odds of a May Rate Hike Just Rose
Sector Spotlight by Jason Bodner
Investing Isn’t as Easy as Child’s Play…But It’s Close
View Full Archive
Read Past Issues Here
About The Author

Gary Alexander
SENIOR EDITOR
Gary Alexander has been Senior Writer at Navellier since 2009. He edits Navellier’s weekly Marketmail and writes a weekly Growth Mail column, in which he uses market history to support the case for growth stocks. For the previous 20 years before joining Navellier, he was Senior Executive Editor at InvestorPlace Media (formerly Phillips Publishing), where he worked with several leading investment analysts, including Louis Navellier (since 1997), helping launch Louis Navellier’s Blue Chip Growth and Global Growth newsletters.
Prior to that, Gary edited Wealth Magazine and Gold Newsletter and wrote various investment research reports for Jefferson Financial in New Orleans in the 1980s. He began his financial newsletter career with KCI Communications in 1980, where he served as consulting editor for Personal Finance newsletter while serving as general manager of KCI’s Alexandria House book division. Before that, he covered the economics beat for news magazines. All content of “Growth Mail” represents the opinion of Gary Alexander
Important Disclosures:
Although information in these reports has been obtained from and is based upon sources that Navellier believes to be reliable, Navellier does not guarantee its accuracy and it may be incomplete or condensed. All opinions and estimates constitute Navellier’s judgment as of the date the report was created and are subject to change without notice. These reports are for informational purposes only and are not a solicitation for the purchase or sale of a security. Any decision to purchase securities mentioned in these reports must take into account existing public information on such securities or any registered prospectus.To the extent permitted by law, neither Navellier & Associates, Inc., nor any of its affiliates, agents, or service providers assumes any liability or responsibility nor owes any duty of care for any consequences of any person acting or refraining to act in reliance on the information contained in this communication or for any decision based on it.
Past performance is no indication of future results. Investment in securities involves significant risk and has the potential for partial or complete loss of funds invested. It should not be assumed that any securities recommendations made by Navellier. in the future will be profitable or equal the performance of securities made in this report. Dividend payments are not guaranteed. The amount of a dividend payment, if any, can vary over time and issuers may reduce dividends paid on securities in the event of a recession or adverse event affecting a specific industry or issuer.
None of the stock information, data, and company information presented herein constitutes a recommendation by Navellier or a solicitation to buy or sell any securities. Any specific securities identified and described do not represent all of the securities purchased, sold, or recommended for advisory clients. The holdings identified do not represent all of the securities purchased, sold, or recommended for advisory clients and the reader should not assume that investments in the securities identified and discussed were or will be profitable.
Information presented is general information that does not take into account your individual circumstances, financial situation, or needs, nor does it present a personalized recommendation to you. Individual stocks presented may not be suitable for every investor. Investment in securities involves significant risk and has the potential for partial or complete loss of funds invested. Investment in fixed income securities has the potential for the investment return and principal value of an investment to fluctuate so that an investor’s holdings, when redeemed, may be worth less than their original cost.
One cannot invest directly in an index. Index is unmanaged and index performance does not reflect deduction of fees, expenses, or taxes. Presentation of Index data does not reflect a belief by Navellier that any stock index constitutes an investment alternative to any Navellier equity strategy or is necessarily comparable to such strategies. Among the most important differences between the Indices and Navellier strategies are that the Navellier equity strategies may (1) incur material management fees, (2) concentrate its investments in relatively few stocks, industries, or sectors, (3) have significantly greater trading activity and related costs, and (4) be significantly more or less volatile than the Indices.
ETF Risk: We may invest in exchange traded funds (“ETFs”) and some of our investment strategies are generally fully invested in ETFs. Like traditional mutual funds, ETFs charge asset-based fees, but they generally do not charge initial sales charges or redemption fees and investors typically pay only customary brokerage fees to buy and sell ETF shares. The fees and costs charged by ETFs held in client accounts will not be deducted from the compensation the client pays Navellier. ETF prices can fluctuate up or down, and a client account could lose money investing in an ETF if the prices of the securities owned by the ETF go down. ETFs are subject to additional risks:
- ETF shares may trade above or below their net asset value;
- An active trading market for an ETF’s shares may not develop or be maintained;
- The value of an ETF may be more volatile than the underlying portfolio of securities the ETF is designed to track;
- The cost of owning shares of the ETF may exceed those a client would incur by directly investing in the underlying securities; and
- Trading of an ETF’s shares may be halted if the listing exchange’s officials deem it appropriate, the shares are delisted from the exchange, or the activation of market-wide “circuit breakers” (which are tied to large decreases in stock prices) halts stock trading generally.
Grader Disclosures: Investment in equity strategies involves substantial risk and has the potential for partial or complete loss of funds invested. The sample portfolio and any accompanying charts are for informational purposes only and are not to be construed as a solicitation to buy or sell any financial instrument and should not be relied upon as the sole factor in an investment making decision. As a matter of normal and important disclosures to you, as a potential investor, please consider the following: The performance presented is not based on any actual securities trading, portfolio, or accounts, and the reported performance of the A, B, C, D, and F portfolios (collectively the “model portfolios”) should be considered mere “paper” or pro forma performance results based on Navellier’s research.
Investors evaluating any of Navellier & Associates, Inc.’s, (or its affiliates’) Investment Products must not use any information presented here, including the performance figures of the model portfolios, in their evaluation of any Navellier Investment Products. Navellier Investment Products include the firm’s mutual funds and managed accounts. The model portfolios, charts, and other information presented do not represent actual funded trades and are not actual funded portfolios. There are material differences between Navellier Investment Products’ portfolios and the model portfolios, research, and performance figures presented here. The model portfolios and the research results (1) may contain stocks or ETFs that are illiquid and difficult to trade; (2) may contain stock or ETF holdings materially different from actual funded Navellier Investment Product portfolios; (3) include the reinvestment of all dividends and other earnings, estimated trading costs, commissions, or management fees; and, (4) may not reflect prices obtained in an actual funded Navellier Investment Product portfolio. For these and other reasons, the reported performances of model portfolios do not reflect the performance results of Navellier’s actually funded and traded Investment Products. In most cases, Navellier’s Investment Products have materially lower performance results than the performances of the model portfolios presented.
This report contains statements that are, or may be considered to be, forward-looking statements. All statements that are not historical facts, including statements about our beliefs or expectations, are “forward-looking statements” within the meaning of The U.S. Private Securities Litigation Reform Act of 1995. These statements may be identified by such forward-looking terminology as “expect,” “estimate,” “plan,” “intend,” “believe,” “anticipate,” “may,” “will,” “should,” “could,” “continue,” “project,” or similar statements or variations of such terms. Our forward-looking statements are based on a series of expectations, assumptions, and projections, are not guarantees of future results or performance, and involve substantial risks and uncertainty as described in Form ADV Part 2A of our filing with the Securities and Exchange Commission (SEC), which is available at www.adviserinfo.sec.gov or by requesting a copy by emailing info@navellier.com. All of our forward-looking statements are as of the date of this report only. We can give no assurance that such expectations or forward-looking statements will prove to be correct. Actual results may differ materially. You are urged to carefully consider all such factors.
FEDERAL TAX ADVICE DISCLAIMER: As required by U.S. Treasury Regulations, you are informed that, to the extent this presentation includes any federal tax advice, the presentation is not written by Navellier to be used, and cannot be used, for the purpose of avoiding federal tax penalties. Navellier does not advise on any income tax requirements or issues. Use of any information presented by Navellier is for general information only and does not represent tax advice either express or implied. You are encouraged to seek professional tax advice for income tax questions and assistance.
IMPORTANT NEWSLETTER DISCLOSURE:The hypothetical performance results for investment newsletters that are authored or edited by Louis Navellier, including Louis Navellier’s Growth Investor, Louis Navellier’s Breakthrough Stocks, Louis Navellier’s Accelerated Profits, and Louis Navellier’s Platinum Club, are not based on any actual securities trading, portfolio, or accounts, and the newsletters’ reported hypothetical performances should be considered mere “paper” or proforma hypothetical performance results and are not actual performance of real world trades. Navellier & Associates, Inc. does not have any relation to or affiliation with the owner of these newsletters. There are material differences between Navellier Investment Products’ portfolios and the InvestorPlace Media, LLC newsletter portfolios authored by Louis Navellier. The InvestorPlace Media, LLC newsletters contain hypothetical performance that do not include transaction costs, advisory fees, or other fees a client might incur if actual investments and trades were being made by an investor. As a result, newsletter performance should not be used to evaluate Navellier Investment services which are separate and different from the newsletters. The owner of the newsletters is InvestorPlace Media, LLC and any questions concerning the newsletters, including any newsletter advertising or hypothetical Newsletter performance claims, (which are calculated solely by Investor Place Media and not Navellier) should be referred to InvestorPlace Media, LLC at (800) 718-8289.
Please note that Navellier & Associates and the Navellier Private Client Group are managed completely independent of the newsletters owned and published by InvestorPlace Media, LLC and written and edited by Louis Navellier, and investment performance of the newsletters should in no way be considered indicative of potential future investment performance for any Navellier & Associates separately managed account portfolio. Potential investors should consult with their financial advisor before investing in any Navellier Investment Product.
Navellier claims compliance with Global Investment Performance Standards (GIPS). To receive a complete list and descriptions of Navellier’s composites and/or a presentation that adheres to the GIPS standards, please contact Navellier or click here. It should not be assumed that any securities recommendations made by Navellier & Associates, Inc. in the future will be profitable or equal the performance of securities made in this report.
FactSet Disclosure: Navellier does not independently calculate the statistical information included in the attached report. The calculation and the information are provided by FactSet, a company not related to Navellier. Although information contained in the report has been obtained from FactSet and is based on sources Navellier believes to be reliable, Navellier does not guarantee its accuracy, and it may be incomplete or condensed. The report and the related FactSet sourced information are provided on an “as is” basis. The user assumes the entire risk of any use made of this information. Investors should consider the report as only a single factor in making their investment decision. The report is for informational purposes only and is not intended as an offer or solicitation for the purchase or sale of a security. FactSet sourced information is the exclusive property of FactSet. Without prior written permission of FactSet, this information may not be reproduced, disseminated or used to create any financial products. All indices are unmanaged and performance of the indices include reinvestment of dividends and interest income, unless otherwise noted, are not illustrative of any particular investment and an investment cannot be made in any index. Past performance is no guarantee of future results.