by Gary Alexander
February 21, 2024

In my weekly radio program on music history, I offered a song for each special day last week, starting with the Chinese New Year (February10), then Super Bowl Sunday, Lincoln’s Birthday, Mardi Gras, Ash Wednesday, and Valentine’s Day, ending on Presidents’ Day weekend, with “If I Ruled the World.”
That song debuted in the 1963 West End (London) musical, Pickwick, based on Dickens’ “Pickwick Papers.” When asked for his political manifesto, Sam Pickwick began his long list of impossible dreams with this line about manipulating the weather into a permanent March 21st, but in the best tradition of noble central planning turning into well-intended failures, if every day were truly the first day of spring, we would never enjoy the Green Leaves of Summer, Autumn Leaves, a White Christmas, or corn as high as an elephant’s eye, since the typical March 21 in the middle of America is 47 degrees with a brisk wind.
Pickwick’s wish, if fulfilled, could solve global warming, but it might eventually kill most people by destroying crop growth – but then, we’re not supposed to think logically during political speeches. (“If I Ruled the World”), sung on the first day of spring, 1965 by Tony Bennett, backed by Bobby Hacket, cornet, and Woody Herman’s orchestra on Ed Sullivan’s Sunday night TV show, March 21, 1965.
…and If “Every day were the first day of Spring,” this would be your constant frigid day in U.S. cities on March 21:

OK, what does all this have to do with stocks and the economy? Two major things: Growth and Deficits.
#1: Growth Could Slow to Under 2% Under Current Conditions
On growth, the Federal Reserve’s projection for GDP growth in 2024 (as of year-end-2023) was an anemic +1.4% for 2024 and +1.8% for 2025. After that, we face bigger challenges. Unless Congress and the next president can agree to extend some expiring provisions of the 2017 Tax Cuts and Jobs Act, those business tax breaks will automatically expire in 2026, potentially slowing growth even further in 2026.
David Malpass, President of the World Bank from 2019 to 2023, wrote in The Wall Street Journal last Thursday (and I said the same last Tuesday) that last year’s 3%+ GDP growth “Isn’t as good as it sounds. Government spending and the surge in national debt boosted the consumption side of U.S. gross domestic product, but business investment was muted.” Malpass explains that last point later in the article:
“That part of the U.S. growth engine is broken, in part, because Washington controls so much of the economy through regulation, subsidies and redistribution. Record government borrowing has been crowding out the financing and confidence needed for small businesses to invest and expand” (from “Slow Growth is Ahead Unless Government Gets Out of the Way,” David Malpass, February 15, 2024).
Furthermore, a new CBO report sees GDP growth averaging 2% or less over the next decade:
#2: Deficits: CBO Director Says, “The Current Fiscal Trajectory is Unsustainable.”
Last week, the non-partisan Congressional Budget Office came out with a 10-year projection based on current policies, called “The Budget and Economic Outlook, 2024-2034.” Their deficit picture calls for a slight reduction in red ink this year, even though the real numbers are not co-operating with them so far.
In the first four months of Fiscal Year 2024 (beginning October 1, 2023), the federal government has run up $603 billion in red ink so far – that’s $77 billion more than in the same period in FY’2023 (a 14.6% gain). Much of this is beyond the control of Congress, a result of higher interest rates and higher inflation:
For instance, in the first four months of Fiscal 2024 (October 1, 2023 to January 31, 2024), there was a
• $93 billion (+47%) gain in net interest payments on public debt from rising interest rates and higher debt.
• $80 billion (+9%) increase in the largest mandatory spending programs, due to cost-of-living adjustments.
• $31 billion (+12%) increase in spending by the Department of Defense, mostly for personnel benefits.
The CBO’s long-term deficit projection is chilling: “After 2028, deficits climb as a percentage of GDP, returning to 6.1 percent in 2034. Since the Great Depression, deficits have exceeded that level only during and shortly after World War II, the 2007–2009 financial crisis, and the corona-virus pandemic.”
The CBO says debt held by the public will reach an all-time record 116 percent of GDP in 2034, and “In the two decades that follow, growing deficits will cause debt to soar to 172 percent of GDP by 2054.”
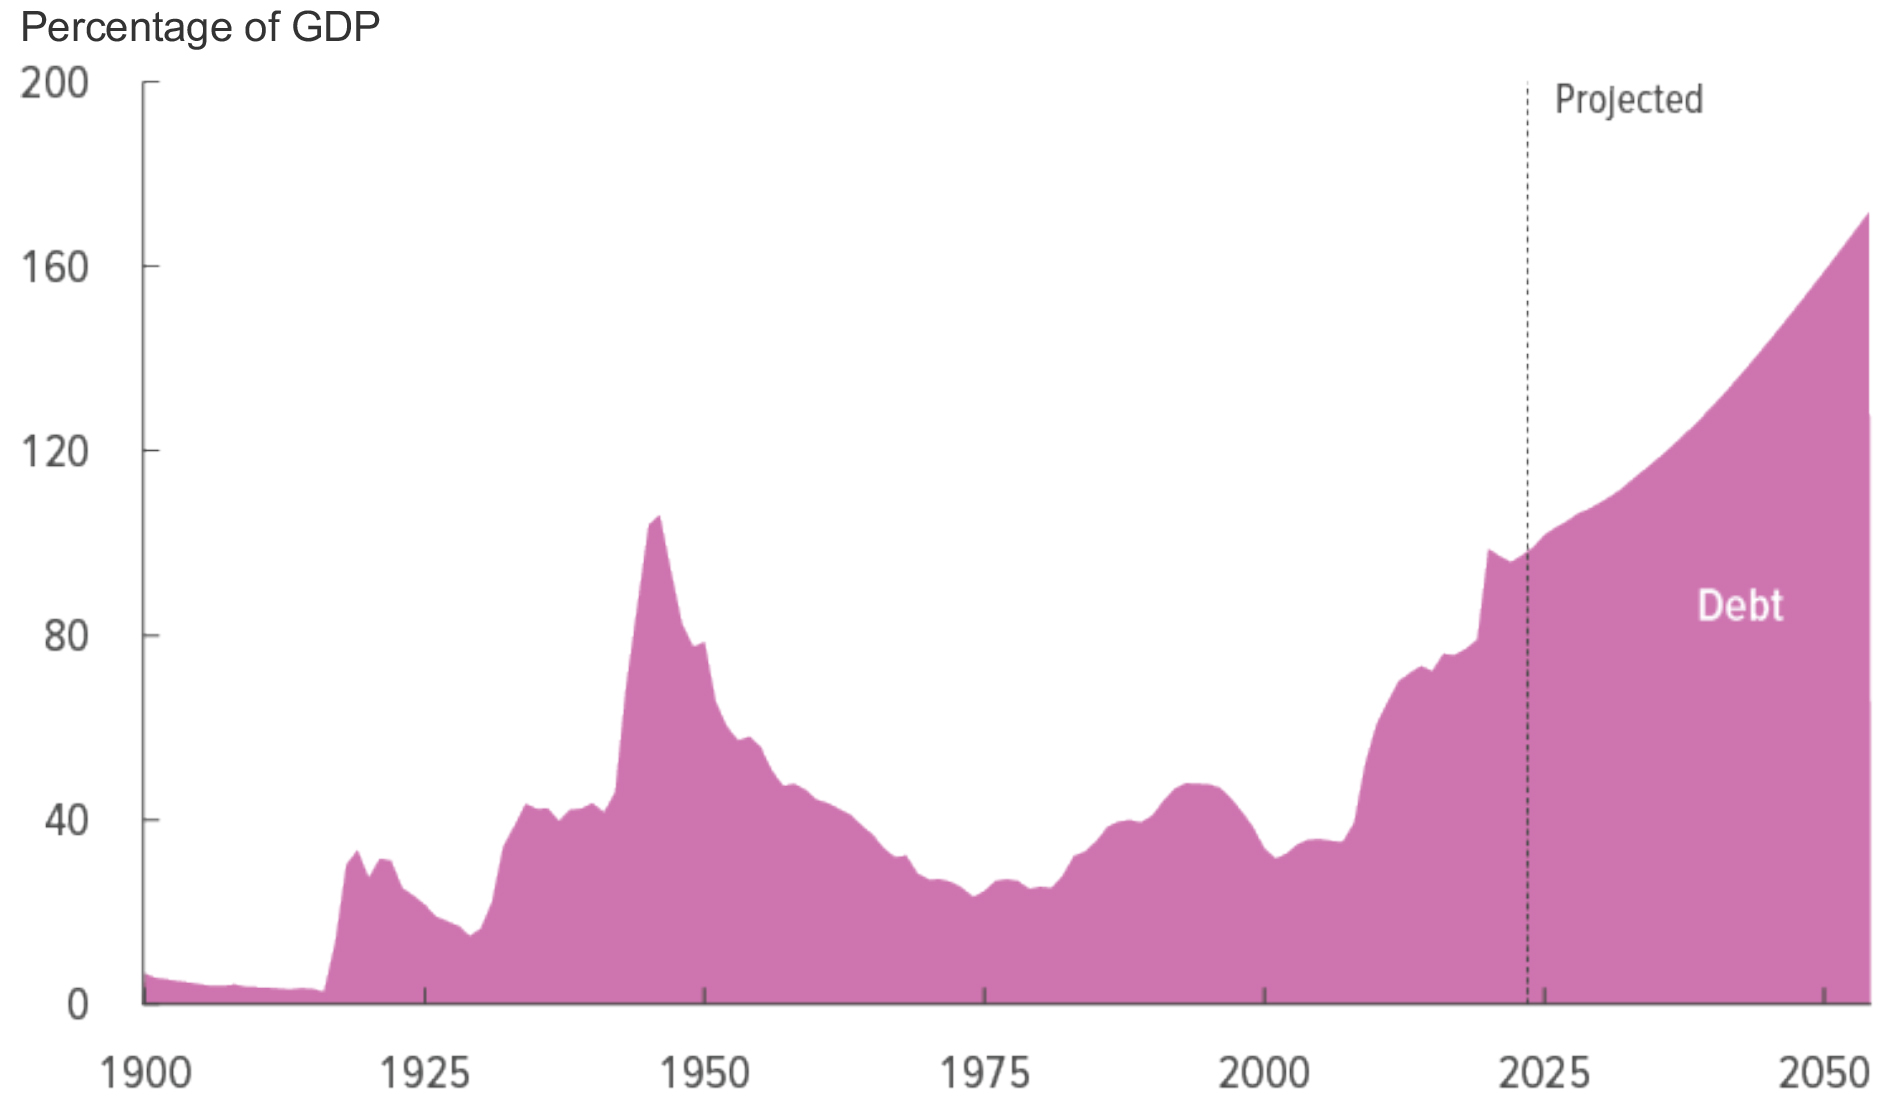
Graphs are for illustrative and discussion purposes only. Please read important disclosures at the end of this commentary.
Unfortunately, past experience shows that these forecasts may be too optimistic. The 2010, the CBO projected that the federal debt-to-GDP ratio would reach 80 percent by…wait for it…2049! We actually reached that milestone in 2019. Revenues were far lower than CBO had expected in 2010, while spending was higher than expected, sending deficits soaring, even before COVID struck. (See Peter G. Peterson Foundation, “Decade in Review: Looking Back at CBO Projections Then and Now,” January 7, 2020).
In bringing this new (February 2024) report to Capitol Hill, CBO director Phillip Swagel said, “I can tell you that I am very confident that the fiscal trajectory is unsustainable under current law.” Interest payments on the national debt, now around $800 billion, are projected to double to $1.6 trillion in 2034. Annual spending will rise from the current $6 trillion to $10 trillion in 2034, and the cumulative national debt will almost double, from $26 trillion when Biden took office in 2021 to $48.3 trillion in 2034.
If those trillions make your head spin, a deficit of “only” $1.6 trillion per year translates to $50,000 each second, or $3 million in red ink per minute, more than most Americans make after taxes in a lifetime.
Despite these dire warnings, hardly any politician works to cut spending. The Biden Administration keeps drafting spending bills with no apparent thought to the mounting debt, higher interest rates on that debt, or the possibility that foreign and domestic bond buyers may balk at buying more of new debt each quarter.
According to the U.S. Treasury, bond issuance reached a record $2.3 trillion last year, hitting a record $776 billion in the fourth quarter. The Treasury also announced its plan to borrow $776 billion this quarter and $816 billion next quarter – an annual rate of over $3 trillion – at a time when new bond yields are 4%-5%. This year interest costs are on pace to surpass defense spending in a year of record bond issues.
Each week, we hear of new spending bills, like $95+ billion in foreign aid for foreign wars, or a $1.7 trillion new omnibus spending bill taking shape for a March vote, or clever new ways to skirt court review to fund college debt relief to millions of students who, in my opinion, took out too many loans to fund studies in their favorite feel-good unmarketable majors at indoctrination centers masquerading as universities.
As a result of profligate over-spending by Congress for several years under both Parties, U.S. debt has already been downgraded twice in the last year, first by Fitch in August and Moody’s in November, so a third downgrade could send investors out of the dollar and into other currencies or gold as a crisis hedge.
In their report, the CBO failed to estimate future inflation rates. In all fairness, there’s no way to predict long-term inflation. Although the rate of inflation has decreased, the Bureau of Labor Statistics says the change of prices from January 2021 to January 2024 are +33% for gasoline, +24% for electricity, and +21% for groceries, while the real median middle-class household income is down by $4,000 since 2021.
If I ruled the world – or won the Presidency – I would ban new spending and start repealing old spending plans while terminating five or six Cabinet Departments that spend $40 to $50 billion a year, then resign.
All content above represents the opinion of Gary Alexander of Navellier & Associates, Inc.
Also In This Issue
A Look Ahead by Louis Navellier
Most Economic Indicators Tell Me the Fed Should Cut Rates Sooner, Not Later
Income Mail by Bryan Perry
Are Banks Prepared for a Commercial Real Estate Reset?
Growth Mail by Gary Alexander
Presidents’ Day Reality: Big Promises, Few Results
Global Mail by Ivan Martchev
Geopolitics May Start to Move the Markets Again
Sector Spotlight by Jason Bodner
For Market Timing Guidance, Put on Your “Quant Goggles”
View Full Archive
Read Past Issues Here
About The Author

Gary Alexander
SENIOR EDITOR
Gary Alexander has been Senior Writer at Navellier since 2009. He edits Navellier’s weekly Marketmail and writes a weekly Growth Mail column, in which he uses market history to support the case for growth stocks. For the previous 20 years before joining Navellier, he was Senior Executive Editor at InvestorPlace Media (formerly Phillips Publishing), where he worked with several leading investment analysts, including Louis Navellier (since 1997), helping launch Louis Navellier’s Blue Chip Growth and Global Growth newsletters.
Prior to that, Gary edited Wealth Magazine and Gold Newsletter and wrote various investment research reports for Jefferson Financial in New Orleans in the 1980s. He began his financial newsletter career with KCI Communications in 1980, where he served as consulting editor for Personal Finance newsletter while serving as general manager of KCI’s Alexandria House book division. Before that, he covered the economics beat for news magazines. All content of “Growth Mail” represents the opinion of Gary Alexander
Important Disclosures:
Although information in these reports has been obtained from and is based upon sources that Navellier believes to be reliable, Navellier does not guarantee its accuracy and it may be incomplete or condensed. All opinions and estimates constitute Navellier’s judgment as of the date the report was created and are subject to change without notice. These reports are for informational purposes only and are not a solicitation for the purchase or sale of a security. Any decision to purchase securities mentioned in these reports must take into account existing public information on such securities or any registered prospectus.To the extent permitted by law, neither Navellier & Associates, Inc., nor any of its affiliates, agents, or service providers assumes any liability or responsibility nor owes any duty of care for any consequences of any person acting or refraining to act in reliance on the information contained in this communication or for any decision based on it.
Past performance is no indication of future results. Investment in securities involves significant risk and has the potential for partial or complete loss of funds invested. It should not be assumed that any securities recommendations made by Navellier. in the future will be profitable or equal the performance of securities made in this report. Dividend payments are not guaranteed. The amount of a dividend payment, if any, can vary over time and issuers may reduce dividends paid on securities in the event of a recession or adverse event affecting a specific industry or issuer.
None of the stock information, data, and company information presented herein constitutes a recommendation by Navellier or a solicitation to buy or sell any securities. Any specific securities identified and described do not represent all of the securities purchased, sold, or recommended for advisory clients. The holdings identified do not represent all of the securities purchased, sold, or recommended for advisory clients and the reader should not assume that investments in the securities identified and discussed were or will be profitable.
Information presented is general information that does not take into account your individual circumstances, financial situation, or needs, nor does it present a personalized recommendation to you. Individual stocks presented may not be suitable for every investor. Investment in securities involves significant risk and has the potential for partial or complete loss of funds invested. Investment in fixed income securities has the potential for the investment return and principal value of an investment to fluctuate so that an investor’s holdings, when redeemed, may be worth less than their original cost.
One cannot invest directly in an index. Index is unmanaged and index performance does not reflect deduction of fees, expenses, or taxes. Presentation of Index data does not reflect a belief by Navellier that any stock index constitutes an investment alternative to any Navellier equity strategy or is necessarily comparable to such strategies. Among the most important differences between the Indices and Navellier strategies are that the Navellier equity strategies may (1) incur material management fees, (2) concentrate its investments in relatively few stocks, industries, or sectors, (3) have significantly greater trading activity and related costs, and (4) be significantly more or less volatile than the Indices.
ETF Risk: We may invest in exchange traded funds (“ETFs”) and some of our investment strategies are generally fully invested in ETFs. Like traditional mutual funds, ETFs charge asset-based fees, but they generally do not charge initial sales charges or redemption fees and investors typically pay only customary brokerage fees to buy and sell ETF shares. The fees and costs charged by ETFs held in client accounts will not be deducted from the compensation the client pays Navellier. ETF prices can fluctuate up or down, and a client account could lose money investing in an ETF if the prices of the securities owned by the ETF go down. ETFs are subject to additional risks:
- ETF shares may trade above or below their net asset value;
- An active trading market for an ETF’s shares may not develop or be maintained;
- The value of an ETF may be more volatile than the underlying portfolio of securities the ETF is designed to track;
- The cost of owning shares of the ETF may exceed those a client would incur by directly investing in the underlying securities; and
- Trading of an ETF’s shares may be halted if the listing exchange’s officials deem it appropriate, the shares are delisted from the exchange, or the activation of market-wide “circuit breakers” (which are tied to large decreases in stock prices) halts stock trading generally.
Grader Disclosures: Investment in equity strategies involves substantial risk and has the potential for partial or complete loss of funds invested. The sample portfolio and any accompanying charts are for informational purposes only and are not to be construed as a solicitation to buy or sell any financial instrument and should not be relied upon as the sole factor in an investment making decision. As a matter of normal and important disclosures to you, as a potential investor, please consider the following: The performance presented is not based on any actual securities trading, portfolio, or accounts, and the reported performance of the A, B, C, D, and F portfolios (collectively the “model portfolios”) should be considered mere “paper” or pro forma performance results based on Navellier’s research.
Investors evaluating any of Navellier & Associates, Inc.’s, (or its affiliates’) Investment Products must not use any information presented here, including the performance figures of the model portfolios, in their evaluation of any Navellier Investment Products. Navellier Investment Products include the firm’s mutual funds and managed accounts. The model portfolios, charts, and other information presented do not represent actual funded trades and are not actual funded portfolios. There are material differences between Navellier Investment Products’ portfolios and the model portfolios, research, and performance figures presented here. The model portfolios and the research results (1) may contain stocks or ETFs that are illiquid and difficult to trade; (2) may contain stock or ETF holdings materially different from actual funded Navellier Investment Product portfolios; (3) include the reinvestment of all dividends and other earnings, estimated trading costs, commissions, or management fees; and, (4) may not reflect prices obtained in an actual funded Navellier Investment Product portfolio. For these and other reasons, the reported performances of model portfolios do not reflect the performance results of Navellier’s actually funded and traded Investment Products. In most cases, Navellier’s Investment Products have materially lower performance results than the performances of the model portfolios presented.
This report contains statements that are, or may be considered to be, forward-looking statements. All statements that are not historical facts, including statements about our beliefs or expectations, are “forward-looking statements” within the meaning of The U.S. Private Securities Litigation Reform Act of 1995. These statements may be identified by such forward-looking terminology as “expect,” “estimate,” “plan,” “intend,” “believe,” “anticipate,” “may,” “will,” “should,” “could,” “continue,” “project,” or similar statements or variations of such terms. Our forward-looking statements are based on a series of expectations, assumptions, and projections, are not guarantees of future results or performance, and involve substantial risks and uncertainty as described in Form ADV Part 2A of our filing with the Securities and Exchange Commission (SEC), which is available at www.adviserinfo.sec.gov or by requesting a copy by emailing info@navellier.com. All of our forward-looking statements are as of the date of this report only. We can give no assurance that such expectations or forward-looking statements will prove to be correct. Actual results may differ materially. You are urged to carefully consider all such factors.
FEDERAL TAX ADVICE DISCLAIMER: As required by U.S. Treasury Regulations, you are informed that, to the extent this presentation includes any federal tax advice, the presentation is not written by Navellier to be used, and cannot be used, for the purpose of avoiding federal tax penalties. Navellier does not advise on any income tax requirements or issues. Use of any information presented by Navellier is for general information only and does not represent tax advice either express or implied. You are encouraged to seek professional tax advice for income tax questions and assistance.
IMPORTANT NEWSLETTER DISCLOSURE:The hypothetical performance results for investment newsletters that are authored or edited by Louis Navellier, including Louis Navellier’s Growth Investor, Louis Navellier’s Breakthrough Stocks, Louis Navellier’s Accelerated Profits, and Louis Navellier’s Platinum Club, are not based on any actual securities trading, portfolio, or accounts, and the newsletters’ reported hypothetical performances should be considered mere “paper” or proforma hypothetical performance results and are not actual performance of real world trades. Navellier & Associates, Inc. does not have any relation to or affiliation with the owner of these newsletters. There are material differences between Navellier Investment Products’ portfolios and the InvestorPlace Media, LLC newsletter portfolios authored by Louis Navellier. The InvestorPlace Media, LLC newsletters contain hypothetical performance that do not include transaction costs, advisory fees, or other fees a client might incur if actual investments and trades were being made by an investor. As a result, newsletter performance should not be used to evaluate Navellier Investment services which are separate and different from the newsletters. The owner of the newsletters is InvestorPlace Media, LLC and any questions concerning the newsletters, including any newsletter advertising or hypothetical Newsletter performance claims, (which are calculated solely by Investor Place Media and not Navellier) should be referred to InvestorPlace Media, LLC at (800) 718-8289.
Please note that Navellier & Associates and the Navellier Private Client Group are managed completely independent of the newsletters owned and published by InvestorPlace Media, LLC and written and edited by Louis Navellier, and investment performance of the newsletters should in no way be considered indicative of potential future investment performance for any Navellier & Associates separately managed account portfolio. Potential investors should consult with their financial advisor before investing in any Navellier Investment Product.
Navellier claims compliance with Global Investment Performance Standards (GIPS). To receive a complete list and descriptions of Navellier’s composites and/or a presentation that adheres to the GIPS standards, please contact Navellier or click here. It should not be assumed that any securities recommendations made by Navellier & Associates, Inc. in the future will be profitable or equal the performance of securities made in this report.
FactSet Disclosure: Navellier does not independently calculate the statistical information included in the attached report. The calculation and the information are provided by FactSet, a company not related to Navellier. Although information contained in the report has been obtained from FactSet and is based on sources Navellier believes to be reliable, Navellier does not guarantee its accuracy, and it may be incomplete or condensed. The report and the related FactSet sourced information are provided on an “as is” basis. The user assumes the entire risk of any use made of this information. Investors should consider the report as only a single factor in making their investment decision. The report is for informational purposes only and is not intended as an offer or solicitation for the purchase or sale of a security. FactSet sourced information is the exclusive property of FactSet. Without prior written permission of FactSet, this information may not be reproduced, disseminated or used to create any financial products. All indices are unmanaged and performance of the indices include reinvestment of dividends and interest income, unless otherwise noted, are not illustrative of any particular investment and an investment cannot be made in any index. Past performance is no guarantee of future results.