by Jason Bodner
February 21, 2024
Maybe you’re wondering: When will the market come down?
I mean, aren’t we overdue?
- The news has prepared us, eternally, to be ready for the next catastrophe.
- Wall Street forever climbs an endless Wall of Worry.
- This rally has been going on for nearly four months, since October 26th of last year.
Ironically, last October 26th, we were all asking the opposite question: When will the pain end?
In either case, emotions cloud our ability to see clearly. That’s why I prefer to look through different lenses to get my results. Doesn’t that make sense? The military uses infrared goggles for night vision when looking for heat signatures instead of light. If doctors want to see what’s wrong with a bone, they use X-rays. Skin conditions are treated with ultraviolet light, which we can’t see.
That’s why I put on my specially designed “Quant” goggles. Long ago, I learned that investing with emotion, I make the wrong decision 100% of the time. So, I developed a system to help me decipher market action, separating fact from fluff, isolating amazing stocks, and removing emotional reactions.
Using only data, we can tell emotions to take a hike, and see a clear picture of a strong market.
That we know, but one powerful indicator says risk is to the downside. The Big Money Index first fell from overbought nine trading days ago signaling short-term bearish action. Instead, the market has risen.
What gives?
Goggles please!
Graphs are for illustrative and discussion purposes only. Please read important disclosures at the end of this commentary.
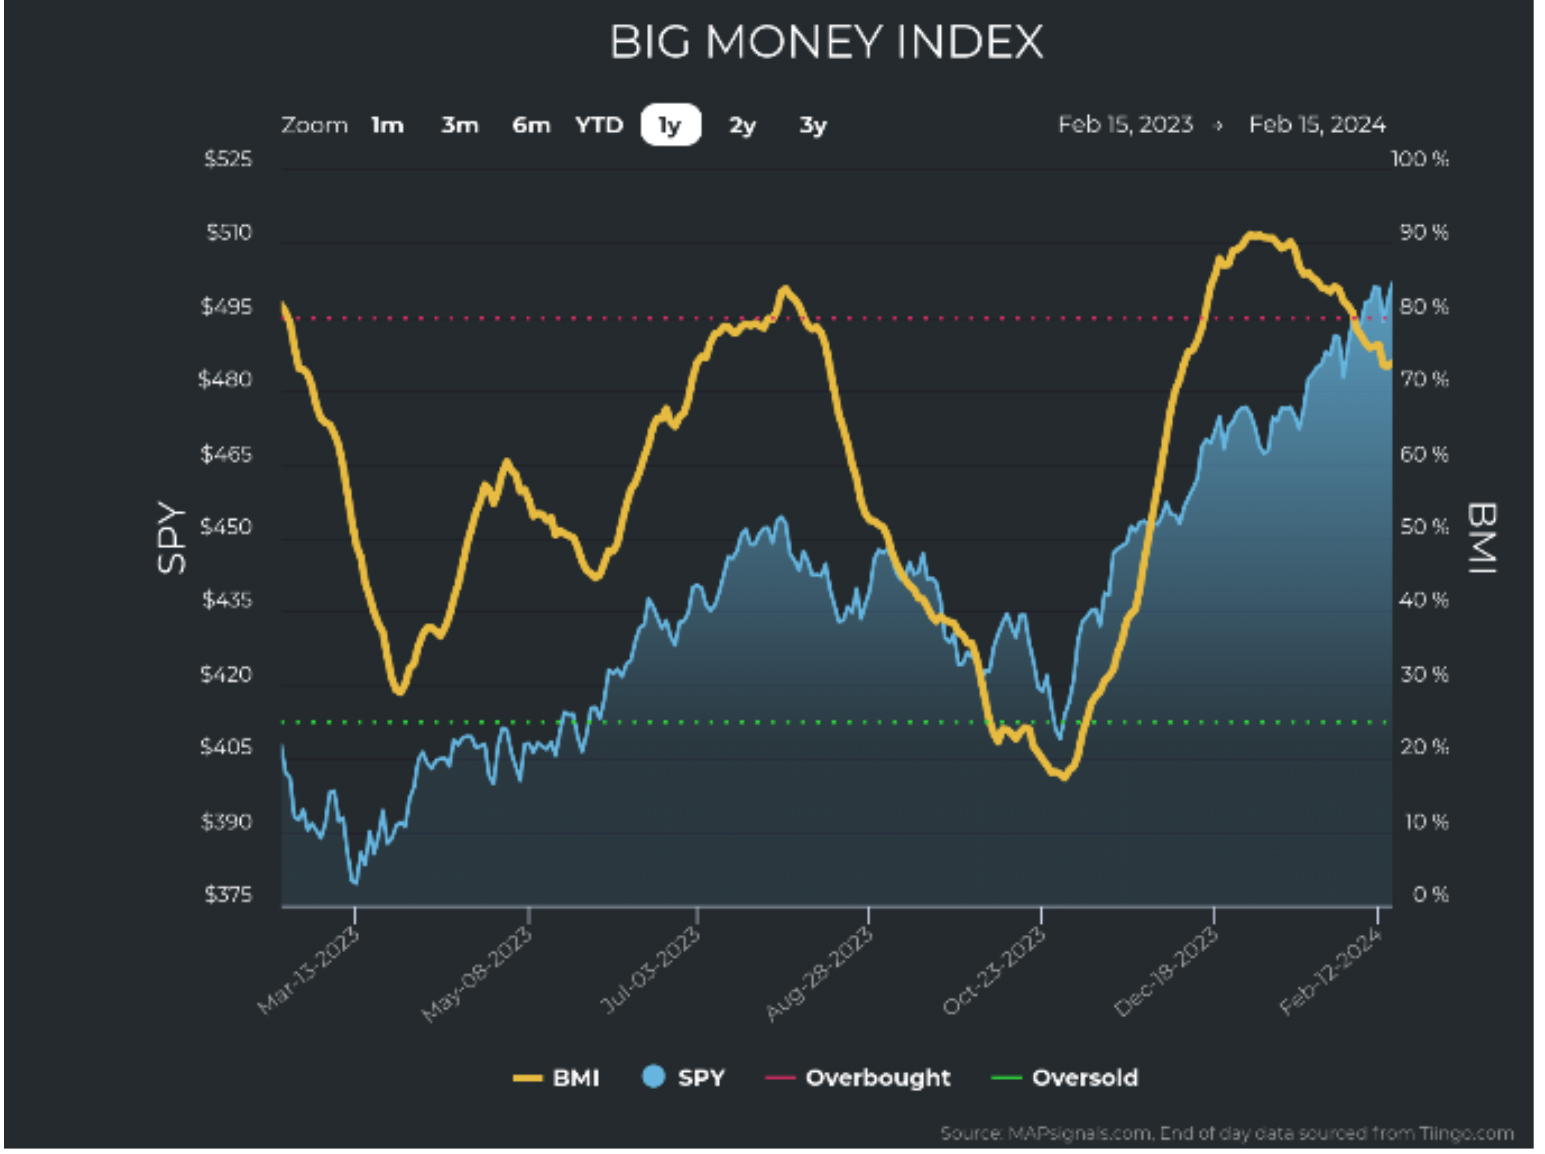
The graph above depicts the Big Money Index (BMI, amber line) and the S&P 500 tracking ETF (SPY, the blue shaded area). Here, we see a clear divergence. The BMI is falling while the market is rising.
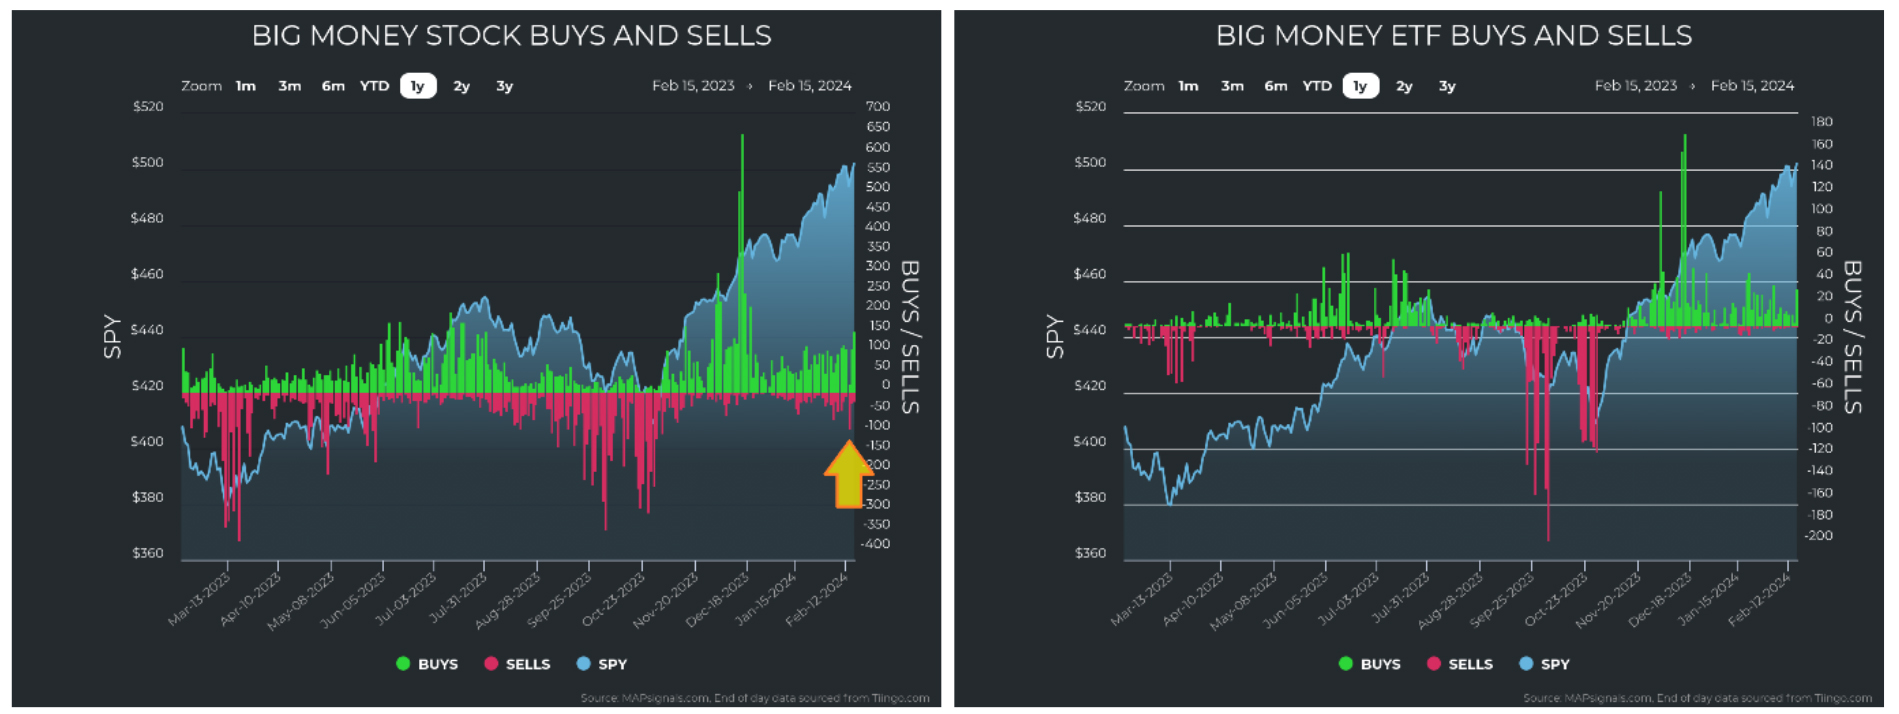
As I detailed last week, this is due to big buying rolling off the 25-day equation that makes up the BMI. This distinction is key, because it’s not falling because of big selling. Remember last Tuesday, when the CPI came out hotter than expected? That caused a stock plunge that ultimately led to a 4+% drop on the small cap Russell 2000 index. The S&P 500 fell, too, but it’s hardly noticeable now (the yellow arrow):
Graphs are for illustrative and discussion purposes only. Please read important disclosures at the end of this commentary.
The key takeaway from the stock and the ETF charts (above) is that selling didn’t increase. Instead, buying is steadily increasing after immense buying days of December fell off the 25-day moving average.
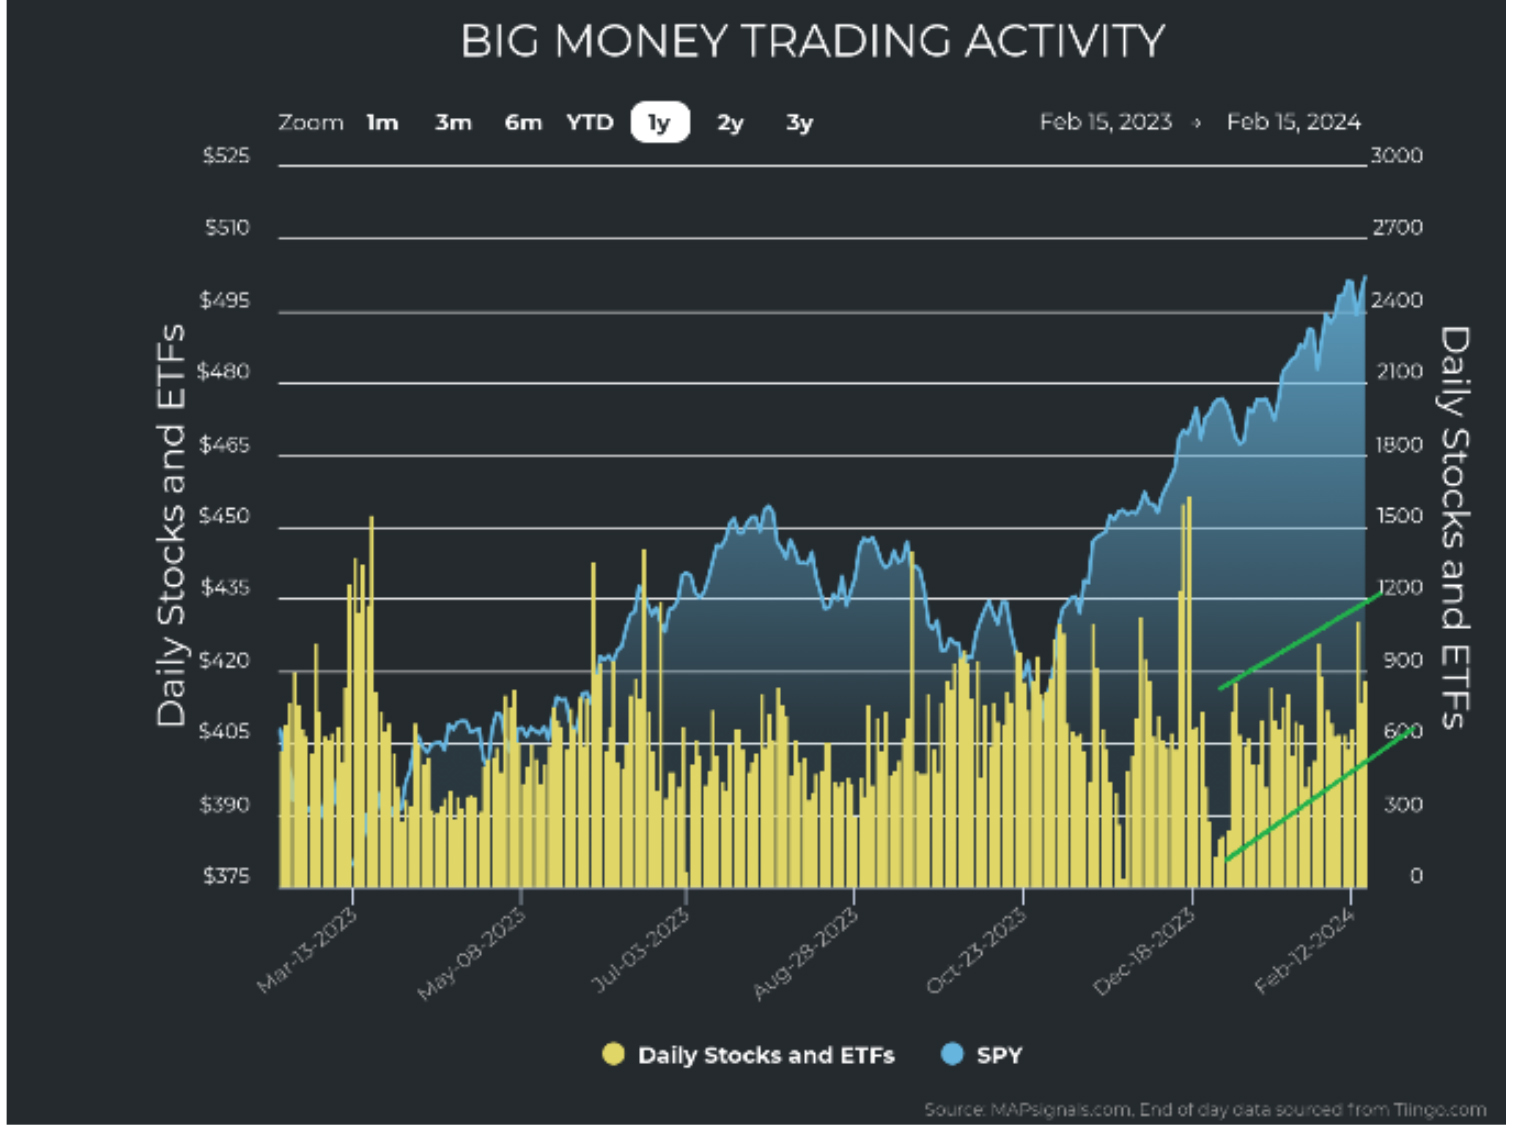
The next chart shows daily numbers of unusually large trades without regard to unusual buying or selling – just big trades. Big volume propelling stocks higher is healthy and sustained. It’s even increasing:
Graphs are for illustrative and discussion purposes only. Please read important disclosures at the end of this commentary.
Now that we have contextualized the market’s sustained strength, let’s contextualize the buying.
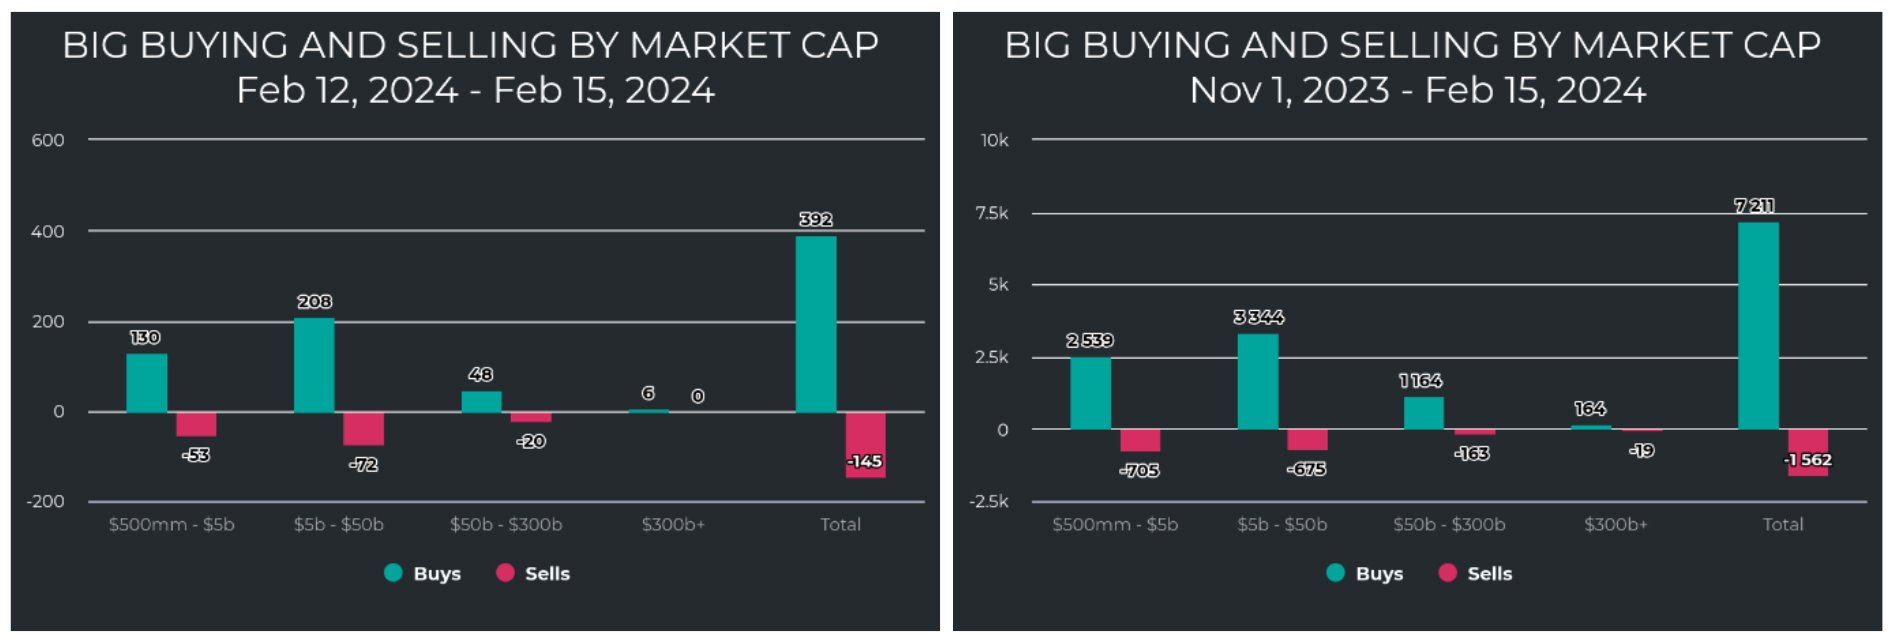
Below (left), we see buying over the last week, distributed by market cap. It’s clear that growth was in demand, despite the Russell 2000’s one-day drop. We see buying concentrated in small- and mid-cap stocks – usually rich with growth companies. This mimics the broader theme since the rally started November 1. You can also see that in the chart on the right:
Graphs are for illustrative and discussion purposes only. Please read important disclosures at the end of this commentary.
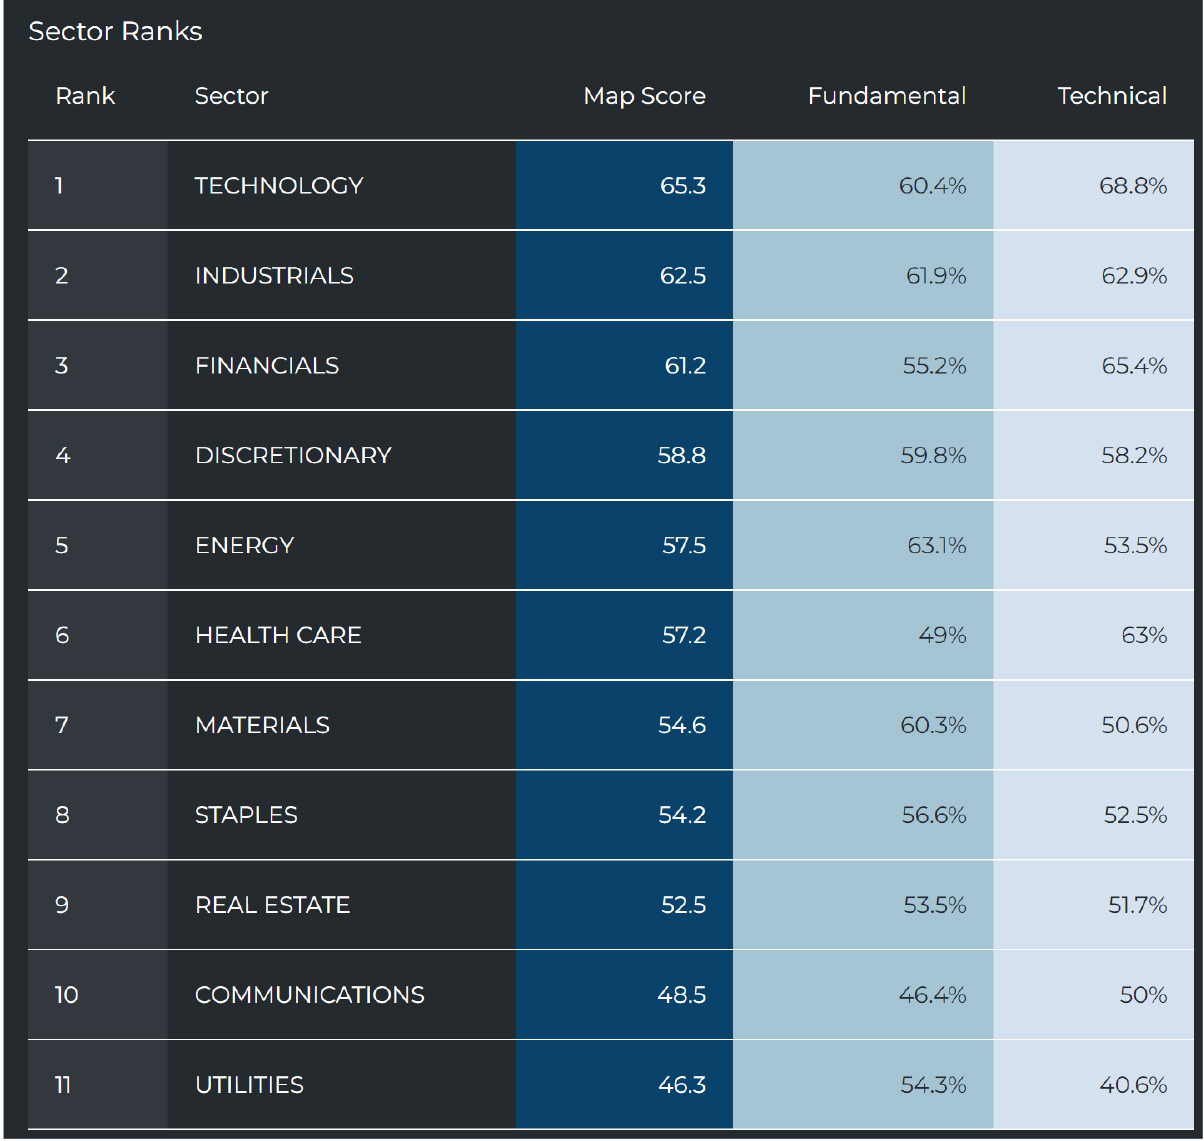
OK, so growth is getting bought by market cap. Now what about sector strength and weakness? This type of analysis gives us a clearer picture as to the market’s strength. You can see, according to MAPsignals data, below, that Technology, Industrials, Financials, Discretionary, and Energy lead the top 5 sectors. Seeing Technology, Industrials, and Discretionary in the top is constructive, since these are the engines of growth and the fuel for a sustained bull market. When these types of companies lead, they indicate a strong economy.
Graphs are for illustrative and discussion purposes only. Please read important disclosures at the end of this commentary.
The opposite is also true. Defensive and rate-sensitive sectors like Staples, Real Estate, Communications and Utilities litter the bottom of the list – the weakest sectors in both fundamental and technical strength.
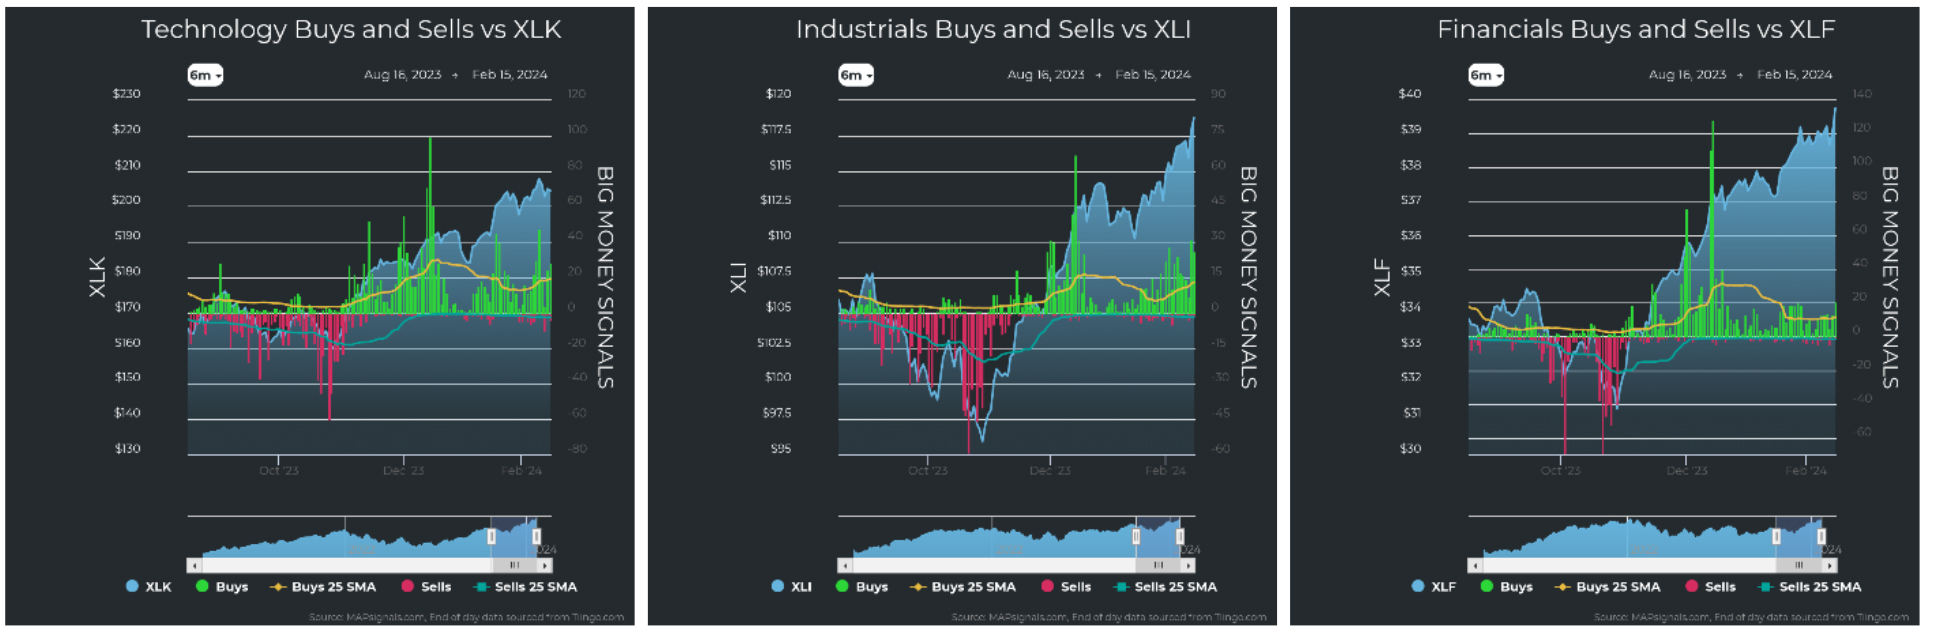
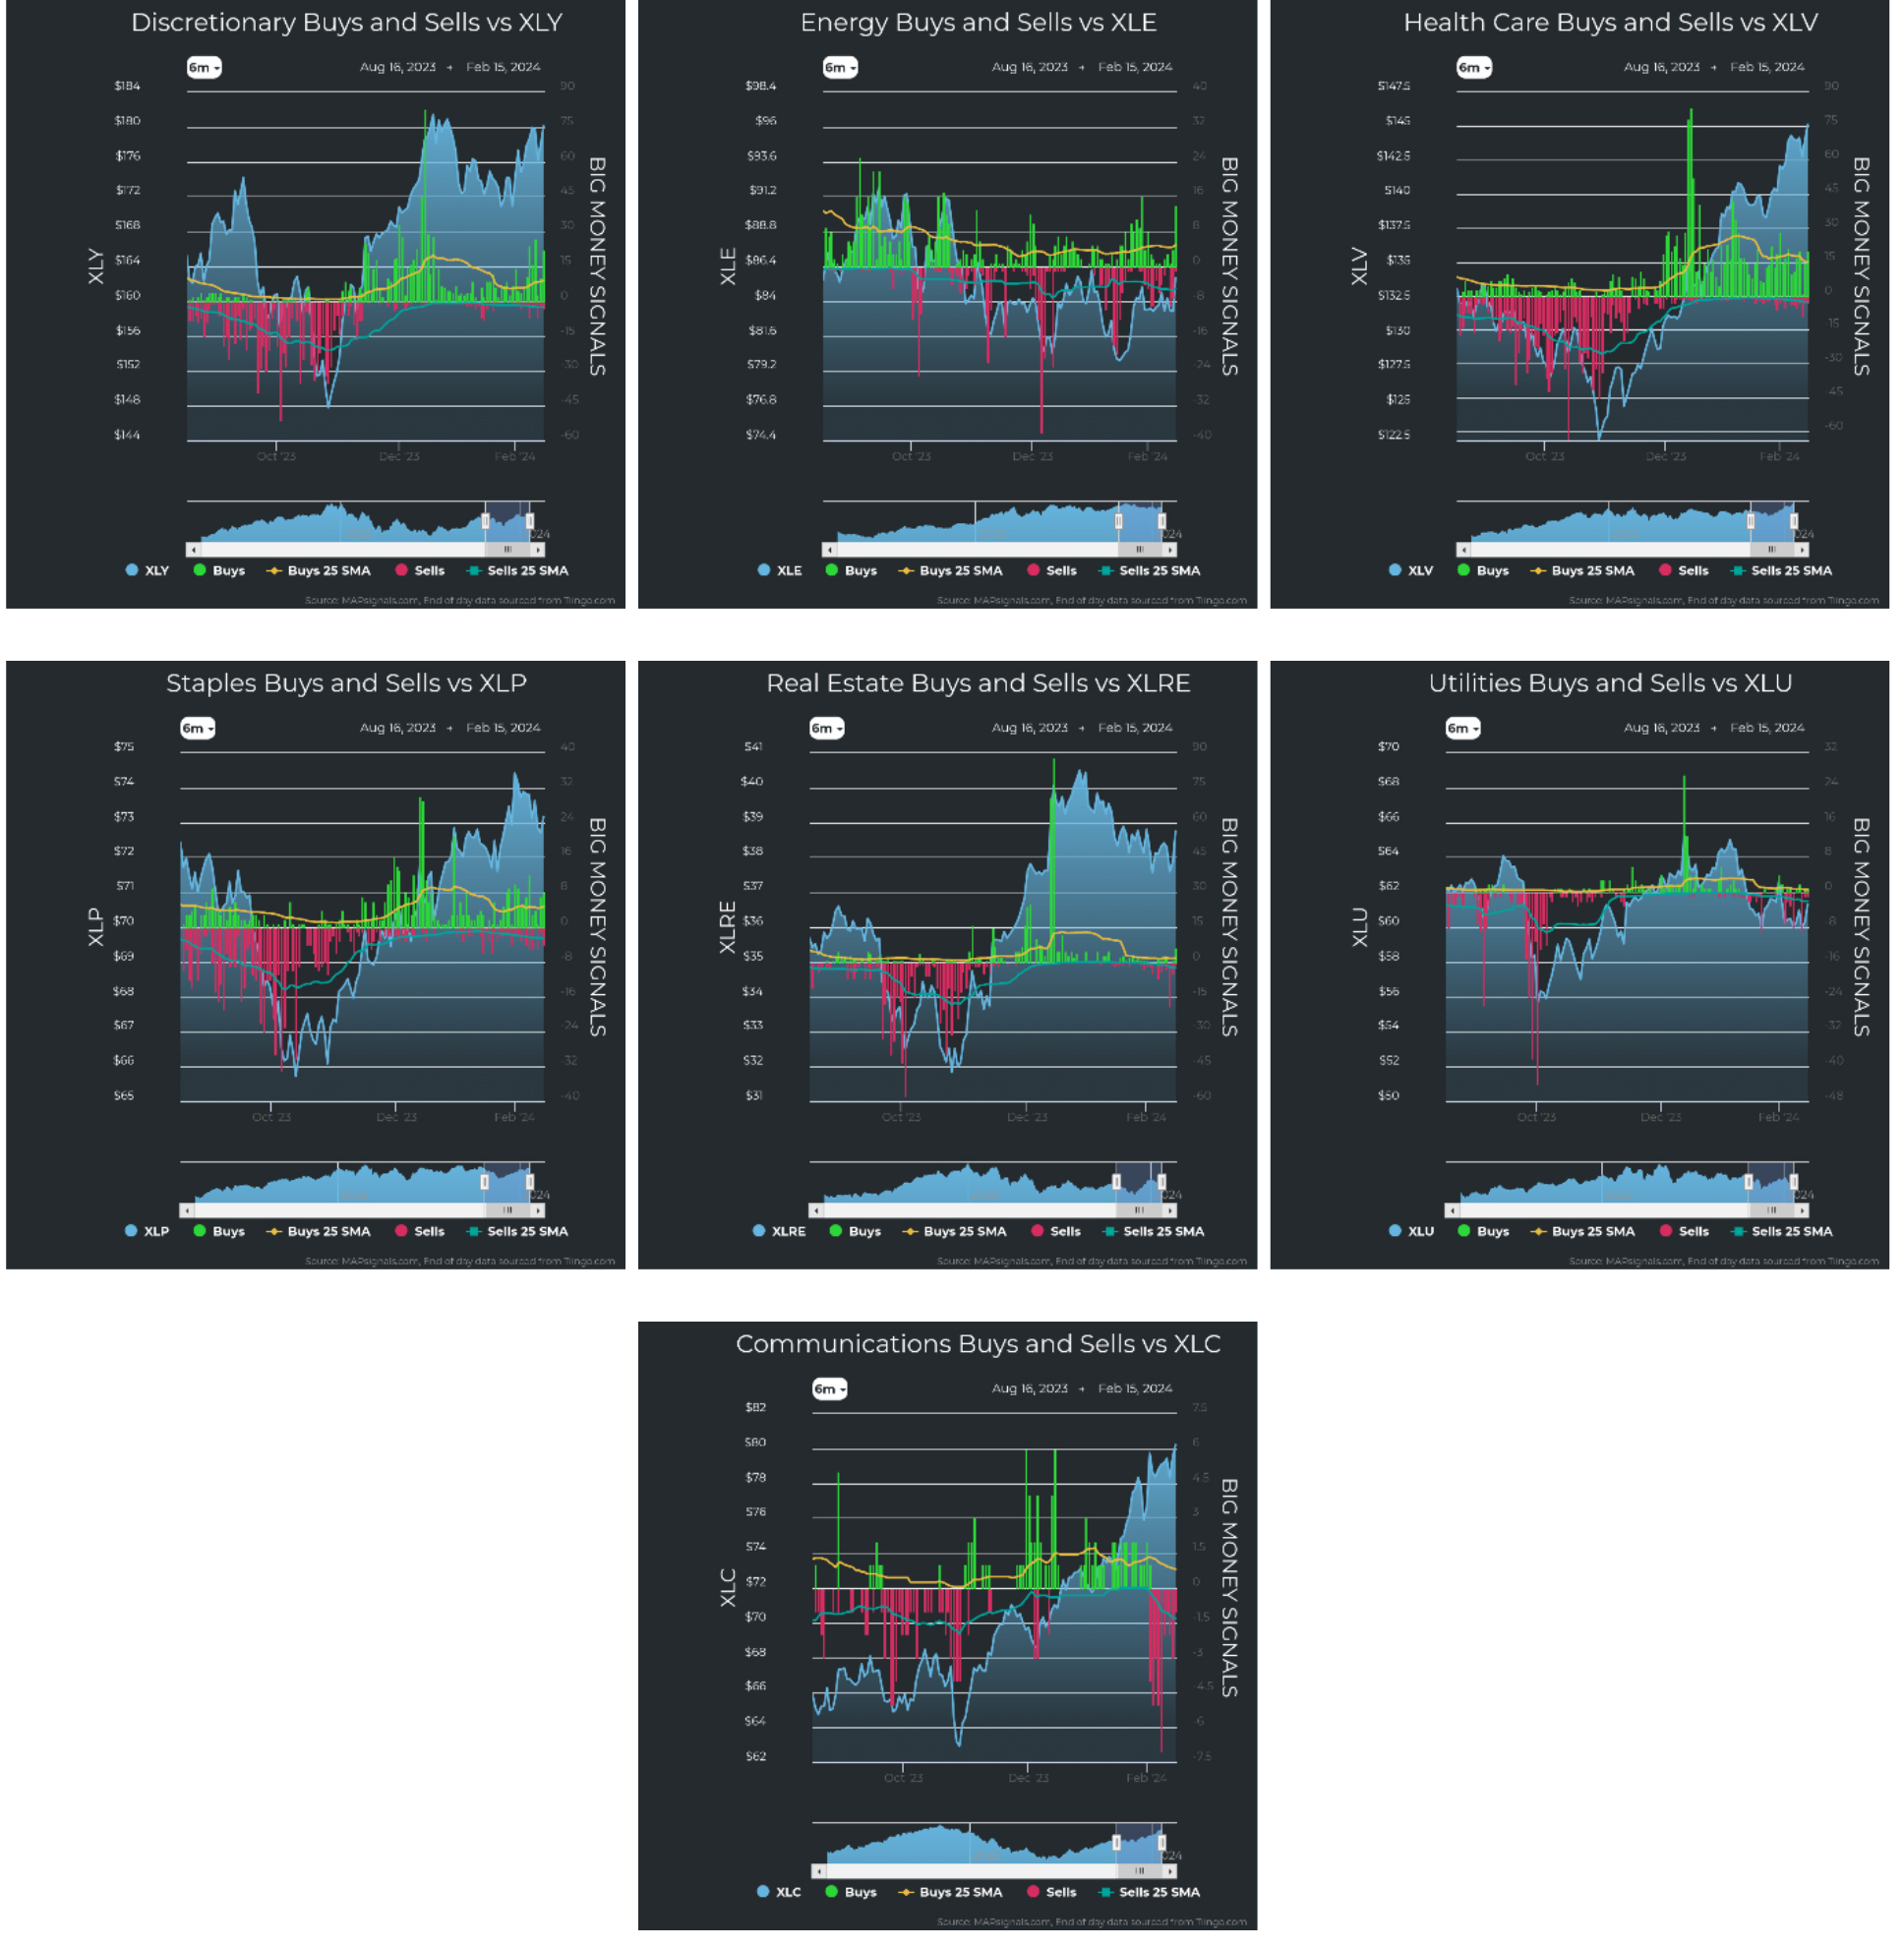
Sometimes we arrive at this point and notice a few sectors are rotting while others are single-handedly propping up the market. Such was the case with tech for much of 2022 until tech finally cracked that fall. But what I see now is something entirely different: Ten of 11 sectors showed virtually no signs of selling:
Graphs are for illustrative and discussion purposes only. Please read important disclosures at the end of this commentary.
And the only sector that exhibited some sell signals is so small (Communications) that I feel it should be lumped into technology. In fact, the Communications sector is the smallest of all sectors, making up only 1.2% of the universe of nearly 6,000 stocks that I track. And when we filter for stocks that can be easily traded by big investors, we get only 31 Communications stocks. That helps explain that big red bar you see in Communications: Only seven 7 stocks were sold in that sector.
So, as I often do, I return to my opening question: When is the market going to crack? I don’t know the exact date – no one does. My strategy is to ride this wave for now, selectively taking partial profits on big winners. This raises some cash to buy after the inevitable pullback, while still staying positioned to participate in further upside gains, should the market keep rising. I suspect that when earnings season slows down, volatility will arrive. My guess is in the next two weeks we would start to see more volatility.
A quick note on earnings: According to FactSet Earnings Insight, as of February 16th, 79% of the S&P 500 companies have reported earnings with 75% beating earnings estimates, and 65% beating sales estimates, so earnings are working. If we use different quantitative glasses to view the markets, we come away with an entirely different narrative than what you will likely conclude if you watch leading financial channels. I prefer it this way, because honestly, I can’t make much sense out of what the media tells us.
“The ability to perceive or think differently is more important than the knowledge gained.” – David Bohm
All content above represents the opinion of Jason Bodner of Navellier & Associates, Inc.
Also In This Issue
A Look Ahead by Louis Navellier
Most Economic Indicators Tell Me the Fed Should Cut Rates Sooner, Not Later
Income Mail by Bryan Perry
Are Banks Prepared for a Commercial Real Estate Reset?
Growth Mail by Gary Alexander
Presidents’ Day Reality: Big Promises, Few Results
Global Mail by Ivan Martchev
Geopolitics May Start to Move the Markets Again
Sector Spotlight by Jason Bodner
For Market Timing Guidance, Put on Your “Quant Goggles”
View Full Archive
Read Past Issues Here

Jason Bodner
MARKETMAIL EDITOR FOR SECTOR SPOTLIGHT
Jason Bodner writes Sector Spotlight in the weekly Marketmail publication and has authored several white papers for the company. He is also Co-Founder of Macro Analytics for Professionals which produces proprietary equity accumulation/distribution research for its clients. Previously, Mr. Bodner served as Director of European Equity Derivatives for Cantor Fitzgerald Europe in London, then moved to the role of Head of Equity Derivatives North America for the same company in New York. He also served as S.V.P. Equity Derivatives for Jefferies, LLC. He received a B.S. in business administration in 1996, with honors, from Skidmore College as a member of the Periclean Honors Society. All content of “Sector Spotlight” represents the opinion of Jason Bodner
Important Disclosures:
Jason Bodner is a co-founder and co-owner of Mapsignals. Mr. Bodner is an independent contractor who is occasionally hired by Navellier & Associates to write an article and or provide opinions for possible use in articles that appear in Navellier & Associates weekly Market Mail. Mr. Bodner is not employed or affiliated with Louis Navellier, Navellier & Associates, Inc., or any other Navellier owned entity. The opinions and statements made here are those of Mr. Bodner and not necessarily those of any other persons or entities. This is not an endorsement, or solicitation or testimonial or investment advice regarding the BMI Index or any statements or recommendations or analysis in the article or the BMI Index or Mapsignals or its products or strategies.
Although information in these reports has been obtained from and is based upon sources that Navellier believes to be reliable, Navellier does not guarantee its accuracy and it may be incomplete or condensed. All opinions and estimates constitute Navellier’s judgment as of the date the report was created and are subject to change without notice. These reports are for informational purposes only and are not a solicitation for the purchase or sale of a security. Any decision to purchase securities mentioned in these reports must take into account existing public information on such securities or any registered prospectus.To the extent permitted by law, neither Navellier & Associates, Inc., nor any of its affiliates, agents, or service providers assumes any liability or responsibility nor owes any duty of care for any consequences of any person acting or refraining to act in reliance on the information contained in this communication or for any decision based on it.
Past performance is no indication of future results. Investment in securities involves significant risk and has the potential for partial or complete loss of funds invested. It should not be assumed that any securities recommendations made by Navellier. in the future will be profitable or equal the performance of securities made in this report. Dividend payments are not guaranteed. The amount of a dividend payment, if any, can vary over time and issuers may reduce dividends paid on securities in the event of a recession or adverse event affecting a specific industry or issuer.
None of the stock information, data, and company information presented herein constitutes a recommendation by Navellier or a solicitation to buy or sell any securities. Any specific securities identified and described do not represent all of the securities purchased, sold, or recommended for advisory clients. The holdings identified do not represent all of the securities purchased, sold, or recommended for advisory clients and the reader should not assume that investments in the securities identified and discussed were or will be profitable.
Information presented is general information that does not take into account your individual circumstances, financial situation, or needs, nor does it present a personalized recommendation to you. Individual stocks presented may not be suitable for every investor. Investment in securities involves significant risk and has the potential for partial or complete loss of funds invested. Investment in fixed income securities has the potential for the investment return and principal value of an investment to fluctuate so that an investor’s holdings, when redeemed, may be worth less than their original cost.
One cannot invest directly in an index. Index is unmanaged and index performance does not reflect deduction of fees, expenses, or taxes. Presentation of Index data does not reflect a belief by Navellier that any stock index constitutes an investment alternative to any Navellier equity strategy or is necessarily comparable to such strategies. Among the most important differences between the Indices and Navellier strategies are that the Navellier equity strategies may (1) incur material management fees, (2) concentrate its investments in relatively few stocks, industries, or sectors, (3) have significantly greater trading activity and related costs, and (4) be significantly more or less volatile than the Indices.
ETF Risk: We may invest in exchange traded funds (“ETFs”) and some of our investment strategies are generally fully invested in ETFs. Like traditional mutual funds, ETFs charge asset-based fees, but they generally do not charge initial sales charges or redemption fees and investors typically pay only customary brokerage fees to buy and sell ETF shares. The fees and costs charged by ETFs held in client accounts will not be deducted from the compensation the client pays Navellier. ETF prices can fluctuate up or down, and a client account could lose money investing in an ETF if the prices of the securities owned by the ETF go down. ETFs are subject to additional risks:
- ETF shares may trade above or below their net asset value;
- An active trading market for an ETF’s shares may not develop or be maintained;
- The value of an ETF may be more volatile than the underlying portfolio of securities the ETF is designed to track;
- The cost of owning shares of the ETF may exceed those a client would incur by directly investing in the underlying securities; and
- Trading of an ETF’s shares may be halted if the listing exchange’s officials deem it appropriate, the shares are delisted from the exchange, or the activation of market-wide “circuit breakers” (which are tied to large decreases in stock prices) halts stock trading generally.
Grader Disclosures: Investment in equity strategies involves substantial risk and has the potential for partial or complete loss of funds invested. The sample portfolio and any accompanying charts are for informational purposes only and are not to be construed as a solicitation to buy or sell any financial instrument and should not be relied upon as the sole factor in an investment making decision. As a matter of normal and important disclosures to you, as a potential investor, please consider the following: The performance presented is not based on any actual securities trading, portfolio, or accounts, and the reported performance of the A, B, C, D, and F portfolios (collectively the “model portfolios”) should be considered mere “paper” or pro forma performance results based on Navellier’s research.
Investors evaluating any of Navellier & Associates, Inc.’s, (or its affiliates’) Investment Products must not use any information presented here, including the performance figures of the model portfolios, in their evaluation of any Navellier Investment Products. Navellier Investment Products include the firm’s mutual funds and managed accounts. The model portfolios, charts, and other information presented do not represent actual funded trades and are not actual funded portfolios. There are material differences between Navellier Investment Products’ portfolios and the model portfolios, research, and performance figures presented here. The model portfolios and the research results (1) may contain stocks or ETFs that are illiquid and difficult to trade; (2) may contain stock or ETF holdings materially different from actual funded Navellier Investment Product portfolios; (3) include the reinvestment of all dividends and other earnings, estimated trading costs, commissions, or management fees; and, (4) may not reflect prices obtained in an actual funded Navellier Investment Product portfolio. For these and other reasons, the reported performances of model portfolios do not reflect the performance results of Navellier’s actually funded and traded Investment Products. In most cases, Navellier’s Investment Products have materially lower performance results than the performances of the model portfolios presented.
This report contains statements that are, or may be considered to be, forward-looking statements. All statements that are not historical facts, including statements about our beliefs or expectations, are “forward-looking statements” within the meaning of The U.S. Private Securities Litigation Reform Act of 1995. These statements may be identified by such forward-looking terminology as “expect,” “estimate,” “plan,” “intend,” “believe,” “anticipate,” “may,” “will,” “should,” “could,” “continue,” “project,” or similar statements or variations of such terms. Our forward-looking statements are based on a series of expectations, assumptions, and projections, are not guarantees of future results or performance, and involve substantial risks and uncertainty as described in Form ADV Part 2A of our filing with the Securities and Exchange Commission (SEC), which is available at www.adviserinfo.sec.gov or by requesting a copy by emailing info@navellier.com. All of our forward-looking statements are as of the date of this report only. We can give no assurance that such expectations or forward-looking statements will prove to be correct. Actual results may differ materially. You are urged to carefully consider all such factors.
FEDERAL TAX ADVICE DISCLAIMER: As required by U.S. Treasury Regulations, you are informed that, to the extent this presentation includes any federal tax advice, the presentation is not written by Navellier to be used, and cannot be used, for the purpose of avoiding federal tax penalties. Navellier does not advise on any income tax requirements or issues. Use of any information presented by Navellier is for general information only and does not represent tax advice either express or implied. You are encouraged to seek professional tax advice for income tax questions and assistance.
IMPORTANT NEWSLETTER DISCLOSURE:The hypothetical performance results for investment newsletters that are authored or edited by Louis Navellier, including Louis Navellier’s Growth Investor, Louis Navellier’s Breakthrough Stocks, Louis Navellier’s Accelerated Profits, and Louis Navellier’s Platinum Club, are not based on any actual securities trading, portfolio, or accounts, and the newsletters’ reported hypothetical performances should be considered mere “paper” or proforma hypothetical performance results and are not actual performance of real world trades. Navellier & Associates, Inc. does not have any relation to or affiliation with the owner of these newsletters. There are material differences between Navellier Investment Products’ portfolios and the InvestorPlace Media, LLC newsletter portfolios authored by Louis Navellier. The InvestorPlace Media, LLC newsletters contain hypothetical performance that do not include transaction costs, advisory fees, or other fees a client might incur if actual investments and trades were being made by an investor. As a result, newsletter performance should not be used to evaluate Navellier Investment services which are separate and different from the newsletters. The owner of the newsletters is InvestorPlace Media, LLC and any questions concerning the newsletters, including any newsletter advertising or hypothetical Newsletter performance claims, (which are calculated solely by Investor Place Media and not Navellier) should be referred to InvestorPlace Media, LLC at (800) 718-8289.
Please note that Navellier & Associates and the Navellier Private Client Group are managed completely independent of the newsletters owned and published by InvestorPlace Media, LLC and written and edited by Louis Navellier, and investment performance of the newsletters should in no way be considered indicative of potential future investment performance for any Navellier & Associates separately managed account portfolio. Potential investors should consult with their financial advisor before investing in any Navellier Investment Product.
Navellier claims compliance with Global Investment Performance Standards (GIPS). To receive a complete list and descriptions of Navellier’s composites and/or a presentation that adheres to the GIPS standards, please contact Navellier or click here. It should not be assumed that any securities recommendations made by Navellier & Associates, Inc. in the future will be profitable or equal the performance of securities made in this report.
FactSet Disclosure: Navellier does not independently calculate the statistical information included in the attached report. The calculation and the information are provided by FactSet, a company not related to Navellier. Although information contained in the report has been obtained from FactSet and is based on sources Navellier believes to be reliable, Navellier does not guarantee its accuracy, and it may be incomplete or condensed. The report and the related FactSet sourced information are provided on an “as is” basis. The user assumes the entire risk of any use made of this information. Investors should consider the report as only a single factor in making their investment decision. The report is for informational purposes only and is not intended as an offer or solicitation for the purchase or sale of a security. FactSet sourced information is the exclusive property of FactSet. Without prior written permission of FactSet, this information may not be reproduced, disseminated or used to create any financial products. All indices are unmanaged and performance of the indices include reinvestment of dividends and interest income, unless otherwise noted, are not illustrative of any particular investment and an investment cannot be made in any index. Past performance is no guarantee of future results.