by Bryan Perry
February 21, 2024
Among the more debatable topics when professional and retail investors gather, the health of the banking sector is often a front-and-center discussion. Will the heavy loan exposure to commercial office space – which requires broad refinancing over the next two years – trigger some sort of systemic calamity in the financial markets? Or will the regional banks catch a break with lower interest rates and a rebound in property values that gets them to the other side of what many believe to be a pending crisis?
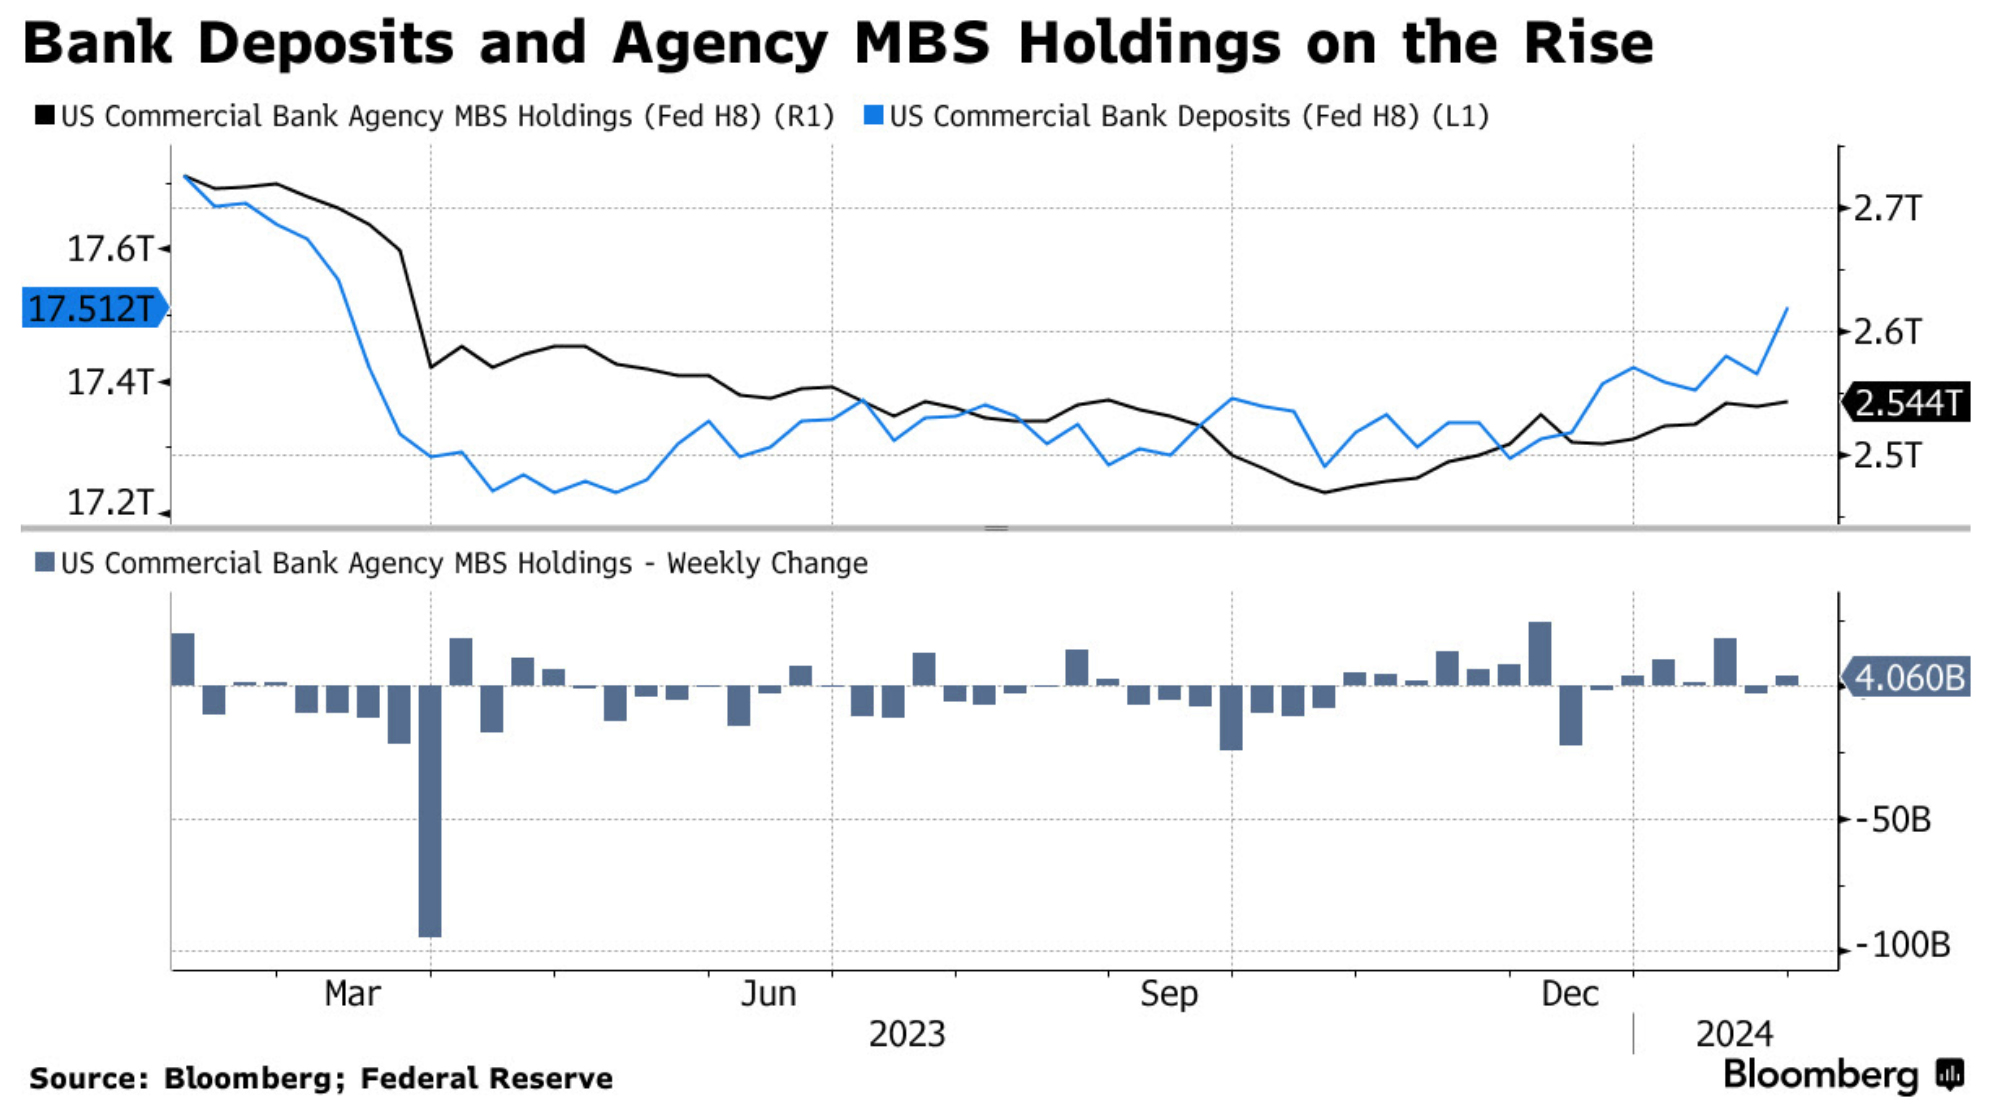
Currently, there doesn’t seem to be a notable wave of high-profile foreclosures or bank closings drawing serious attention away from major areas of market interest – led by AI, earnings, persistent inflation, and concerns of slowing Chinese economy and geopolitical events in the Middle East. Election year politics are not really being factored in yet, but what is evident is that after two years of reducing holdings, U.S. banks have been increasing their purchases of mortgage-backed securities (MBS) and collateralized mortgage obligations (CLOs), and doing so for the past three months, according to the Federal Reserve.
Graphs are for illustrative and discussion purposes only. Please read important disclosures at the end of this commentary.
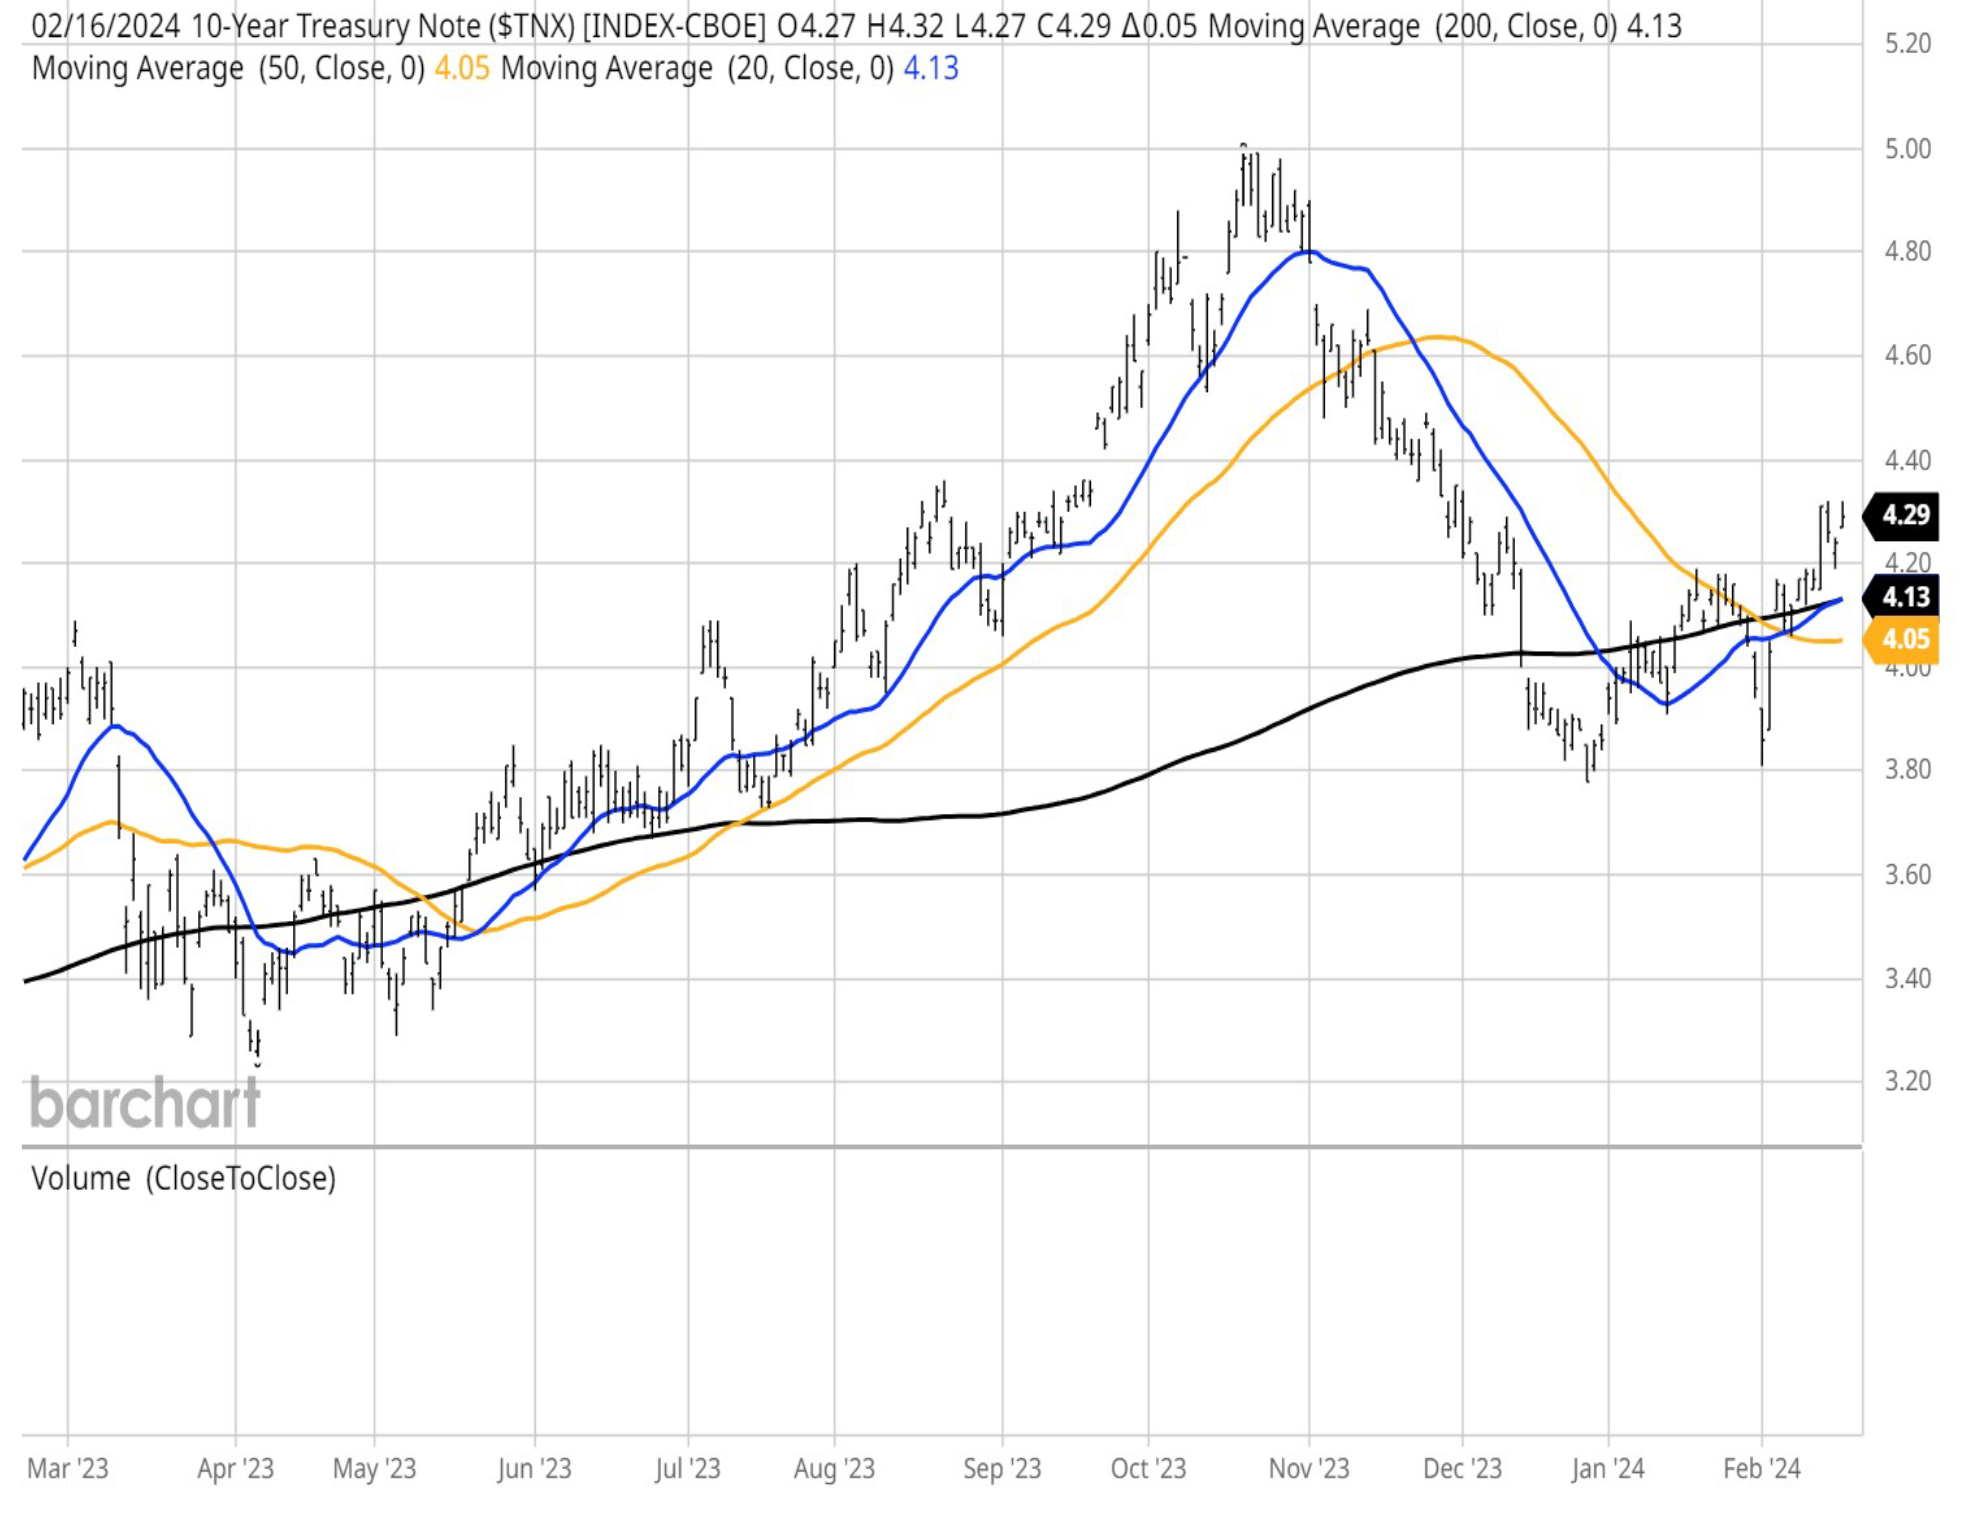
After selling some $800 billion in debt securities over a two-year period during the Fed’s rate tightening cycle, banks and Wall Street firms added $41 billion in debt obligation purchases, which fueled the fourth quarter 2023 rally in domestic credit markets. That buying pressure, based on a hope of six Fed rate cuts, took the yield on the 10-year Treasury down to 3.8% from 5.0% before the reality of a Fed pause in the bond market last month triggered fresh selling pressure, taking the yield back to 4.29% as of February 16.
Graphs are for illustrative and discussion purposes only. Please read important disclosures at the end of this commentary.
Banks finally came around, offering higher yields on customer deposits, attracting fund flows back to their coffers. With tighter lending standards enacted after the regional bank selloff of March 2023, loan volumes are down, forcing banks to find other places to find decent Net Interest Income (NII).
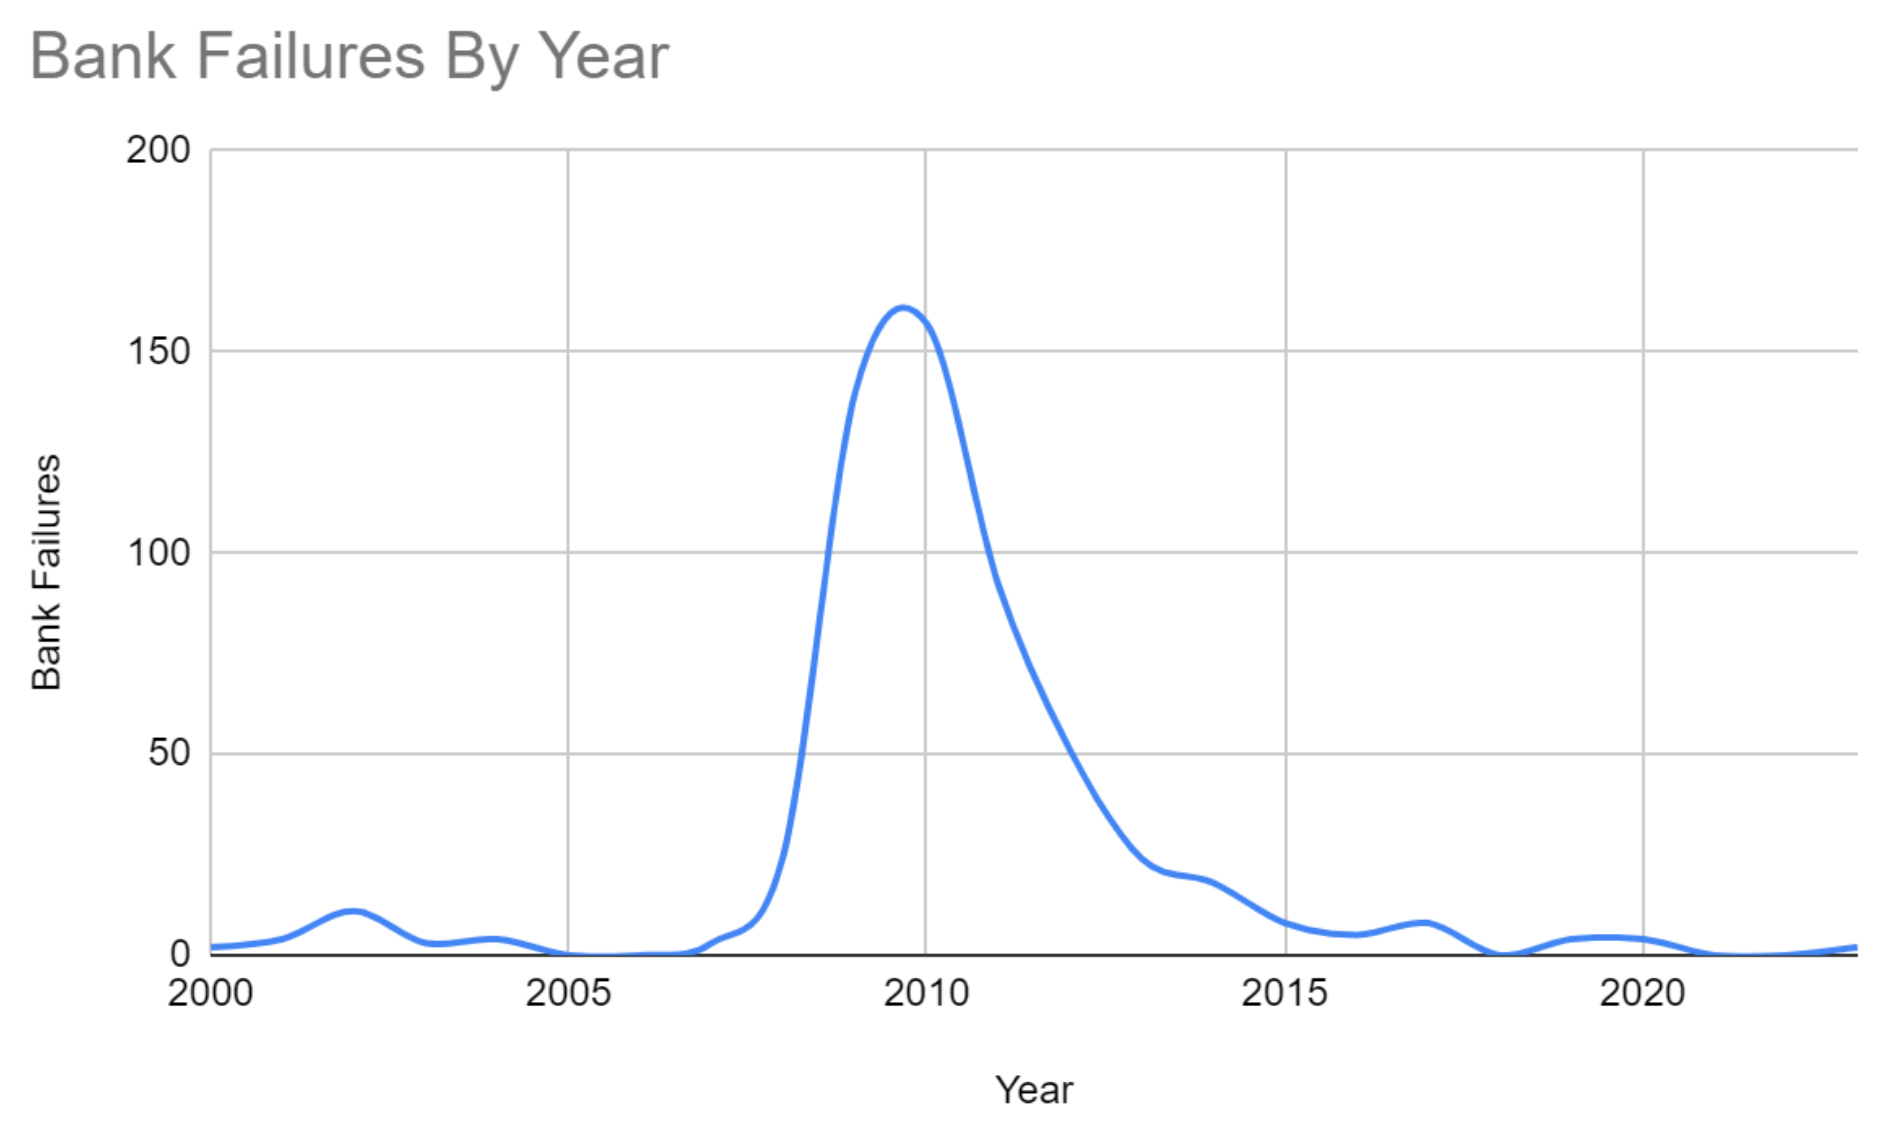
Banks have dodged disaster: The hard landing never materialized, and the Fed’s 2% inflation target has been elusive, with the latest inflation readings moving in the wrong direction. It makes one wonder why there aren’t more bank failures when the banking sector is largely operating through a rear-view mirror.
Forbes reported: “In the wake of the Great Recession, it was typical to see dozens—if not hundreds—of bank failures each year. This slowed significantly from 2015 to 2020, when the U.S. saw an average of fewer than five bank failures per year. Zero banks failed in both 2021 and 2022. Bank collapses were similarly uncommon in the early 2000s. From 2001 to 2007, the U.S. saw an average of just 3.57 bank failures per year. For all of 2023, there were five failures, still well below the long-term norm.”
Graphs are for illustrative and discussion purposes only. Please read important disclosures at the end of this commentary.
The question now is whether (and when) market participants will consider the nearly $1.5 trillion of U.S. commercial real estate debt coming due before the end of 2025, of which $929 billion (20% of total outstanding commercial real estate debt) comes due by the end of 2024 (Mortgage Bankers Association).
According to MSCI Real Assets, commercial property prices are down 21%, from their peak reached in 2022, before the Fed began hiking interest rates. MSCI reported: “Office prices have had the biggest decline, falling an average of 35%. An estimated $85.5 billion of debt on commercial property was considered distressed at the end of 2023, with an additional $234.6 billion of potential distress.”
The big question being asked by borrowers – big and small – is who is going to lend to them?
“Refinancing risks are front and center” for owners of properties from office buildings to stores and warehouses, Morgan Stanley analysts including James Egan wrote in a note this past week. “The maturity wall here is front-loaded. So are the associated risks.” The investment bank estimates office and retail property valuations could fall as much as 40% from peak to trough, increasing the risk of defaults.
It is understood that currently, among the lenders, issuers of commercial mortgage-backed securities (CMBS), collateralized loan obligations (CLO), and investor-driven lenders (private credit) are the biggest players, packaging distressed and potentially distressed loans into bundled securities and resold.
The current situation is like when the late Anthony Bourdain, in the movie “The Big Short,” used the example of making fish stew from good fish that is going bad. Investors should be wary of banks that pile into high-yield buckets of distressed securities, thinking that diversification somehow reduces risk.

Can the larger economy manage a reset in commercial real estate to the tune of several hundred billion dollars? Probably, but not without the likelihood of elevating market volatility, as this next wave of debt comes due for refinancing. We must now wonder whether the appetite for these bundled securities dries up just as the issuance of this wave of debt is rapidly coming to market – in vast amounts.
Just as the regional bank blow-off of March 2023 created one of the best buying opportunities in recent years, the coming great commercial real estate reset might well offer the pullback that provides the same opportunity to buy into today’s greatest stocks. Time will tell, but it sure feels like it is setting up again.
All content above represents the opinion of Bryan Perry of Navellier & Associates, Inc.
Also In This Issue
A Look Ahead by Louis Navellier
Most Economic Indicators Tell Me the Fed Should Cut Rates Sooner, Not Later
Income Mail by Bryan Perry
Are Banks Prepared for a Commercial Real Estate Reset?
Growth Mail by Gary Alexander
Presidents’ Day Reality: Big Promises, Few Results
Global Mail by Ivan Martchev
Geopolitics May Start to Move the Markets Again
Sector Spotlight by Jason Bodner
For Market Timing Guidance, Put on Your “Quant Goggles”
View Full Archive
Read Past Issues Here

Bryan Perry
SENIOR DIRECTOR
Bryan Perry is a Senior Director with Navellier Private Client Group, advising and facilitating high net worth investors in the pursuit of their financial goals.
Bryan’s financial services career spanning the past three decades includes over 20 years of wealth management experience with Wall Street firms that include Bear Stearns, Lehman Brothers and Paine Webber, working with both retail and institutional clients. Bryan earned a B.A. in Political Science from Virginia Polytechnic Institute & State University and currently holds a Series 65 license. All content of “Income Mail” represents the opinion of Bryan Perry
Important Disclosures:
Although information in these reports has been obtained from and is based upon sources that Navellier believes to be reliable, Navellier does not guarantee its accuracy and it may be incomplete or condensed. All opinions and estimates constitute Navellier’s judgment as of the date the report was created and are subject to change without notice. These reports are for informational purposes only and are not a solicitation for the purchase or sale of a security. Any decision to purchase securities mentioned in these reports must take into account existing public information on such securities or any registered prospectus.To the extent permitted by law, neither Navellier & Associates, Inc., nor any of its affiliates, agents, or service providers assumes any liability or responsibility nor owes any duty of care for any consequences of any person acting or refraining to act in reliance on the information contained in this communication or for any decision based on it.
Past performance is no indication of future results. Investment in securities involves significant risk and has the potential for partial or complete loss of funds invested. It should not be assumed that any securities recommendations made by Navellier. in the future will be profitable or equal the performance of securities made in this report. Dividend payments are not guaranteed. The amount of a dividend payment, if any, can vary over time and issuers may reduce dividends paid on securities in the event of a recession or adverse event affecting a specific industry or issuer.
None of the stock information, data, and company information presented herein constitutes a recommendation by Navellier or a solicitation to buy or sell any securities. Any specific securities identified and described do not represent all of the securities purchased, sold, or recommended for advisory clients. The holdings identified do not represent all of the securities purchased, sold, or recommended for advisory clients and the reader should not assume that investments in the securities identified and discussed were or will be profitable.
Information presented is general information that does not take into account your individual circumstances, financial situation, or needs, nor does it present a personalized recommendation to you. Individual stocks presented may not be suitable for every investor. Investment in securities involves significant risk and has the potential for partial or complete loss of funds invested. Investment in fixed income securities has the potential for the investment return and principal value of an investment to fluctuate so that an investor’s holdings, when redeemed, may be worth less than their original cost.
One cannot invest directly in an index. Index is unmanaged and index performance does not reflect deduction of fees, expenses, or taxes. Presentation of Index data does not reflect a belief by Navellier that any stock index constitutes an investment alternative to any Navellier equity strategy or is necessarily comparable to such strategies. Among the most important differences between the Indices and Navellier strategies are that the Navellier equity strategies may (1) incur material management fees, (2) concentrate its investments in relatively few stocks, industries, or sectors, (3) have significantly greater trading activity and related costs, and (4) be significantly more or less volatile than the Indices.
ETF Risk: We may invest in exchange traded funds (“ETFs”) and some of our investment strategies are generally fully invested in ETFs. Like traditional mutual funds, ETFs charge asset-based fees, but they generally do not charge initial sales charges or redemption fees and investors typically pay only customary brokerage fees to buy and sell ETF shares. The fees and costs charged by ETFs held in client accounts will not be deducted from the compensation the client pays Navellier. ETF prices can fluctuate up or down, and a client account could lose money investing in an ETF if the prices of the securities owned by the ETF go down. ETFs are subject to additional risks:
- ETF shares may trade above or below their net asset value;
- An active trading market for an ETF’s shares may not develop or be maintained;
- The value of an ETF may be more volatile than the underlying portfolio of securities the ETF is designed to track;
- The cost of owning shares of the ETF may exceed those a client would incur by directly investing in the underlying securities; and
- Trading of an ETF’s shares may be halted if the listing exchange’s officials deem it appropriate, the shares are delisted from the exchange, or the activation of market-wide “circuit breakers” (which are tied to large decreases in stock prices) halts stock trading generally.
Grader Disclosures: Investment in equity strategies involves substantial risk and has the potential for partial or complete loss of funds invested. The sample portfolio and any accompanying charts are for informational purposes only and are not to be construed as a solicitation to buy or sell any financial instrument and should not be relied upon as the sole factor in an investment making decision. As a matter of normal and important disclosures to you, as a potential investor, please consider the following: The performance presented is not based on any actual securities trading, portfolio, or accounts, and the reported performance of the A, B, C, D, and F portfolios (collectively the “model portfolios”) should be considered mere “paper” or pro forma performance results based on Navellier’s research.
Investors evaluating any of Navellier & Associates, Inc.’s, (or its affiliates’) Investment Products must not use any information presented here, including the performance figures of the model portfolios, in their evaluation of any Navellier Investment Products. Navellier Investment Products include the firm’s mutual funds and managed accounts. The model portfolios, charts, and other information presented do not represent actual funded trades and are not actual funded portfolios. There are material differences between Navellier Investment Products’ portfolios and the model portfolios, research, and performance figures presented here. The model portfolios and the research results (1) may contain stocks or ETFs that are illiquid and difficult to trade; (2) may contain stock or ETF holdings materially different from actual funded Navellier Investment Product portfolios; (3) include the reinvestment of all dividends and other earnings, estimated trading costs, commissions, or management fees; and, (4) may not reflect prices obtained in an actual funded Navellier Investment Product portfolio. For these and other reasons, the reported performances of model portfolios do not reflect the performance results of Navellier’s actually funded and traded Investment Products. In most cases, Navellier’s Investment Products have materially lower performance results than the performances of the model portfolios presented.
This report contains statements that are, or may be considered to be, forward-looking statements. All statements that are not historical facts, including statements about our beliefs or expectations, are “forward-looking statements” within the meaning of The U.S. Private Securities Litigation Reform Act of 1995. These statements may be identified by such forward-looking terminology as “expect,” “estimate,” “plan,” “intend,” “believe,” “anticipate,” “may,” “will,” “should,” “could,” “continue,” “project,” or similar statements or variations of such terms. Our forward-looking statements are based on a series of expectations, assumptions, and projections, are not guarantees of future results or performance, and involve substantial risks and uncertainty as described in Form ADV Part 2A of our filing with the Securities and Exchange Commission (SEC), which is available at www.adviserinfo.sec.gov or by requesting a copy by emailing info@navellier.com. All of our forward-looking statements are as of the date of this report only. We can give no assurance that such expectations or forward-looking statements will prove to be correct. Actual results may differ materially. You are urged to carefully consider all such factors.
FEDERAL TAX ADVICE DISCLAIMER: As required by U.S. Treasury Regulations, you are informed that, to the extent this presentation includes any federal tax advice, the presentation is not written by Navellier to be used, and cannot be used, for the purpose of avoiding federal tax penalties. Navellier does not advise on any income tax requirements or issues. Use of any information presented by Navellier is for general information only and does not represent tax advice either express or implied. You are encouraged to seek professional tax advice for income tax questions and assistance.
IMPORTANT NEWSLETTER DISCLOSURE:The hypothetical performance results for investment newsletters that are authored or edited by Louis Navellier, including Louis Navellier’s Growth Investor, Louis Navellier’s Breakthrough Stocks, Louis Navellier’s Accelerated Profits, and Louis Navellier’s Platinum Club, are not based on any actual securities trading, portfolio, or accounts, and the newsletters’ reported hypothetical performances should be considered mere “paper” or proforma hypothetical performance results and are not actual performance of real world trades. Navellier & Associates, Inc. does not have any relation to or affiliation with the owner of these newsletters. There are material differences between Navellier Investment Products’ portfolios and the InvestorPlace Media, LLC newsletter portfolios authored by Louis Navellier. The InvestorPlace Media, LLC newsletters contain hypothetical performance that do not include transaction costs, advisory fees, or other fees a client might incur if actual investments and trades were being made by an investor. As a result, newsletter performance should not be used to evaluate Navellier Investment services which are separate and different from the newsletters. The owner of the newsletters is InvestorPlace Media, LLC and any questions concerning the newsletters, including any newsletter advertising or hypothetical Newsletter performance claims, (which are calculated solely by Investor Place Media and not Navellier) should be referred to InvestorPlace Media, LLC at (800) 718-8289.
Please note that Navellier & Associates and the Navellier Private Client Group are managed completely independent of the newsletters owned and published by InvestorPlace Media, LLC and written and edited by Louis Navellier, and investment performance of the newsletters should in no way be considered indicative of potential future investment performance for any Navellier & Associates separately managed account portfolio. Potential investors should consult with their financial advisor before investing in any Navellier Investment Product.
Navellier claims compliance with Global Investment Performance Standards (GIPS). To receive a complete list and descriptions of Navellier’s composites and/or a presentation that adheres to the GIPS standards, please contact Navellier or click here. It should not be assumed that any securities recommendations made by Navellier & Associates, Inc. in the future will be profitable or equal the performance of securities made in this report.
FactSet Disclosure: Navellier does not independently calculate the statistical information included in the attached report. The calculation and the information are provided by FactSet, a company not related to Navellier. Although information contained in the report has been obtained from FactSet and is based on sources Navellier believes to be reliable, Navellier does not guarantee its accuracy, and it may be incomplete or condensed. The report and the related FactSet sourced information are provided on an “as is” basis. The user assumes the entire risk of any use made of this information. Investors should consider the report as only a single factor in making their investment decision. The report is for informational purposes only and is not intended as an offer or solicitation for the purchase or sale of a security. FactSet sourced information is the exclusive property of FactSet. Without prior written permission of FactSet, this information may not be reproduced, disseminated or used to create any financial products. All indices are unmanaged and performance of the indices include reinvestment of dividends and interest income, unless otherwise noted, are not illustrative of any particular investment and an investment cannot be made in any index. Past performance is no guarantee of future results.