by Bryan Perry
November 14, 2023
For the past month, the number and severity of risks to the bond and stock markets has risen, with some pundits wondering just how the market can trade so confidently higher when there are so many large-scale events unfolding that threaten to pose systemic risk to the U.S. and global financial markets.
Let’s start with an easy one – a “sleeper” that caught everyone off guard. At last week’s 30-year Treasury auction, in which a mere $26 billion in debt was being bid for, the Industrial and Commercial Bank of China (ICBC), the world’s largest lender by assets, said its financial services experienced a ransomware attack that reportedly disrupted their trading of Treasuries. That attack prevented ICBC from settling trades and rendered the bank unable to clear commitments that forced the bank to send the settlement details to its counter parties by a messenger carrying a thumb drive – a heroic effort to limit the damage.
The ransomware attack was orchestrated by a suspected perpetrator with ties to Russia. Bloomberg reported last Friday: “The incident spotlights a danger that bank leaders concede keeps them up at night – the prospect of a cyberattack that could someday cripple a key piece of the financial system’s wiring, setting off a cascade of disruptions. Even brief episodes prompt bank leaders and their government overseers to call for more vigilance. ‘This is a true shock to large banks around the world,’ said Marcus Murray, the founder of Swedish cybersecurity firm Trusec. ‘The ICBC hack will make large banks around the globe race to improve their defenses, starting today.’ This particular hack affected about $9 billion …But imagine if the hackers were able to force the auction to seize up and sever trading altogether.”
Even so, the auction was rated D- by CNBC’s Rick Santelli, after primary dealers had to take in 25% of the auctioned paper that didn’t sell. The bond and equity markets rallied sharply at the next trading session, led by mega-cap technology stocks on lower-than-forecast consumer sentiment data and AI euphoria.
Here is where it gets a bit weird. On Friday, the University of Michigan Consumer Sentiment report for October crossed the tape at 60.4 versus consensus expectations of 63.7, marking the fourth straight monthly decline. The Current Economic Conditions Index dropped to 65.7 from 70.6; year-ahead inflation expectations rose to 4.4% from 4.2%, hitting their highest level since November 2022 and five-year inflation expectations rose to 3.2% from 3.0%, the highest reading since 2011. After all that, the market rallied 1.6%, with Nasdaq bolting higher by 2.0%, led by none other than the Teflon tech sector.
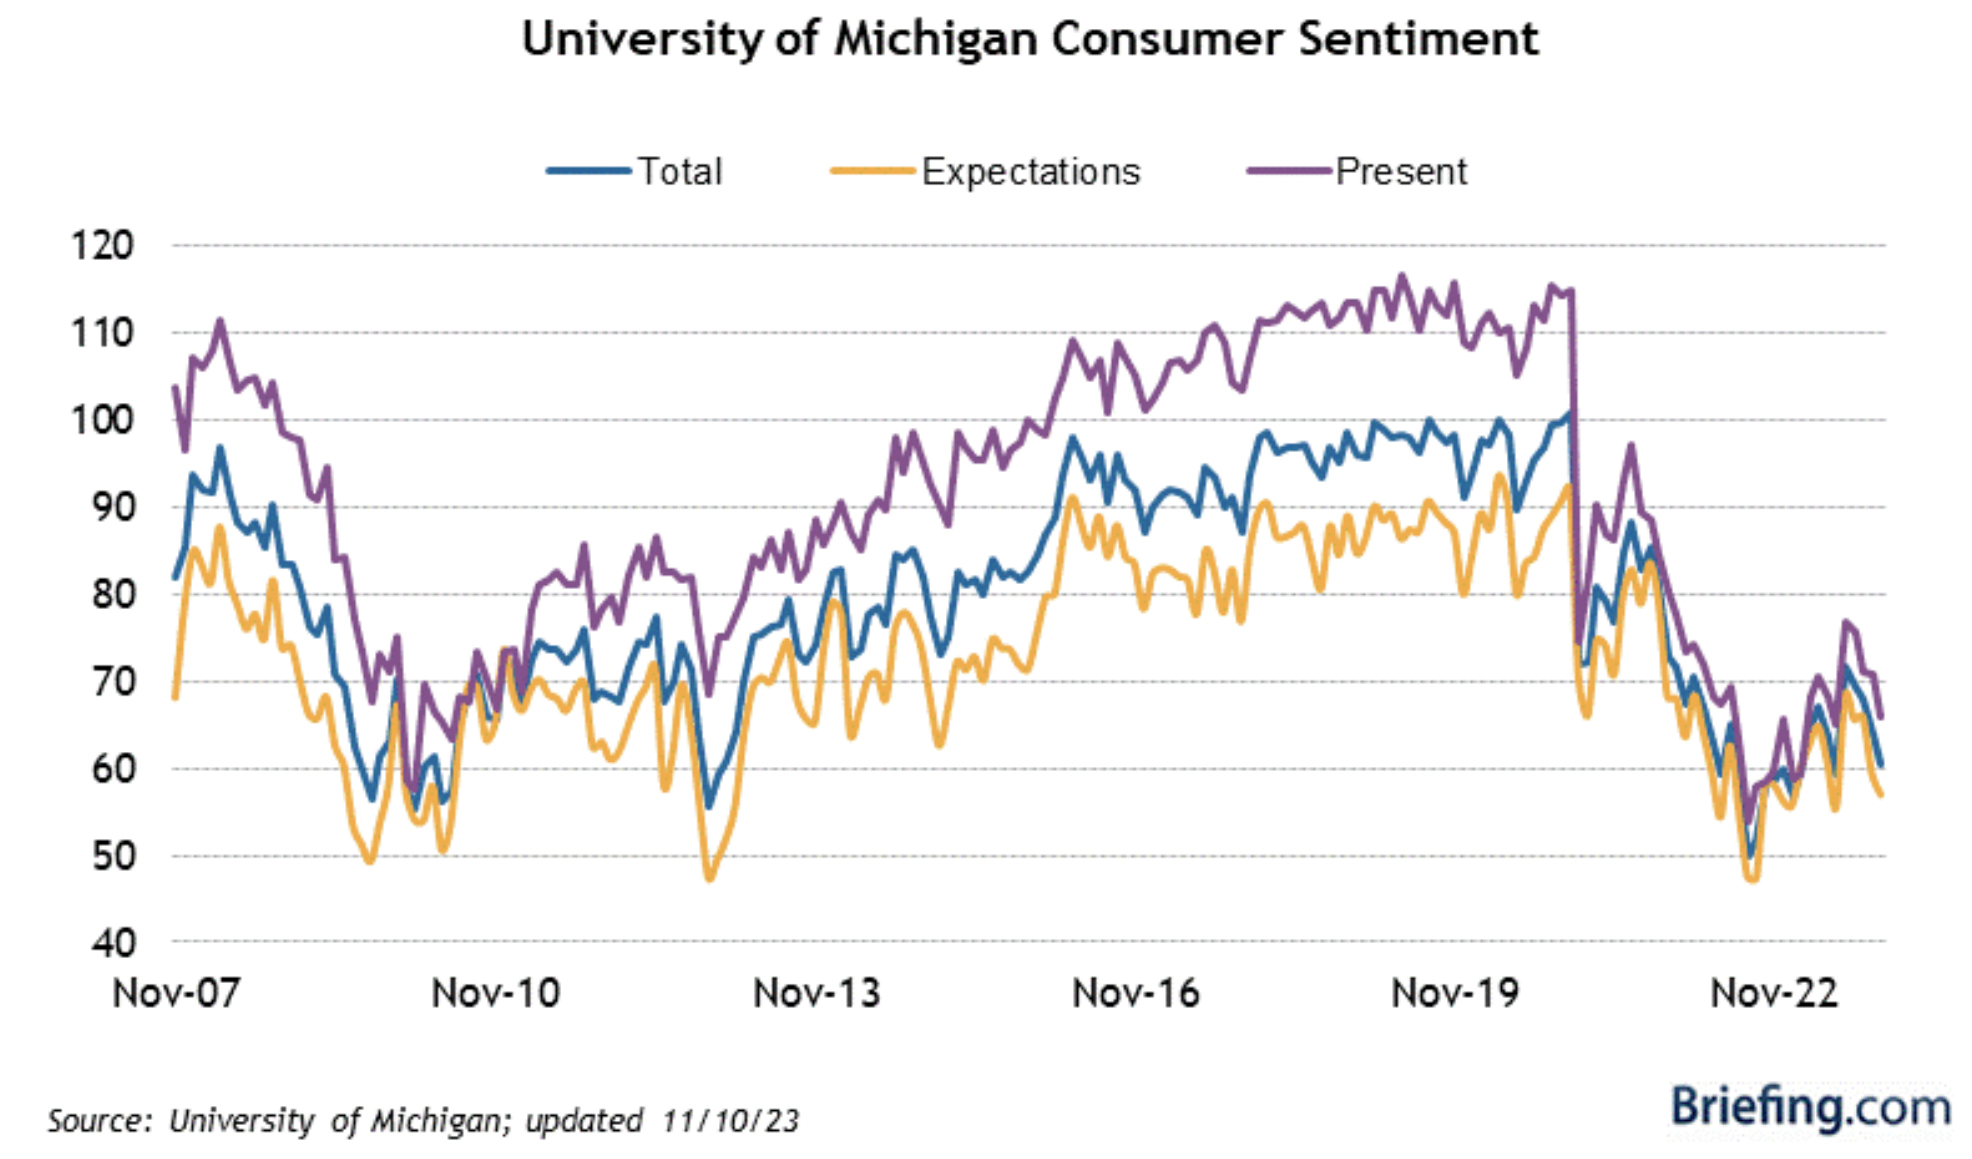
Graphs are for illustrative and discussion purposes only. Please read important disclosures at the end of this commentary.
Despite new restrictions on chip exports to China, semiconductor and semiconductor equipment stocks raced higher in front of this week’s meeting between President Biden and China’s Xi Jinping at the Asia-Pacific Economic Cooperation summit in San Francisco. The two leaders have only met once since Biden was elected, and I do not expect this meeting to go well at all. Xi wants Biden to reject the independence of Taiwan and to reiterate America’s commitment to “business as usual” with Xi’s regime in China.
For its part, the U.S. contingent will want to weigh in on China’s ongoing support for Russia in Ukraine, among other items that are set to produce nothing in the way of any form of concessions on the part of China. As it is, the chip and chip equipment companies are engineering workaround technology to offer products that comply with export provisions, not wanting to be cut off from the lucrative Chinese market.
The Coming AI War Between “Mr. Softie” and Mr. Musk
On a completely different note – and one that I find pretty stunning – on Sunday, November 5, before the tech sector scored its big week – led by none other than “Mr. Softie” (Microsoft) and the “all the rage” ChatGPT open generative AI tool, Elon Musk revealed his own artificial intelligence bot to challenge ChatGPT, claiming the prototype is already superior to ChatGPT 3.5, across several benchmarks.
According to CNBC: “Dubbed Grok, it’s the first product of Musk’s xAI company and is now in testing with a limited group of U.S. users. Grok is being developed with data from Musk’s X, formerly Twitter, and is thus better informed on the latest developments than alternative bots with static datasets, the company’s website said. It’s also designed to answer ‘with a bit of wit and has a rebellious streak,’….”
xAI launched in July with a team stacked with former employees of OpenAI, DeepMind and more.
Here’s the crazy thing: even after the Musk announcement that Grok can run laps around ChatGPT 3.5, shares of Mr. Softie traded to a new all-time high. Why? My guess is that Microsoft is considered the quintessential “underinvested fund manager year-end performance pressure safety trade.” But, its fortress balance sheet, company running on all cylinders and first to market AI leadership, is now in question.
Let’s not forget that Musk was part of OpenAI in the founding days but stopped backing the company after a disagreement with senior management over the speed and nature of AI’s technological advancement, suggesting that OpenAI wasn’t doing enough to ensure safe development.
Now, X (formerly Twitter) is rumored to offer Grok at $17 per month. One of the standout features of Grok is its access to real time data from X, a unique advantage by allowing it to provide the latest information on current events and happenings, not available on ChatGPT and other chatbots.
My point is that on any other day, news of the Grok release would have had a wrecking ball-like impact on the leading AI player. But with no way to invest in Grok, the market took the news as if the AI race to become the superior Large Language Model (LLM) is a catalyst to bid-up shares of leading AI stocks and the rest of the tech sector against what was largely just an OK earnings season for the broader sector.
A lackluster earnings season was forgiven when bonds rallied, implying lower rates will fix all things.
In any event, investors are in a lopsided market. A closer look at last week’s impressive rally for the major averages showed that only the tech sector was a true standout. The rally in tech stocks masks a lot of other areas under stress. The one-year charts of consumer staples, financials, healthcare, materials, real estate, energy and utilities look downright ugly. Except for tech, nearly all other charts are lagging.
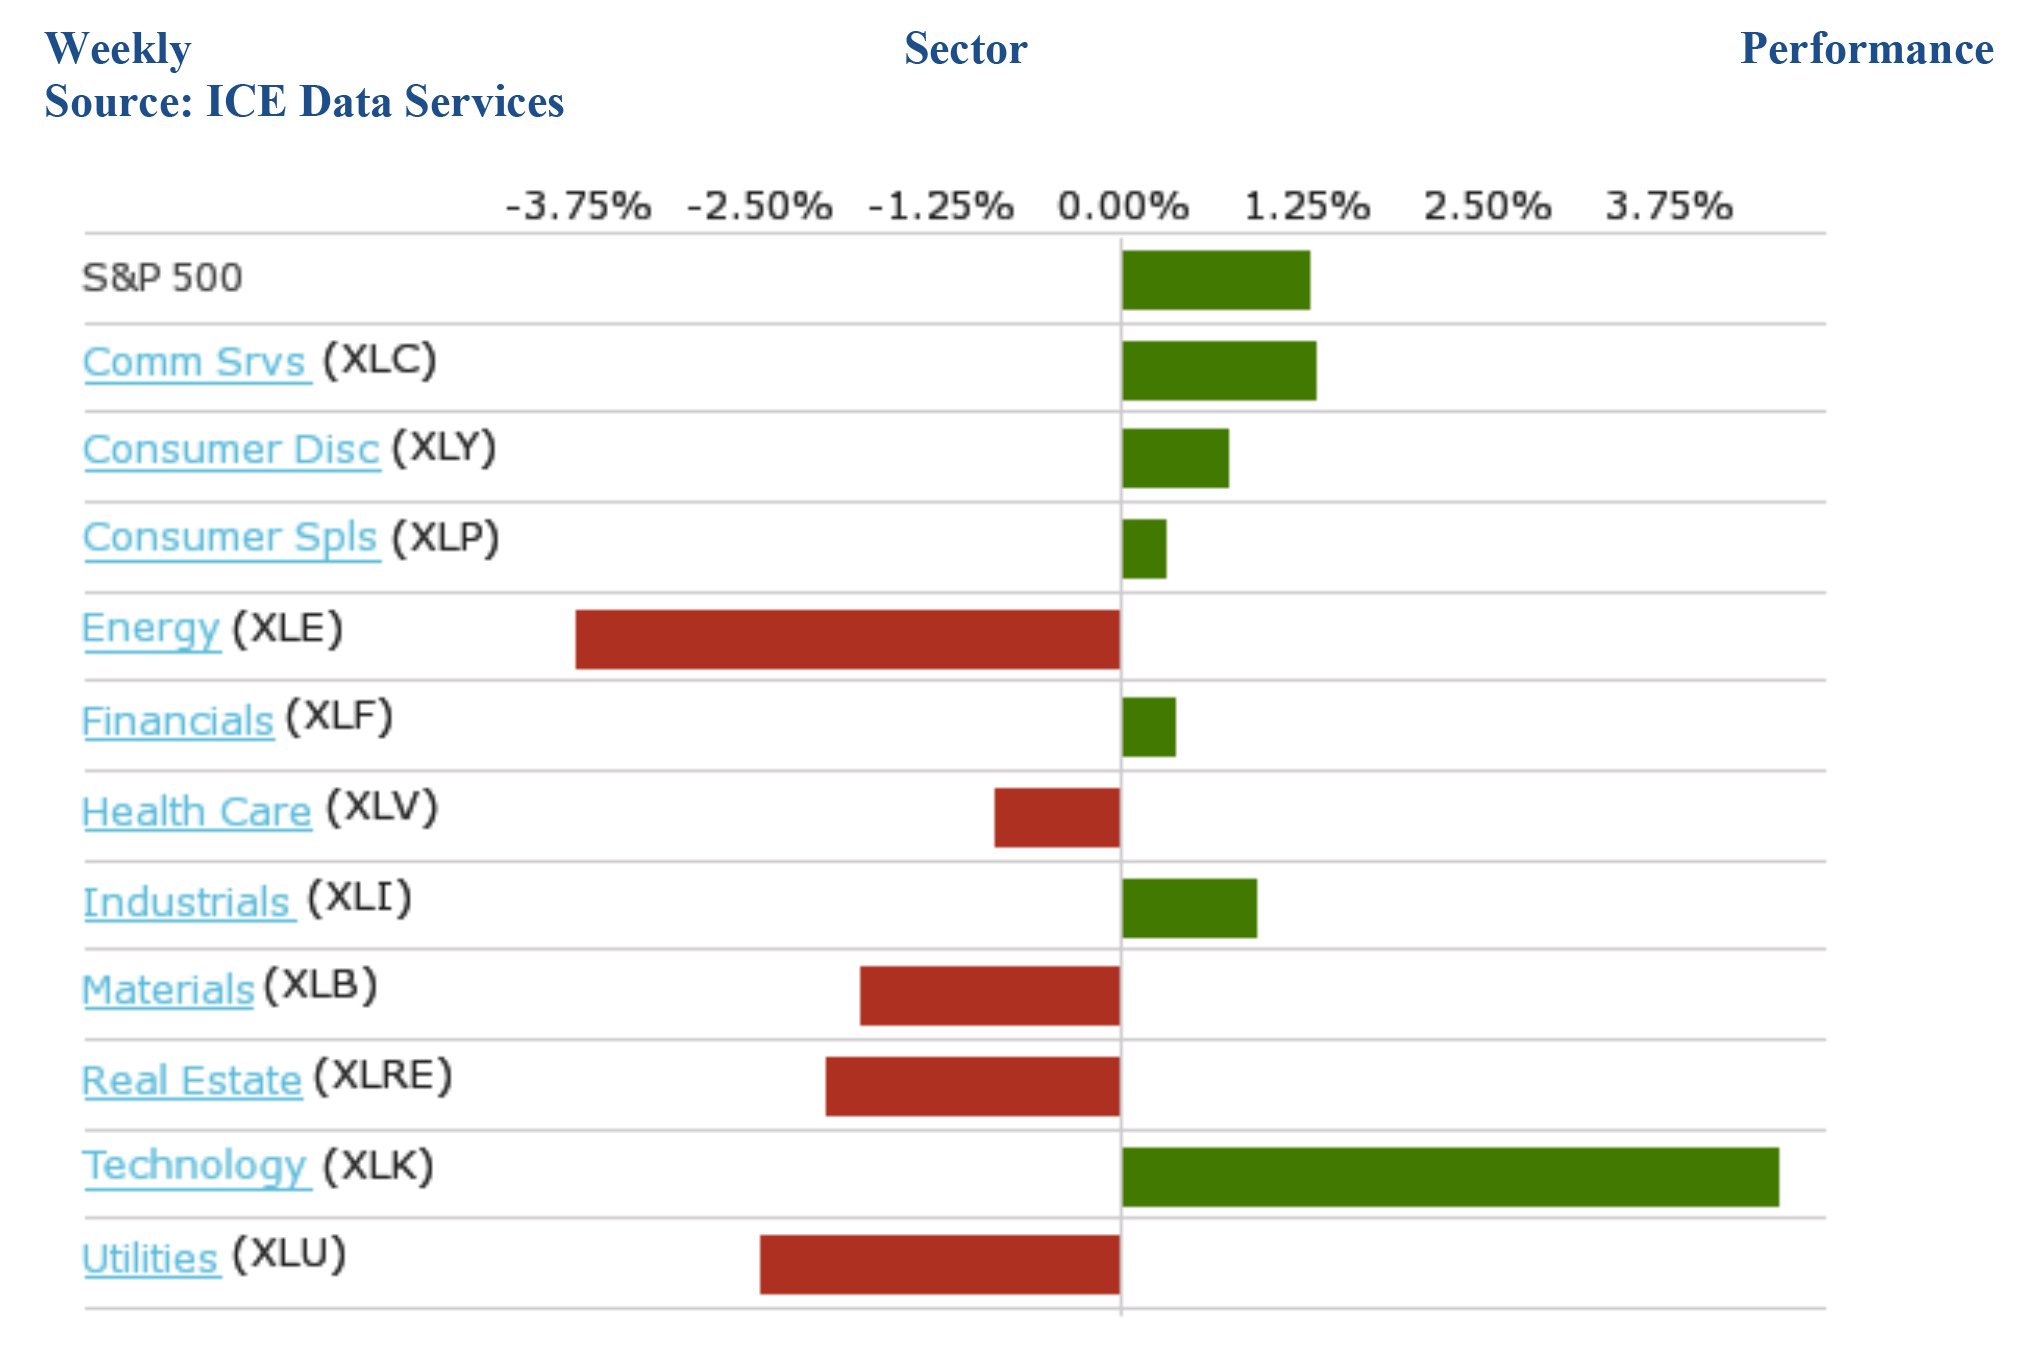
Graphs are for illustrative and discussion purposes only. Please read important disclosures at the end of this commentary.
In terms of investing in the world outside of big cap tech stocks, it takes intense stock picking to buck what is a very challenging investing landscape for small caps. For instance, the Russell 2000 tried to make a stab at breaking its primary downtrend, but failed. Maybe this next retest will provide the proverbial double-bottom, higher-low technical formation that chartists get all excited about.
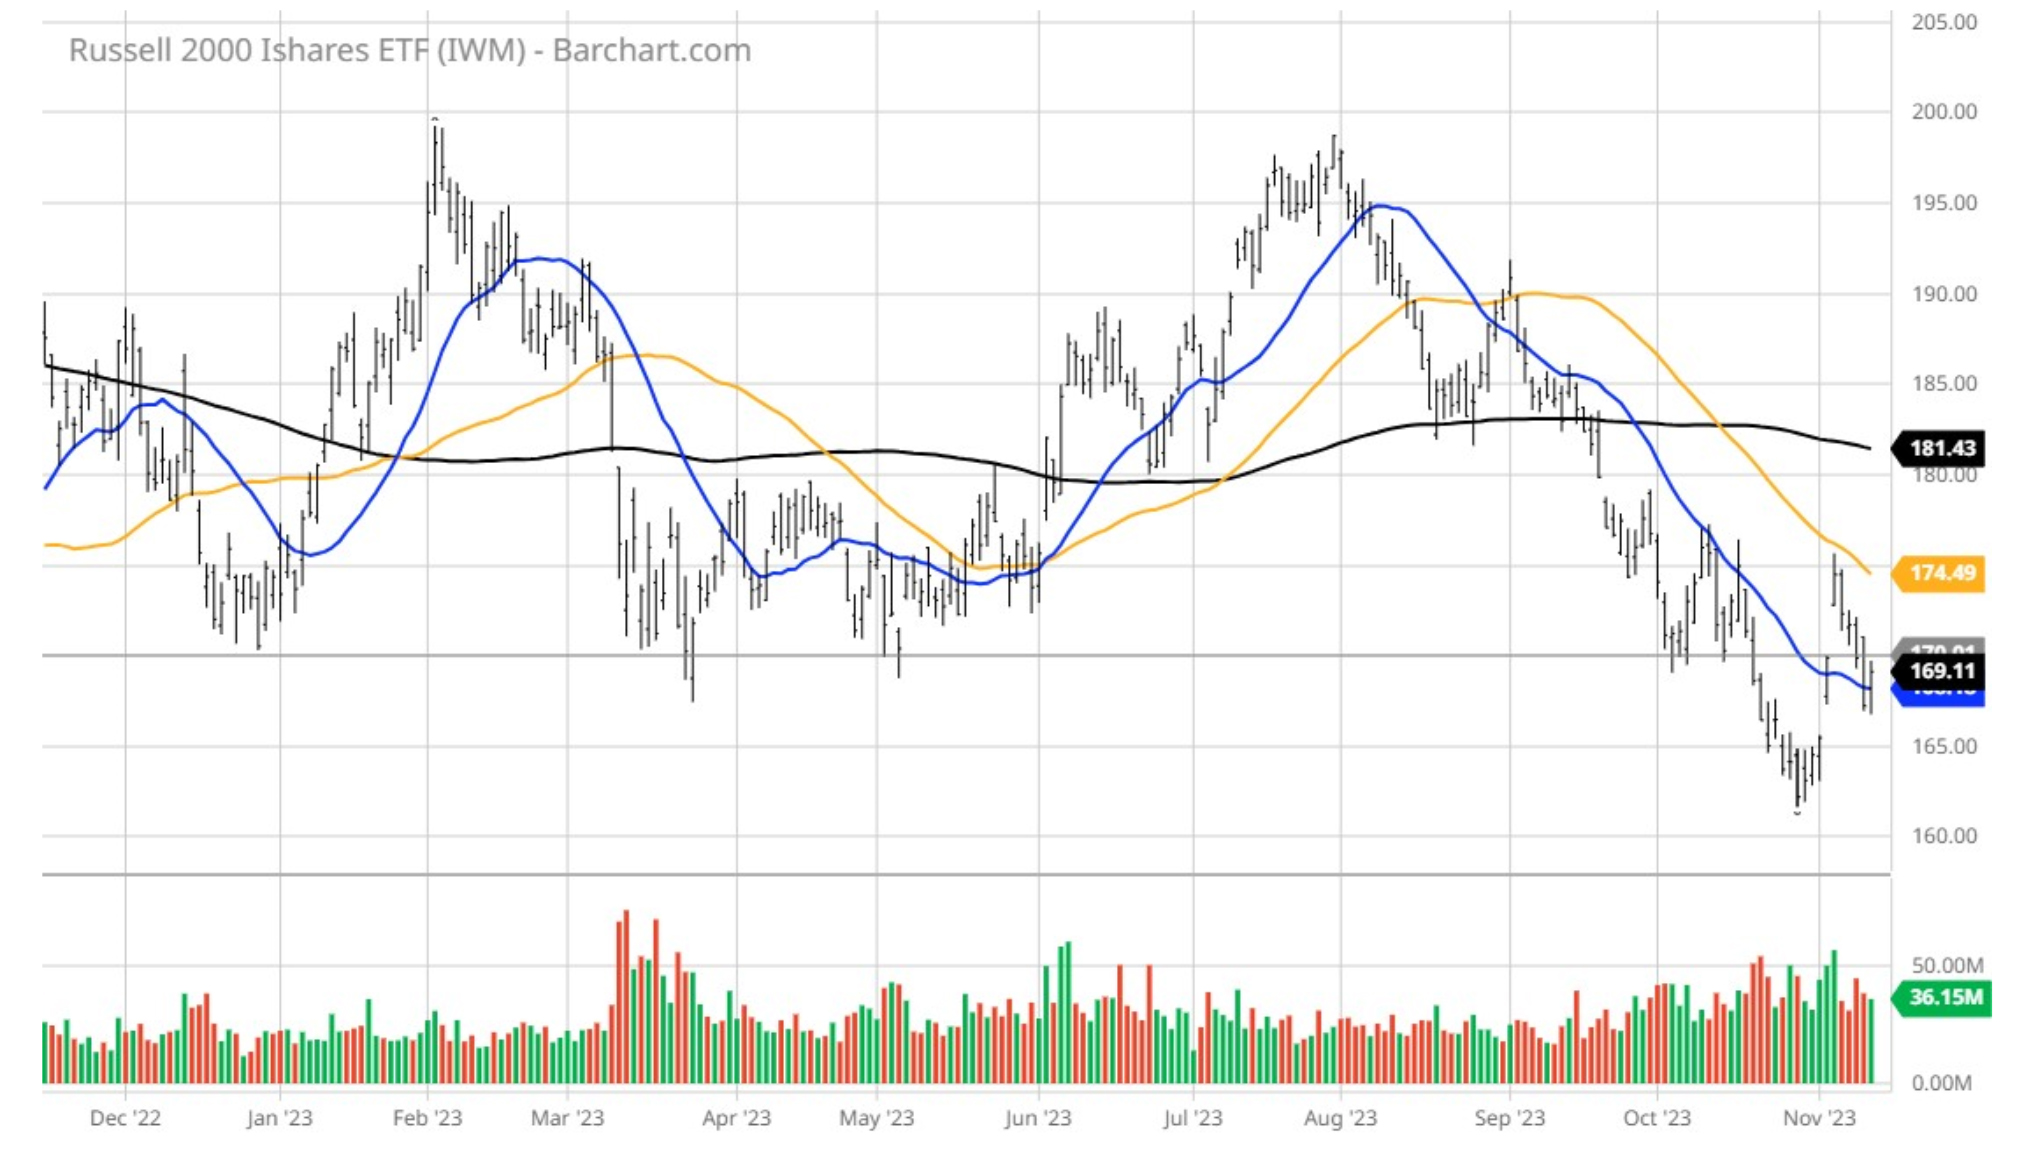
Graphs are for illustrative and discussion purposes only. Please read important disclosures at the end of this commentary.
Investors are in a super top-heavy market, where dips in tech will very likely continue to be bought into. With the China summit coming, the Israel-Hamas war ongoing, the November 17 deadline for another Congressional continuing resolution, and the data pointing to a consumer dialing back consumption, be thankful there is a winning sector that is the biggest, the fastest growing, the most liquid, and the most trusted to pad portfolio gains in an otherwise chaotic world.
Navellier & Associates owns Microsoft (MSFT), in managed accounts. Bryan Perry does not own Microsoft (MSFT), personally.
All content above represents the opinion of Bryan Perry of Navellier & Associates, Inc.
Also In This Issue
A Look Ahead by Louis Navellier
Two Fed Presidents Audition for the Next Fed Chairmanship
Income Mail by Bryan Perry
The Teflon Tech Sector Is Leading a Chaotic Market
Growth Mail by Gary Alexander
Soaring Deficits – Who Cares? (Congress Doesn’t)
Global Mail by Ivan Martchev
So far, the Stock Market Bottom for 2023 Still Holds
Sector Spotlight by Jason Bodner
Can The Best Trading Systems Be Replaced by… Pigeons?
View Full Archive
Read Past Issues Here

Bryan Perry
SENIOR DIRECTOR
Bryan Perry is a Senior Director with Navellier Private Client Group, advising and facilitating high net worth investors in the pursuit of their financial goals.
Bryan’s financial services career spanning the past three decades includes over 20 years of wealth management experience with Wall Street firms that include Bear Stearns, Lehman Brothers and Paine Webber, working with both retail and institutional clients. Bryan earned a B.A. in Political Science from Virginia Polytechnic Institute & State University and currently holds a Series 65 license. All content of “Income Mail” represents the opinion of Bryan Perry
Important Disclosures:
Although information in these reports has been obtained from and is based upon sources that Navellier believes to be reliable, Navellier does not guarantee its accuracy and it may be incomplete or condensed. All opinions and estimates constitute Navellier’s judgment as of the date the report was created and are subject to change without notice. These reports are for informational purposes only and are not a solicitation for the purchase or sale of a security. Any decision to purchase securities mentioned in these reports must take into account existing public information on such securities or any registered prospectus.To the extent permitted by law, neither Navellier & Associates, Inc., nor any of its affiliates, agents, or service providers assumes any liability or responsibility nor owes any duty of care for any consequences of any person acting or refraining to act in reliance on the information contained in this communication or for any decision based on it.
Past performance is no indication of future results. Investment in securities involves significant risk and has the potential for partial or complete loss of funds invested. It should not be assumed that any securities recommendations made by Navellier. in the future will be profitable or equal the performance of securities made in this report. Dividend payments are not guaranteed. The amount of a dividend payment, if any, can vary over time and issuers may reduce dividends paid on securities in the event of a recession or adverse event affecting a specific industry or issuer.
None of the stock information, data, and company information presented herein constitutes a recommendation by Navellier or a solicitation to buy or sell any securities. Any specific securities identified and described do not represent all of the securities purchased, sold, or recommended for advisory clients. The holdings identified do not represent all of the securities purchased, sold, or recommended for advisory clients and the reader should not assume that investments in the securities identified and discussed were or will be profitable.
Information presented is general information that does not take into account your individual circumstances, financial situation, or needs, nor does it present a personalized recommendation to you. Individual stocks presented may not be suitable for every investor. Investment in securities involves significant risk and has the potential for partial or complete loss of funds invested. Investment in fixed income securities has the potential for the investment return and principal value of an investment to fluctuate so that an investor’s holdings, when redeemed, may be worth less than their original cost.
One cannot invest directly in an index. Index is unmanaged and index performance does not reflect deduction of fees, expenses, or taxes. Presentation of Index data does not reflect a belief by Navellier that any stock index constitutes an investment alternative to any Navellier equity strategy or is necessarily comparable to such strategies. Among the most important differences between the Indices and Navellier strategies are that the Navellier equity strategies may (1) incur material management fees, (2) concentrate its investments in relatively few stocks, industries, or sectors, (3) have significantly greater trading activity and related costs, and (4) be significantly more or less volatile than the Indices.
ETF Risk: We may invest in exchange traded funds (“ETFs”) and some of our investment strategies are generally fully invested in ETFs. Like traditional mutual funds, ETFs charge asset-based fees, but they generally do not charge initial sales charges or redemption fees and investors typically pay only customary brokerage fees to buy and sell ETF shares. The fees and costs charged by ETFs held in client accounts will not be deducted from the compensation the client pays Navellier. ETF prices can fluctuate up or down, and a client account could lose money investing in an ETF if the prices of the securities owned by the ETF go down. ETFs are subject to additional risks:
- ETF shares may trade above or below their net asset value;
- An active trading market for an ETF’s shares may not develop or be maintained;
- The value of an ETF may be more volatile than the underlying portfolio of securities the ETF is designed to track;
- The cost of owning shares of the ETF may exceed those a client would incur by directly investing in the underlying securities; and
- Trading of an ETF’s shares may be halted if the listing exchange’s officials deem it appropriate, the shares are delisted from the exchange, or the activation of market-wide “circuit breakers” (which are tied to large decreases in stock prices) halts stock trading generally.
Grader Disclosures: Investment in equity strategies involves substantial risk and has the potential for partial or complete loss of funds invested. The sample portfolio and any accompanying charts are for informational purposes only and are not to be construed as a solicitation to buy or sell any financial instrument and should not be relied upon as the sole factor in an investment making decision. As a matter of normal and important disclosures to you, as a potential investor, please consider the following: The performance presented is not based on any actual securities trading, portfolio, or accounts, and the reported performance of the A, B, C, D, and F portfolios (collectively the “model portfolios”) should be considered mere “paper” or pro forma performance results based on Navellier’s research.
Investors evaluating any of Navellier & Associates, Inc.’s, (or its affiliates’) Investment Products must not use any information presented here, including the performance figures of the model portfolios, in their evaluation of any Navellier Investment Products. Navellier Investment Products include the firm’s mutual funds and managed accounts. The model portfolios, charts, and other information presented do not represent actual funded trades and are not actual funded portfolios. There are material differences between Navellier Investment Products’ portfolios and the model portfolios, research, and performance figures presented here. The model portfolios and the research results (1) may contain stocks or ETFs that are illiquid and difficult to trade; (2) may contain stock or ETF holdings materially different from actual funded Navellier Investment Product portfolios; (3) include the reinvestment of all dividends and other earnings, estimated trading costs, commissions, or management fees; and, (4) may not reflect prices obtained in an actual funded Navellier Investment Product portfolio. For these and other reasons, the reported performances of model portfolios do not reflect the performance results of Navellier’s actually funded and traded Investment Products. In most cases, Navellier’s Investment Products have materially lower performance results than the performances of the model portfolios presented.
This report contains statements that are, or may be considered to be, forward-looking statements. All statements that are not historical facts, including statements about our beliefs or expectations, are “forward-looking statements” within the meaning of The U.S. Private Securities Litigation Reform Act of 1995. These statements may be identified by such forward-looking terminology as “expect,” “estimate,” “plan,” “intend,” “believe,” “anticipate,” “may,” “will,” “should,” “could,” “continue,” “project,” or similar statements or variations of such terms. Our forward-looking statements are based on a series of expectations, assumptions, and projections, are not guarantees of future results or performance, and involve substantial risks and uncertainty as described in Form ADV Part 2A of our filing with the Securities and Exchange Commission (SEC), which is available at www.adviserinfo.sec.gov or by requesting a copy by emailing info@navellier.com. All of our forward-looking statements are as of the date of this report only. We can give no assurance that such expectations or forward-looking statements will prove to be correct. Actual results may differ materially. You are urged to carefully consider all such factors.
FEDERAL TAX ADVICE DISCLAIMER: As required by U.S. Treasury Regulations, you are informed that, to the extent this presentation includes any federal tax advice, the presentation is not written by Navellier to be used, and cannot be used, for the purpose of avoiding federal tax penalties. Navellier does not advise on any income tax requirements or issues. Use of any information presented by Navellier is for general information only and does not represent tax advice either express or implied. You are encouraged to seek professional tax advice for income tax questions and assistance.
IMPORTANT NEWSLETTER DISCLOSURE:The hypothetical performance results for investment newsletters that are authored or edited by Louis Navellier, including Louis Navellier’s Growth Investor, Louis Navellier’s Breakthrough Stocks, Louis Navellier’s Accelerated Profits, and Louis Navellier’s Platinum Club, are not based on any actual securities trading, portfolio, or accounts, and the newsletters’ reported hypothetical performances should be considered mere “paper” or proforma hypothetical performance results and are not actual performance of real world trades. Navellier & Associates, Inc. does not have any relation to or affiliation with the owner of these newsletters. There are material differences between Navellier Investment Products’ portfolios and the InvestorPlace Media, LLC newsletter portfolios authored by Louis Navellier. The InvestorPlace Media, LLC newsletters contain hypothetical performance that do not include transaction costs, advisory fees, or other fees a client might incur if actual investments and trades were being made by an investor. As a result, newsletter performance should not be used to evaluate Navellier Investment services which are separate and different from the newsletters. The owner of the newsletters is InvestorPlace Media, LLC and any questions concerning the newsletters, including any newsletter advertising or hypothetical Newsletter performance claims, (which are calculated solely by Investor Place Media and not Navellier) should be referred to InvestorPlace Media, LLC at (800) 718-8289.
Please note that Navellier & Associates and the Navellier Private Client Group are managed completely independent of the newsletters owned and published by InvestorPlace Media, LLC and written and edited by Louis Navellier, and investment performance of the newsletters should in no way be considered indicative of potential future investment performance for any Navellier & Associates separately managed account portfolio. Potential investors should consult with their financial advisor before investing in any Navellier Investment Product.
Navellier claims compliance with Global Investment Performance Standards (GIPS). To receive a complete list and descriptions of Navellier’s composites and/or a presentation that adheres to the GIPS standards, please contact Navellier or click here. It should not be assumed that any securities recommendations made by Navellier & Associates, Inc. in the future will be profitable or equal the performance of securities made in this report.
FactSet Disclosure: Navellier does not independently calculate the statistical information included in the attached report. The calculation and the information are provided by FactSet, a company not related to Navellier. Although information contained in the report has been obtained from FactSet and is based on sources Navellier believes to be reliable, Navellier does not guarantee its accuracy, and it may be incomplete or condensed. The report and the related FactSet sourced information are provided on an “as is” basis. The user assumes the entire risk of any use made of this information. Investors should consider the report as only a single factor in making their investment decision. The report is for informational purposes only and is not intended as an offer or solicitation for the purchase or sale of a security. FactSet sourced information is the exclusive property of FactSet. Without prior written permission of FactSet, this information may not be reproduced, disseminated or used to create any financial products. All indices are unmanaged and performance of the indices include reinvestment of dividends and interest income, unless otherwise noted, are not illustrative of any particular investment and an investment cannot be made in any index. Past performance is no guarantee of future results.