by Gary Alexander
November 14, 2023
“Let it rain and thunder, let a million firms go under!
I am not concerned with stocks and bonds that I’ve been burned with.
Who cares what banks fail in Yonkers…
As long as you’ve got a kiss that conquers!”
–George & Ira Gershwin, in “Who Cares?” (1931)
Over two-thirds (70%) of Americans support a bipartisan attack on the national debt, but maybe only 10 of 535 Congressmen and Senators (2%), do. The other 98% are more concerned with bringing pork home.
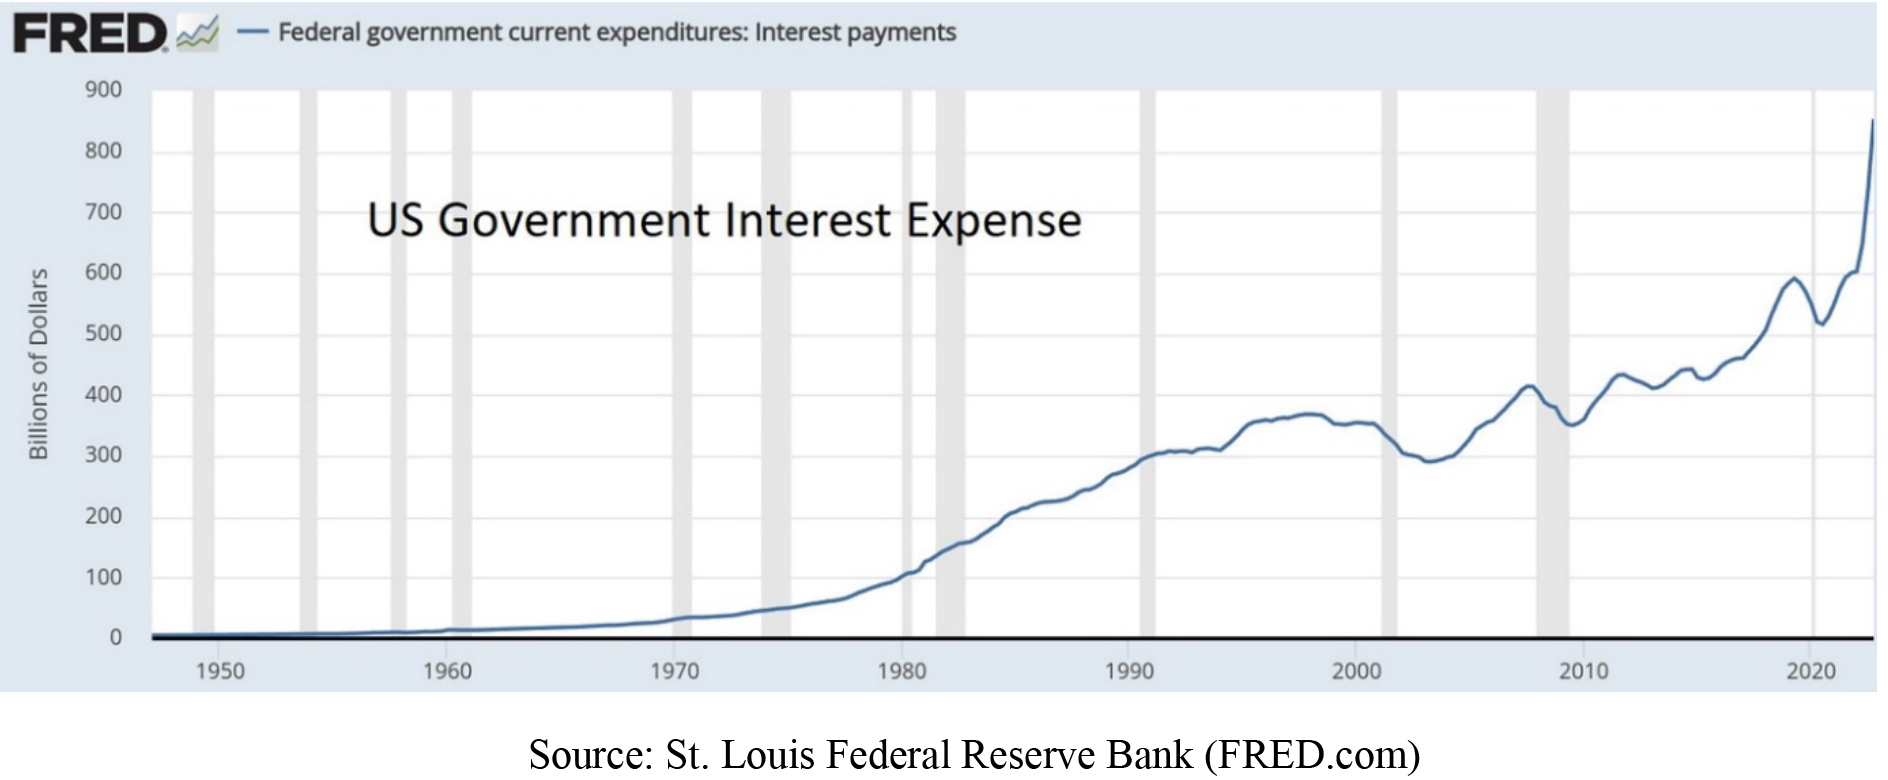
In the past year, the real federal budget deficit has more than doubled, from $933 billion to $2 trillion, according to a progressive Democrat, Ben Ritz, director of the Progressive Policy Institute’s Center for Funding America’s Future. His bias may be different than mine. He wants more funding for progressive programs, but he says (in The Wall Street Journal, “Why Democrats Should Care About Debt,” November 7, 2023), “debt service costs crowd out progressive priorities. Annual interest payments are already at their highest level as a percentage of GDP since the 1990s. By 2028, the government is projected to spend more than $1 trillion on interest payments each year – more than it spends on Medicaid or national defense.”
This brings me back to the 49th New Orleans Investment Conference, held November 1-4, where the conference director of the last 25 years, Brien Lundin, took time out from his many administrative duties to change his opening talk from a pre-planned survey, “Metals and Miners: A Generational Opportunity,” arguably more profitable for his attendees, exhibitors, and his company, to something more urgent, the soaring national debt, given a new title of “Strange Bedfellows,” taken from Shakespeare’s “Tempest.”

The above line was spoken by Trinculo, a jester, a man shipwrecked in The Tempest, seeking shelter on an island beside a sleeping monster, Caliban, a deformed native whom he first takes to be some sort of strange fish. When he realizes that Caliban has arms and legs and is warm-blooded, he correctly deduces that what seemed like a fish, is an islander. The plot grows, but Brien’s point is that New Orleans folk are familiar with hurricanes creating “strange bedfellows.” During Hurricane Katrina in 2005, a similar story circulated from the southern marshes about a 30-foot wall of water ripping a man from his home, forcing him to float on a wall of wood from his home, joined by strange bedfellows, an alligator, water moccasin and nutria – a large rat. They floated around together, looking at each other until one said, “Truce?”
These ancient tales seem to be portents of today’s markets. In most markets, Brien said, we see gold running opposite to the dollar and interest rates, but in October, after Hamas invaded Israel, gold soared, and Treasury yields kept rising. Usually, they go in opposite directions, but after six decades of multi ever-easier money, markets became addicted to the last 14 years of near-zero interest rates and this built up several bubbles. In the last 18 months, the Fed shocked the world with the most rapid rate increases in history, plus promises of “higher [rates] for a longer” time. This is a problem since: (1) G20 nonfinancial debt has doubled since 2008, to $250 trillion; and (2) yields have quadrupled in short order to 4%+, yet the average coupon on that debt is only up 50 basis points, so far. When debt resets catch up, annual interest costs will soar by $8 trillion, equal to the combined GDPs of Germany and Japan. So, rates need to fall!
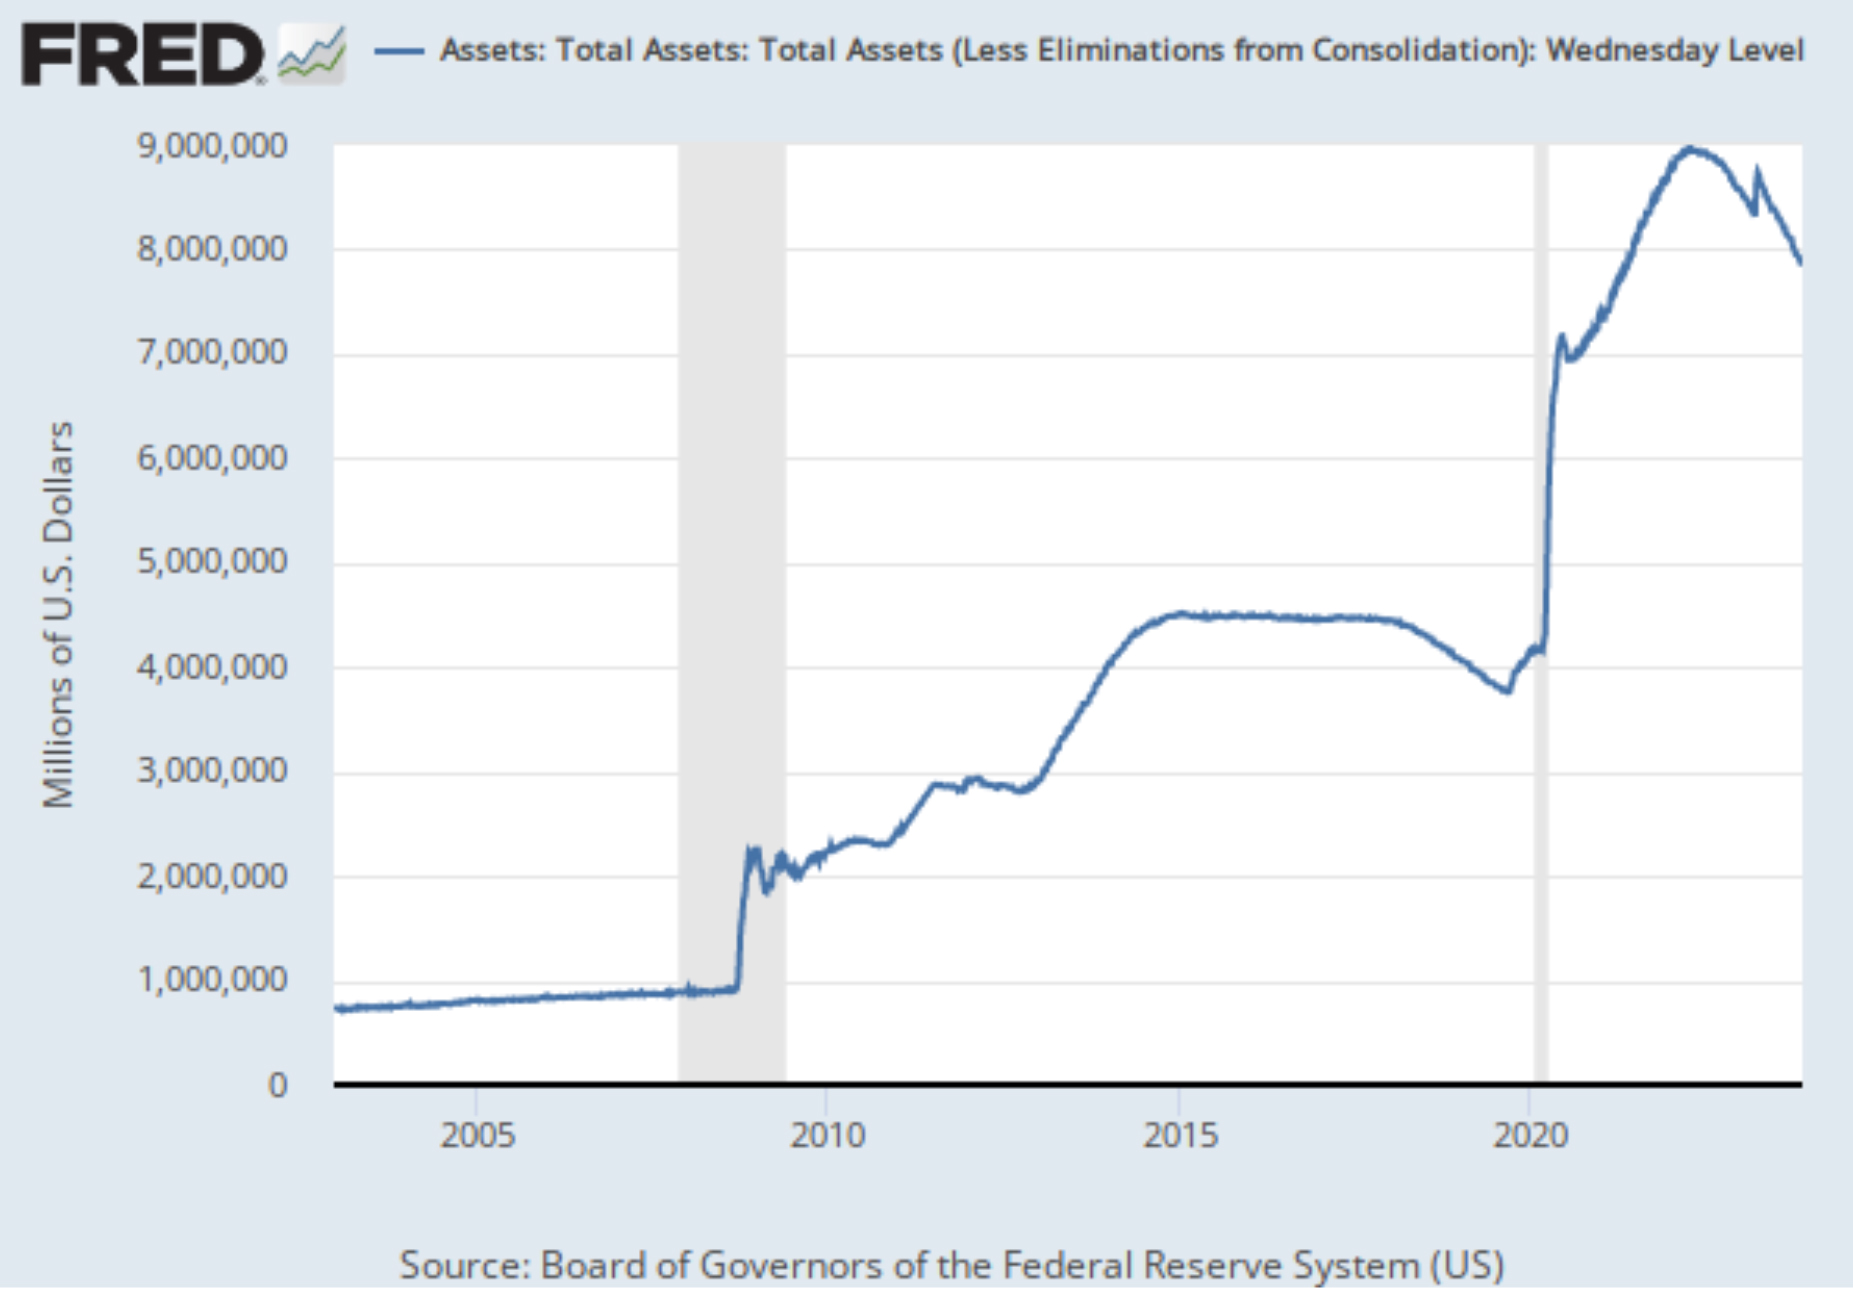
The Fed’s policies have been too extreme under Powell, he said, lurching from ultra-easy to ultra-harsh, from 5,000-year lows (rates have never been zero), to the fastest increase ever, even while in QT mode.
Powell may want to become a new Paul Volcker – a successful inflation fighter – but he doesn’t have the toolbox (and I might add the training or experience – the “chops”) to pull it off. Volcker was a Treasury animal for decades – he joined the Fed in 1952! – before rising to the top (and I mean top, standing 6’8”) of the Fed in 1979. Powell is a political appointee – an attorney and investment banker before his Fed gig.
Graphs are for illustrative and discussion purposes only. Please read important disclosures at the end of this commentary.
Voters Cared More About Debts in 1994 and 2010 … but Not So Much in 2022
Many 2023 speakers in New Orleans amplified on this debt story, but before I go there, let me recall the big story at the 1993 New Orleans Investment conference. That year marked the debut of “Bankruptcy 1995,” a book by Harry Figgie, which earmarked the rising deficits under George Bush, Sr., which arguably cost him the 1992 election – losing not just to Bill Clinton but to that Third Party gadfly Ross Perot and his “debt clock” lectures. Fed Chairman, Alan Greenspan, then shocked Wall Street with the first of his six rate increases in February, 1994, followed by the Mexican peso crisis and the Orange County debt default, followed by the Republican Revolution, which turned the House over to Republicans for the first time in 40 years, and by a wide margin, eventually resulting in four balanced budgets, 1998-2001.
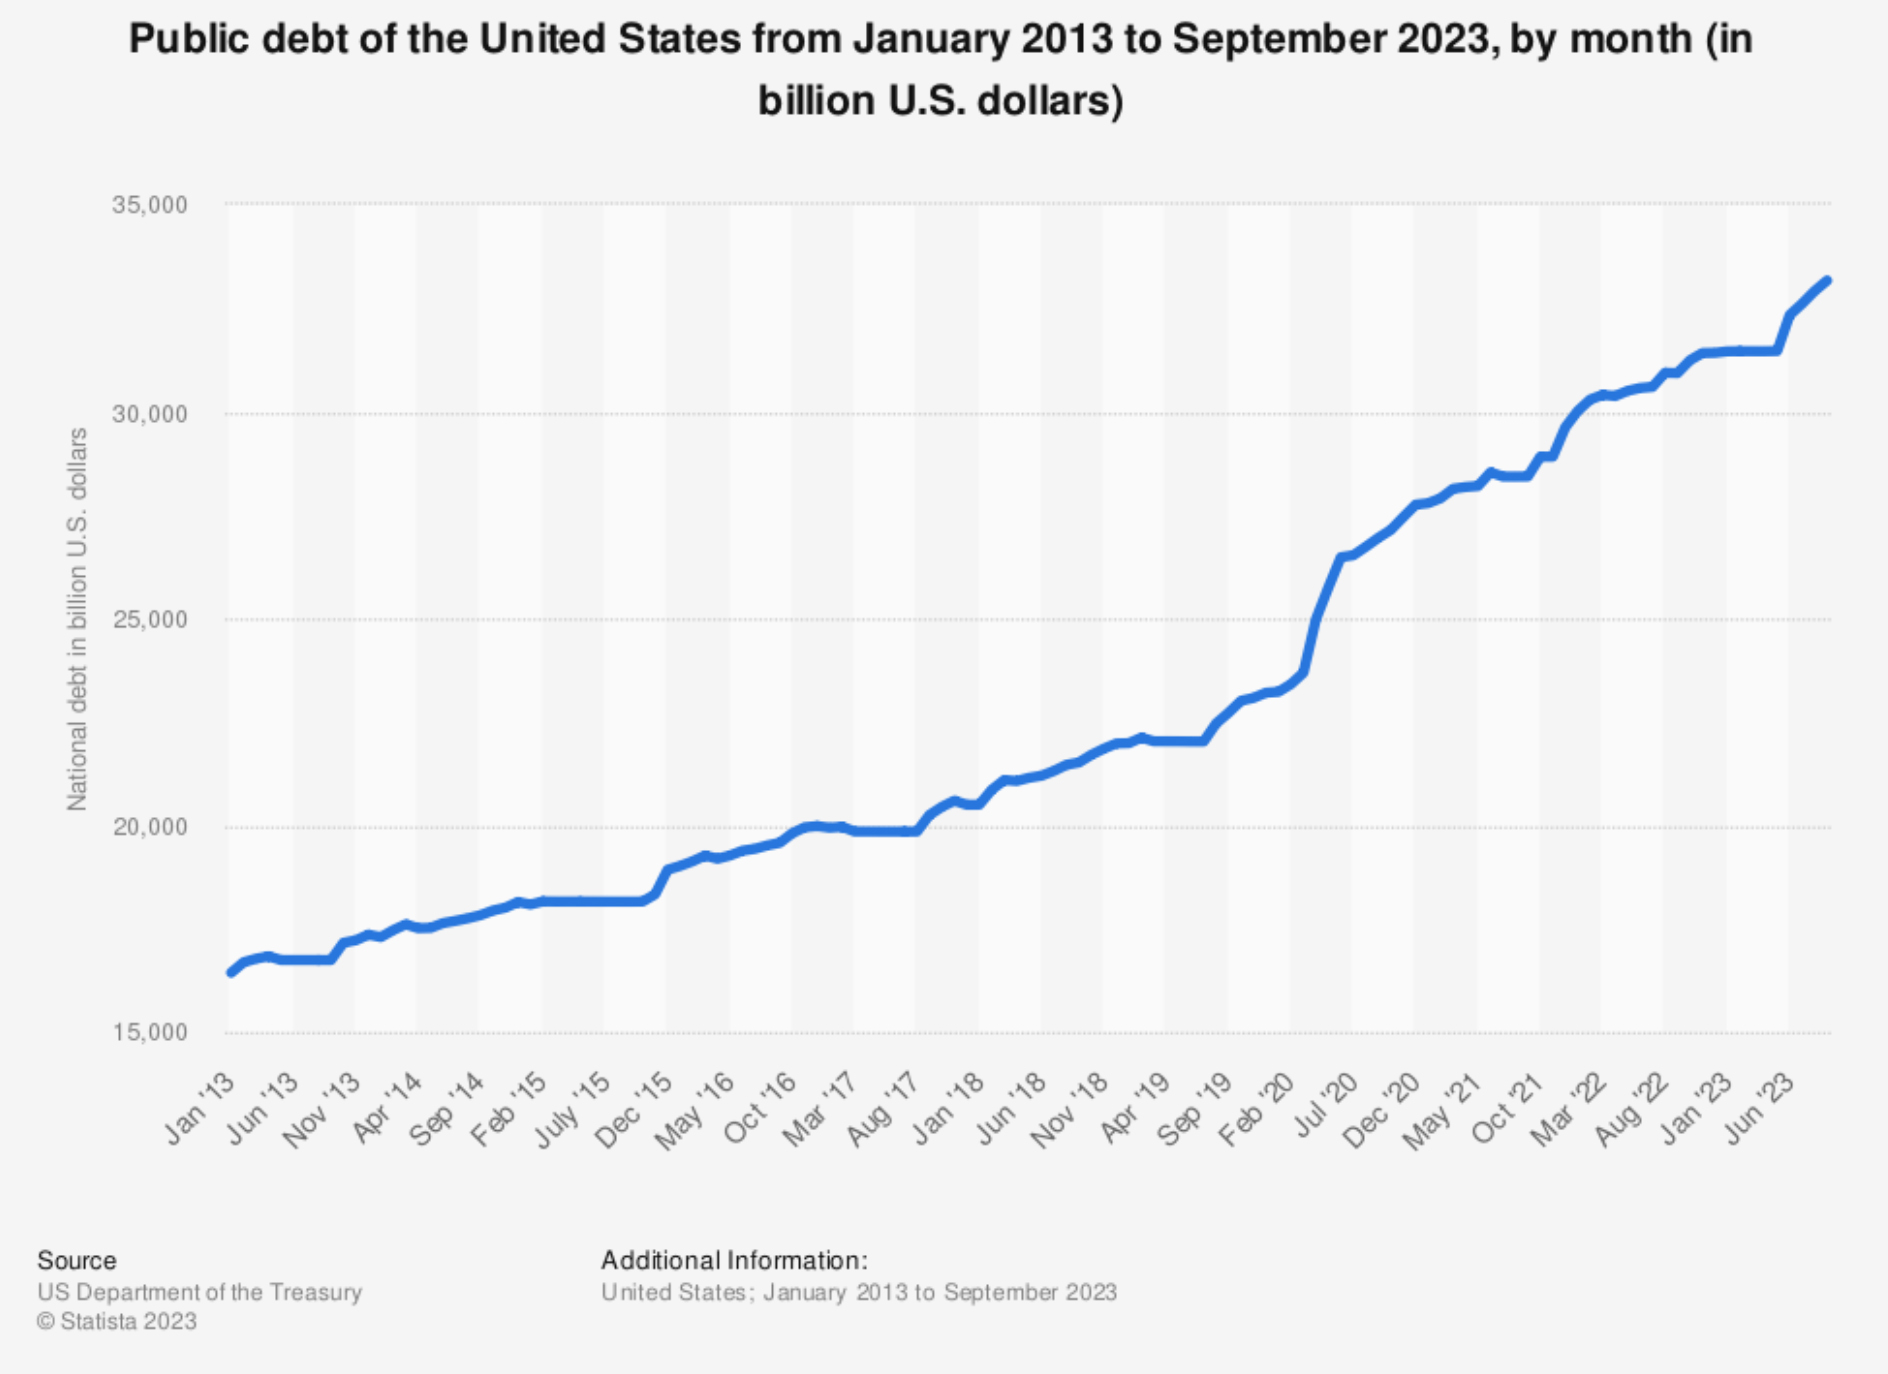
As a result, the $4 trillion public debt in 1994 was cut to $3.3 trillion in 2001, so all of that scare mongering by Perot, Figgie and our New Orleans crowd worked, for a while. It worked again in 2010 with the Tea Party, but now the debt is 10 times larger, $33 trillion, and nobody seems to care.
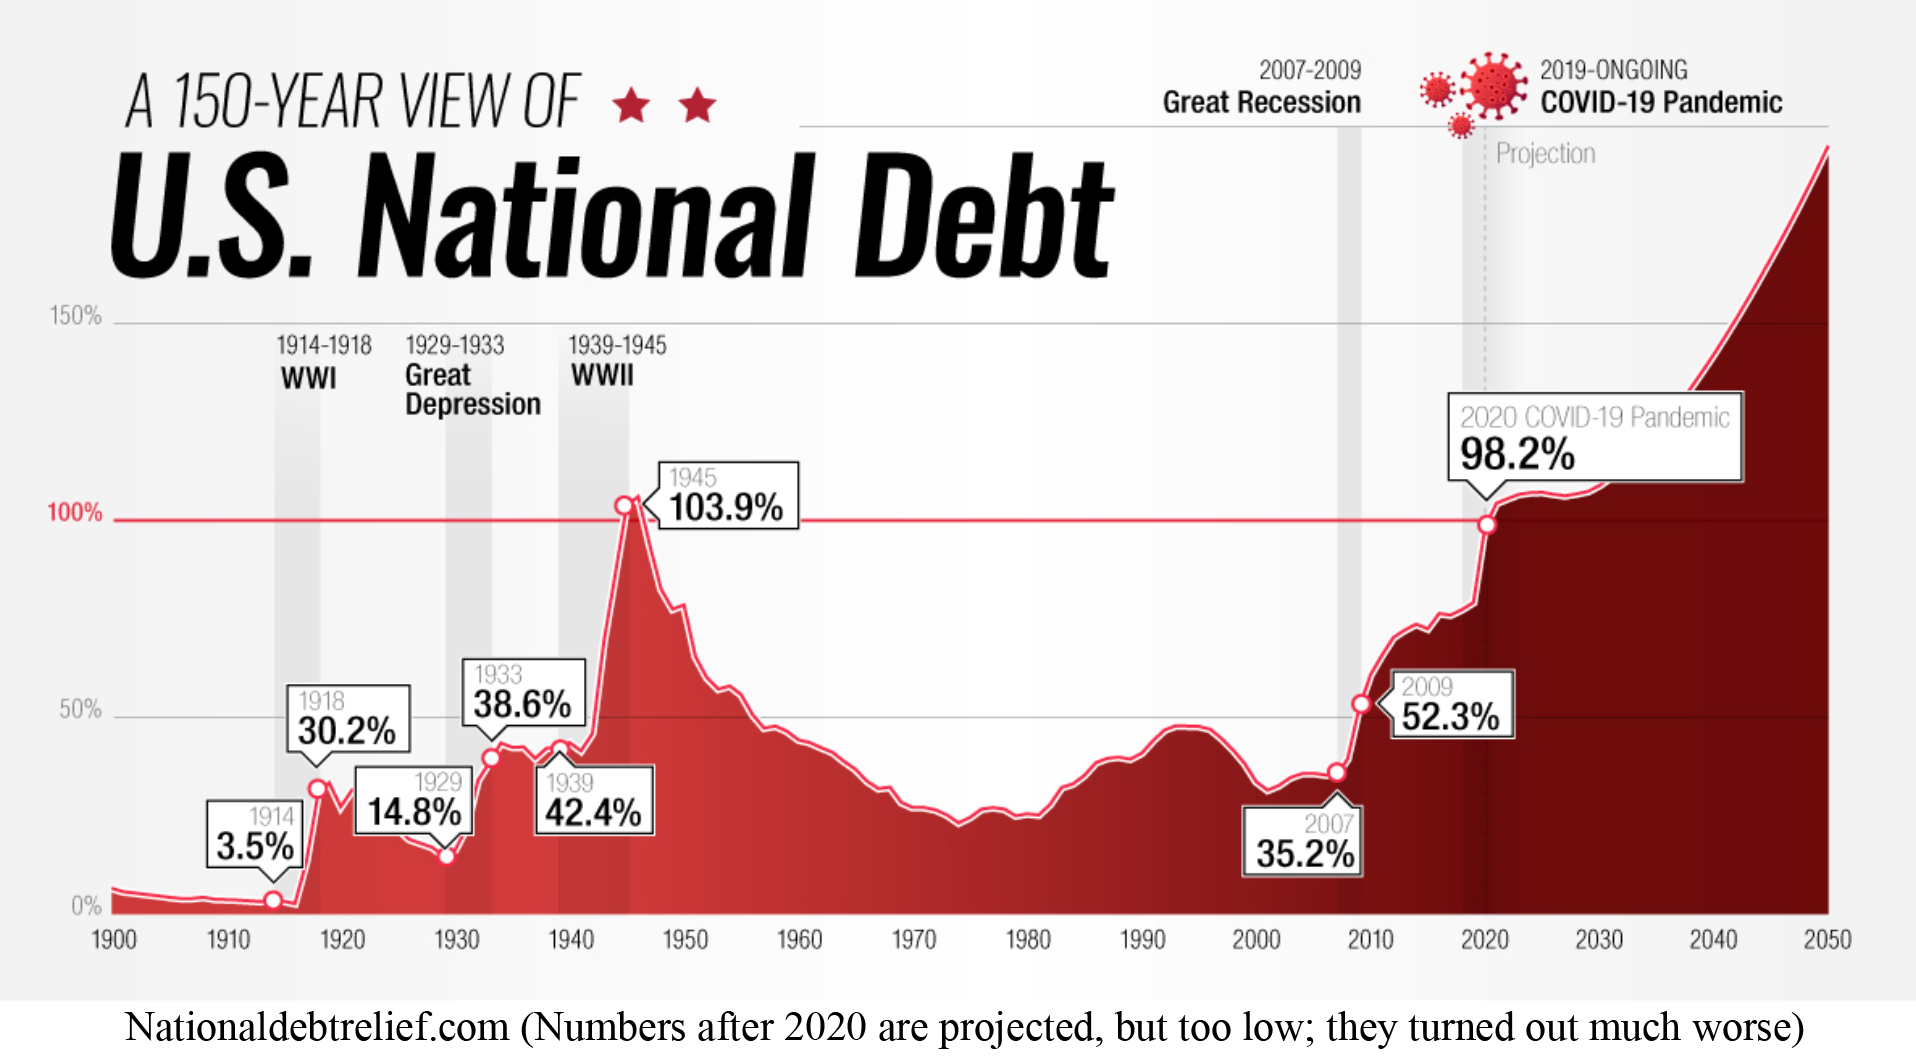
The biggest gain in national debt has come since 2008, with the debt growing from 35% of GDP in 2007 to nearly 130% now, with this year’s GDP of $26 trillion overlaid by a national debt of $33.5 trillion.
Graphs are for illustrative and discussion purposes only. Please read important disclosures at the end of this commentary.
In light of our near-130% debt to GDP ratio, Jim Iuorio mentioned a study by Hirschman Capital which showed that between 1800 and 2020, 98% of all nations whose sovereign debt exceeded 130% of their GDP defaulted on their debt, usually via sustained high inflation, but also through outright default. This study covered 53 countries, and Japan is the lone exception, so far, so we have a high bar to overcome.
In his New Orleans speech, Iuorio also said that the rapid interest rate increases in the last year felt like “economic sabotage,” since so many families and businesses were accustomed to low rates. Those who locked in low rates did so, long ago, and that put them into frozen positions. Homeowners can’t now easily move, since they can’t afford higher mortgages, and businesses are locked into long-term leases.
Summarizing some other 2023 New Orleans speakers, Adrian Day said the Treasury was clueless, if not criminal, by scheduling most U.S. debt on the short maturity end of the spectrum instead of emulating Austria and other nations by issuing 100-year bonds when rates were near zero. He said our current federal government maturities are warped to the short end. Corporate debt maturities are also scheduled to mature from 2025 to 2028. In the Economy Panel, Adrian added that it is almost irrelevant whether or not the Fed schedules one more rate increase – since 12 of 19 voting members on the “dot plot” survey predict one more rate hike. What is more troublesome is the “higher for longer” mantra that will cause pain in the economy, and rising deficits when they could have ameliorated such an outcome in advance.
Many other speakers touched on the urgency of deficit reduction. George Gammon (and others) said it’s not just a Fed problem, and not even primarily a Fed problem. It’s a government deficit funding problem. Few in Congress address the deficit, and not enough voters care, either. These debt comparisons, below, provided by Gammon, available at FRED.com, tell us that the 2022 voters didn’t care to mount a revolt.

Graphs are for illustrative and discussion purposes only. Please read important disclosures at the end of this commentary.
Graphs are for illustrative and discussion purposes only. Please read important disclosures at the end of this commentary.
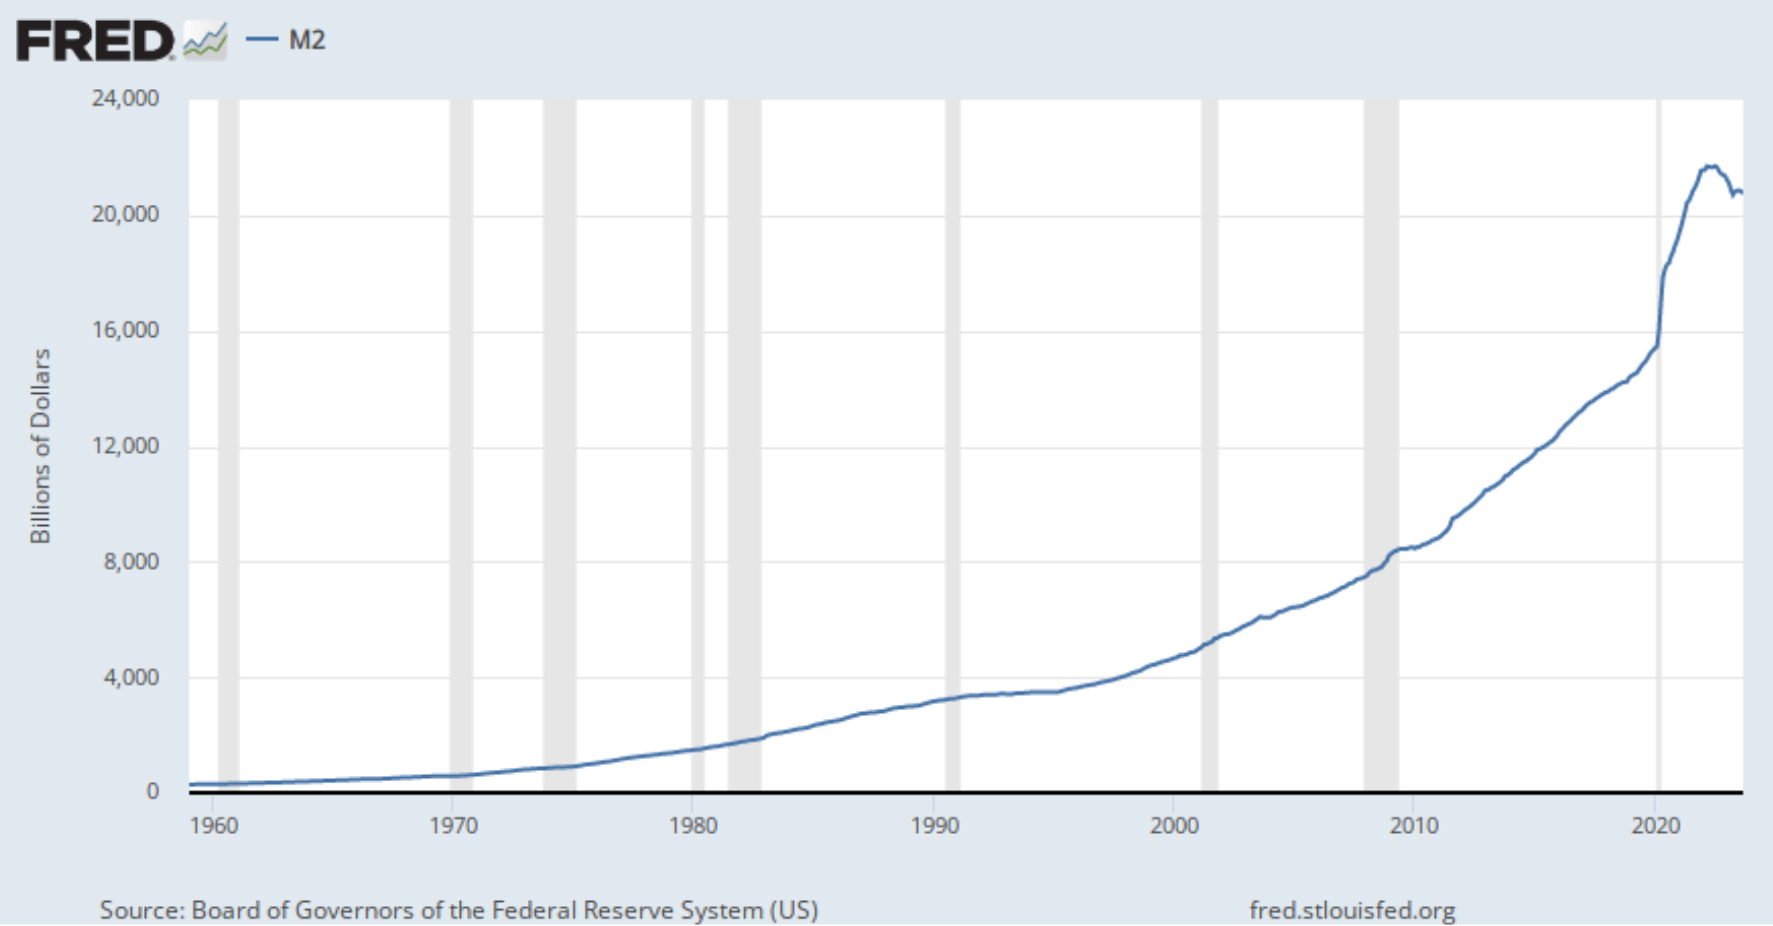
Graphs are for illustrative and discussion purposes only. Please read important disclosures at the end of this commentary.
Currently, the betting is that the Fed’s first Fed Funds rate cut will come next June, but that’s way too far in the future. With the cost of interest on the federal debt soon to top $1 trillion, they can at least lower the vigorish on our debt service by ratcheting down the cost of feeding the beast and, in the process, help heal those several sectors of U.S. economy recently crippled by higher interest rates. The Fed cannot force Congress and the White House to cut spending, but they can at least provide some alternative leadership.
P.S. I’ve been part of the last 40 New Orleans Investment conferences, as I feel they always stay focused on honest money, ethical government, and a wide range of alternative investments.
All content above represents the opinion of Gary Alexander of Navellier & Associates, Inc.
Also In This Issue
A Look Ahead by Louis Navellier
Two Fed Presidents Audition for the Next Fed Chairmanship
Income Mail by Bryan Perry
The Teflon Tech Sector Is Leading a Chaotic Market
Growth Mail by Gary Alexander
Soaring Deficits – Who Cares? (Congress Doesn’t)
Global Mail by Ivan Martchev
So far, the Stock Market Bottom for 2023 Still Holds
Sector Spotlight by Jason Bodner
Can The Best Trading Systems Be Replaced by… Pigeons?
View Full Archive
Read Past Issues Here
About The Author

Gary Alexander
SENIOR EDITOR
Gary Alexander has been Senior Writer at Navellier since 2009. He edits Navellier’s weekly Marketmail and writes a weekly Growth Mail column, in which he uses market history to support the case for growth stocks. For the previous 20 years before joining Navellier, he was Senior Executive Editor at InvestorPlace Media (formerly Phillips Publishing), where he worked with several leading investment analysts, including Louis Navellier (since 1997), helping launch Louis Navellier’s Blue Chip Growth and Global Growth newsletters.
Prior to that, Gary edited Wealth Magazine and Gold Newsletter and wrote various investment research reports for Jefferson Financial in New Orleans in the 1980s. He began his financial newsletter career with KCI Communications in 1980, where he served as consulting editor for Personal Finance newsletter while serving as general manager of KCI’s Alexandria House book division. Before that, he covered the economics beat for news magazines. All content of “Growth Mail” represents the opinion of Gary Alexander
Important Disclosures:
Although information in these reports has been obtained from and is based upon sources that Navellier believes to be reliable, Navellier does not guarantee its accuracy and it may be incomplete or condensed. All opinions and estimates constitute Navellier’s judgment as of the date the report was created and are subject to change without notice. These reports are for informational purposes only and are not a solicitation for the purchase or sale of a security. Any decision to purchase securities mentioned in these reports must take into account existing public information on such securities or any registered prospectus.To the extent permitted by law, neither Navellier & Associates, Inc., nor any of its affiliates, agents, or service providers assumes any liability or responsibility nor owes any duty of care for any consequences of any person acting or refraining to act in reliance on the information contained in this communication or for any decision based on it.
Past performance is no indication of future results. Investment in securities involves significant risk and has the potential for partial or complete loss of funds invested. It should not be assumed that any securities recommendations made by Navellier. in the future will be profitable or equal the performance of securities made in this report. Dividend payments are not guaranteed. The amount of a dividend payment, if any, can vary over time and issuers may reduce dividends paid on securities in the event of a recession or adverse event affecting a specific industry or issuer.
None of the stock information, data, and company information presented herein constitutes a recommendation by Navellier or a solicitation to buy or sell any securities. Any specific securities identified and described do not represent all of the securities purchased, sold, or recommended for advisory clients. The holdings identified do not represent all of the securities purchased, sold, or recommended for advisory clients and the reader should not assume that investments in the securities identified and discussed were or will be profitable.
Information presented is general information that does not take into account your individual circumstances, financial situation, or needs, nor does it present a personalized recommendation to you. Individual stocks presented may not be suitable for every investor. Investment in securities involves significant risk and has the potential for partial or complete loss of funds invested. Investment in fixed income securities has the potential for the investment return and principal value of an investment to fluctuate so that an investor’s holdings, when redeemed, may be worth less than their original cost.
One cannot invest directly in an index. Index is unmanaged and index performance does not reflect deduction of fees, expenses, or taxes. Presentation of Index data does not reflect a belief by Navellier that any stock index constitutes an investment alternative to any Navellier equity strategy or is necessarily comparable to such strategies. Among the most important differences between the Indices and Navellier strategies are that the Navellier equity strategies may (1) incur material management fees, (2) concentrate its investments in relatively few stocks, industries, or sectors, (3) have significantly greater trading activity and related costs, and (4) be significantly more or less volatile than the Indices.
ETF Risk: We may invest in exchange traded funds (“ETFs”) and some of our investment strategies are generally fully invested in ETFs. Like traditional mutual funds, ETFs charge asset-based fees, but they generally do not charge initial sales charges or redemption fees and investors typically pay only customary brokerage fees to buy and sell ETF shares. The fees and costs charged by ETFs held in client accounts will not be deducted from the compensation the client pays Navellier. ETF prices can fluctuate up or down, and a client account could lose money investing in an ETF if the prices of the securities owned by the ETF go down. ETFs are subject to additional risks:
- ETF shares may trade above or below their net asset value;
- An active trading market for an ETF’s shares may not develop or be maintained;
- The value of an ETF may be more volatile than the underlying portfolio of securities the ETF is designed to track;
- The cost of owning shares of the ETF may exceed those a client would incur by directly investing in the underlying securities; and
- Trading of an ETF’s shares may be halted if the listing exchange’s officials deem it appropriate, the shares are delisted from the exchange, or the activation of market-wide “circuit breakers” (which are tied to large decreases in stock prices) halts stock trading generally.
Grader Disclosures: Investment in equity strategies involves substantial risk and has the potential for partial or complete loss of funds invested. The sample portfolio and any accompanying charts are for informational purposes only and are not to be construed as a solicitation to buy or sell any financial instrument and should not be relied upon as the sole factor in an investment making decision. As a matter of normal and important disclosures to you, as a potential investor, please consider the following: The performance presented is not based on any actual securities trading, portfolio, or accounts, and the reported performance of the A, B, C, D, and F portfolios (collectively the “model portfolios”) should be considered mere “paper” or pro forma performance results based on Navellier’s research.
Investors evaluating any of Navellier & Associates, Inc.’s, (or its affiliates’) Investment Products must not use any information presented here, including the performance figures of the model portfolios, in their evaluation of any Navellier Investment Products. Navellier Investment Products include the firm’s mutual funds and managed accounts. The model portfolios, charts, and other information presented do not represent actual funded trades and are not actual funded portfolios. There are material differences between Navellier Investment Products’ portfolios and the model portfolios, research, and performance figures presented here. The model portfolios and the research results (1) may contain stocks or ETFs that are illiquid and difficult to trade; (2) may contain stock or ETF holdings materially different from actual funded Navellier Investment Product portfolios; (3) include the reinvestment of all dividends and other earnings, estimated trading costs, commissions, or management fees; and, (4) may not reflect prices obtained in an actual funded Navellier Investment Product portfolio. For these and other reasons, the reported performances of model portfolios do not reflect the performance results of Navellier’s actually funded and traded Investment Products. In most cases, Navellier’s Investment Products have materially lower performance results than the performances of the model portfolios presented.
This report contains statements that are, or may be considered to be, forward-looking statements. All statements that are not historical facts, including statements about our beliefs or expectations, are “forward-looking statements” within the meaning of The U.S. Private Securities Litigation Reform Act of 1995. These statements may be identified by such forward-looking terminology as “expect,” “estimate,” “plan,” “intend,” “believe,” “anticipate,” “may,” “will,” “should,” “could,” “continue,” “project,” or similar statements or variations of such terms. Our forward-looking statements are based on a series of expectations, assumptions, and projections, are not guarantees of future results or performance, and involve substantial risks and uncertainty as described in Form ADV Part 2A of our filing with the Securities and Exchange Commission (SEC), which is available at www.adviserinfo.sec.gov or by requesting a copy by emailing info@navellier.com. All of our forward-looking statements are as of the date of this report only. We can give no assurance that such expectations or forward-looking statements will prove to be correct. Actual results may differ materially. You are urged to carefully consider all such factors.
FEDERAL TAX ADVICE DISCLAIMER: As required by U.S. Treasury Regulations, you are informed that, to the extent this presentation includes any federal tax advice, the presentation is not written by Navellier to be used, and cannot be used, for the purpose of avoiding federal tax penalties. Navellier does not advise on any income tax requirements or issues. Use of any information presented by Navellier is for general information only and does not represent tax advice either express or implied. You are encouraged to seek professional tax advice for income tax questions and assistance.
IMPORTANT NEWSLETTER DISCLOSURE:The hypothetical performance results for investment newsletters that are authored or edited by Louis Navellier, including Louis Navellier’s Growth Investor, Louis Navellier’s Breakthrough Stocks, Louis Navellier’s Accelerated Profits, and Louis Navellier’s Platinum Club, are not based on any actual securities trading, portfolio, or accounts, and the newsletters’ reported hypothetical performances should be considered mere “paper” or proforma hypothetical performance results and are not actual performance of real world trades. Navellier & Associates, Inc. does not have any relation to or affiliation with the owner of these newsletters. There are material differences between Navellier Investment Products’ portfolios and the InvestorPlace Media, LLC newsletter portfolios authored by Louis Navellier. The InvestorPlace Media, LLC newsletters contain hypothetical performance that do not include transaction costs, advisory fees, or other fees a client might incur if actual investments and trades were being made by an investor. As a result, newsletter performance should not be used to evaluate Navellier Investment services which are separate and different from the newsletters. The owner of the newsletters is InvestorPlace Media, LLC and any questions concerning the newsletters, including any newsletter advertising or hypothetical Newsletter performance claims, (which are calculated solely by Investor Place Media and not Navellier) should be referred to InvestorPlace Media, LLC at (800) 718-8289.
Please note that Navellier & Associates and the Navellier Private Client Group are managed completely independent of the newsletters owned and published by InvestorPlace Media, LLC and written and edited by Louis Navellier, and investment performance of the newsletters should in no way be considered indicative of potential future investment performance for any Navellier & Associates separately managed account portfolio. Potential investors should consult with their financial advisor before investing in any Navellier Investment Product.
Navellier claims compliance with Global Investment Performance Standards (GIPS). To receive a complete list and descriptions of Navellier’s composites and/or a presentation that adheres to the GIPS standards, please contact Navellier or click here. It should not be assumed that any securities recommendations made by Navellier & Associates, Inc. in the future will be profitable or equal the performance of securities made in this report.
FactSet Disclosure: Navellier does not independently calculate the statistical information included in the attached report. The calculation and the information are provided by FactSet, a company not related to Navellier. Although information contained in the report has been obtained from FactSet and is based on sources Navellier believes to be reliable, Navellier does not guarantee its accuracy, and it may be incomplete or condensed. The report and the related FactSet sourced information are provided on an “as is” basis. The user assumes the entire risk of any use made of this information. Investors should consider the report as only a single factor in making their investment decision. The report is for informational purposes only and is not intended as an offer or solicitation for the purchase or sale of a security. FactSet sourced information is the exclusive property of FactSet. Without prior written permission of FactSet, this information may not be reproduced, disseminated or used to create any financial products. All indices are unmanaged and performance of the indices include reinvestment of dividends and interest income, unless otherwise noted, are not illustrative of any particular investment and an investment cannot be made in any index. Past performance is no guarantee of future results.
