By Jason Bodner
November 14, 2023
Does “AI” Really Stand for Aviary Intelligence?
We’re obsessed with AI these days. The notion that artificial intelligence can do anything as good, if not better, than we humans, has fascinating implications. The funny thing is that AI algorithms are often created by using associative learning. This is basically an extension of trial and error, the same approach used by pigeons to solve problems, as revealed in a study out of Ohio State University.
We found really strong evidence that the mechanisms guiding pigeon learning are remarkably similar to the same principles that guide modern machine learning and AI techniques…Our findings suggest that in the pigeon, nature may have found a way to make an incredibly efficient learner that has no ability to generalize or extrapolate like humans would.”
– Brandon Turner, Professor of Psychology, Ohio State University
So, if AI takes over, society might resemble flocks of what we usually consider to be dim-witted pigeons.

It just goes to show that if nothing else, human logic is flawed. We strive to find patterns to predict outcomes. The trouble is, we often assign patterns when none are there. It’s called Apophenia- the same phenomenon that led to mass acceptance of this “face” on Mars:

Now, when we stop to think of the stock market and its limitless potential of patterns and rules, it is understandable why so many investors get trapped in making decisions based on flawed logic or faulty interpretation of raw data. This is the primary reason I sought to remove all emotion from investment decision-making. It is hard enough trying to be completely objective, yet relying on a brain that sees patterns that are not really there, and then trains computers to think like pigeons… well, enough said.
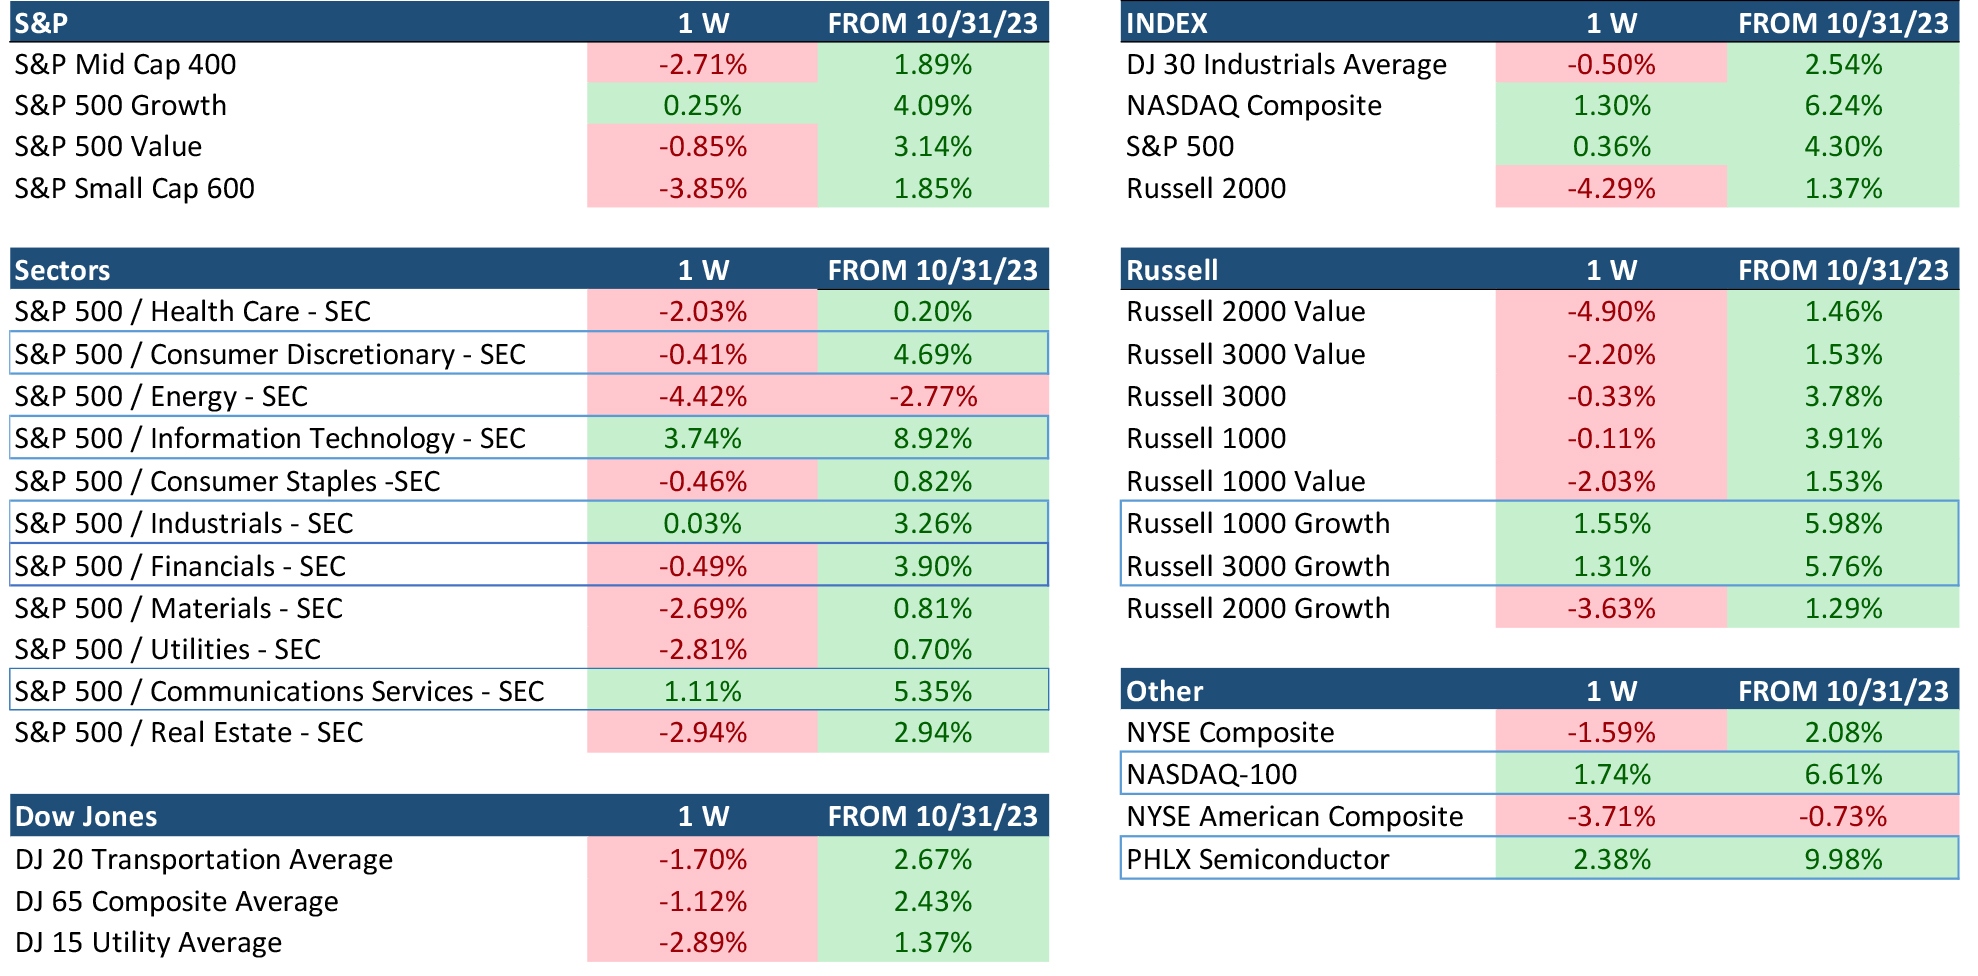
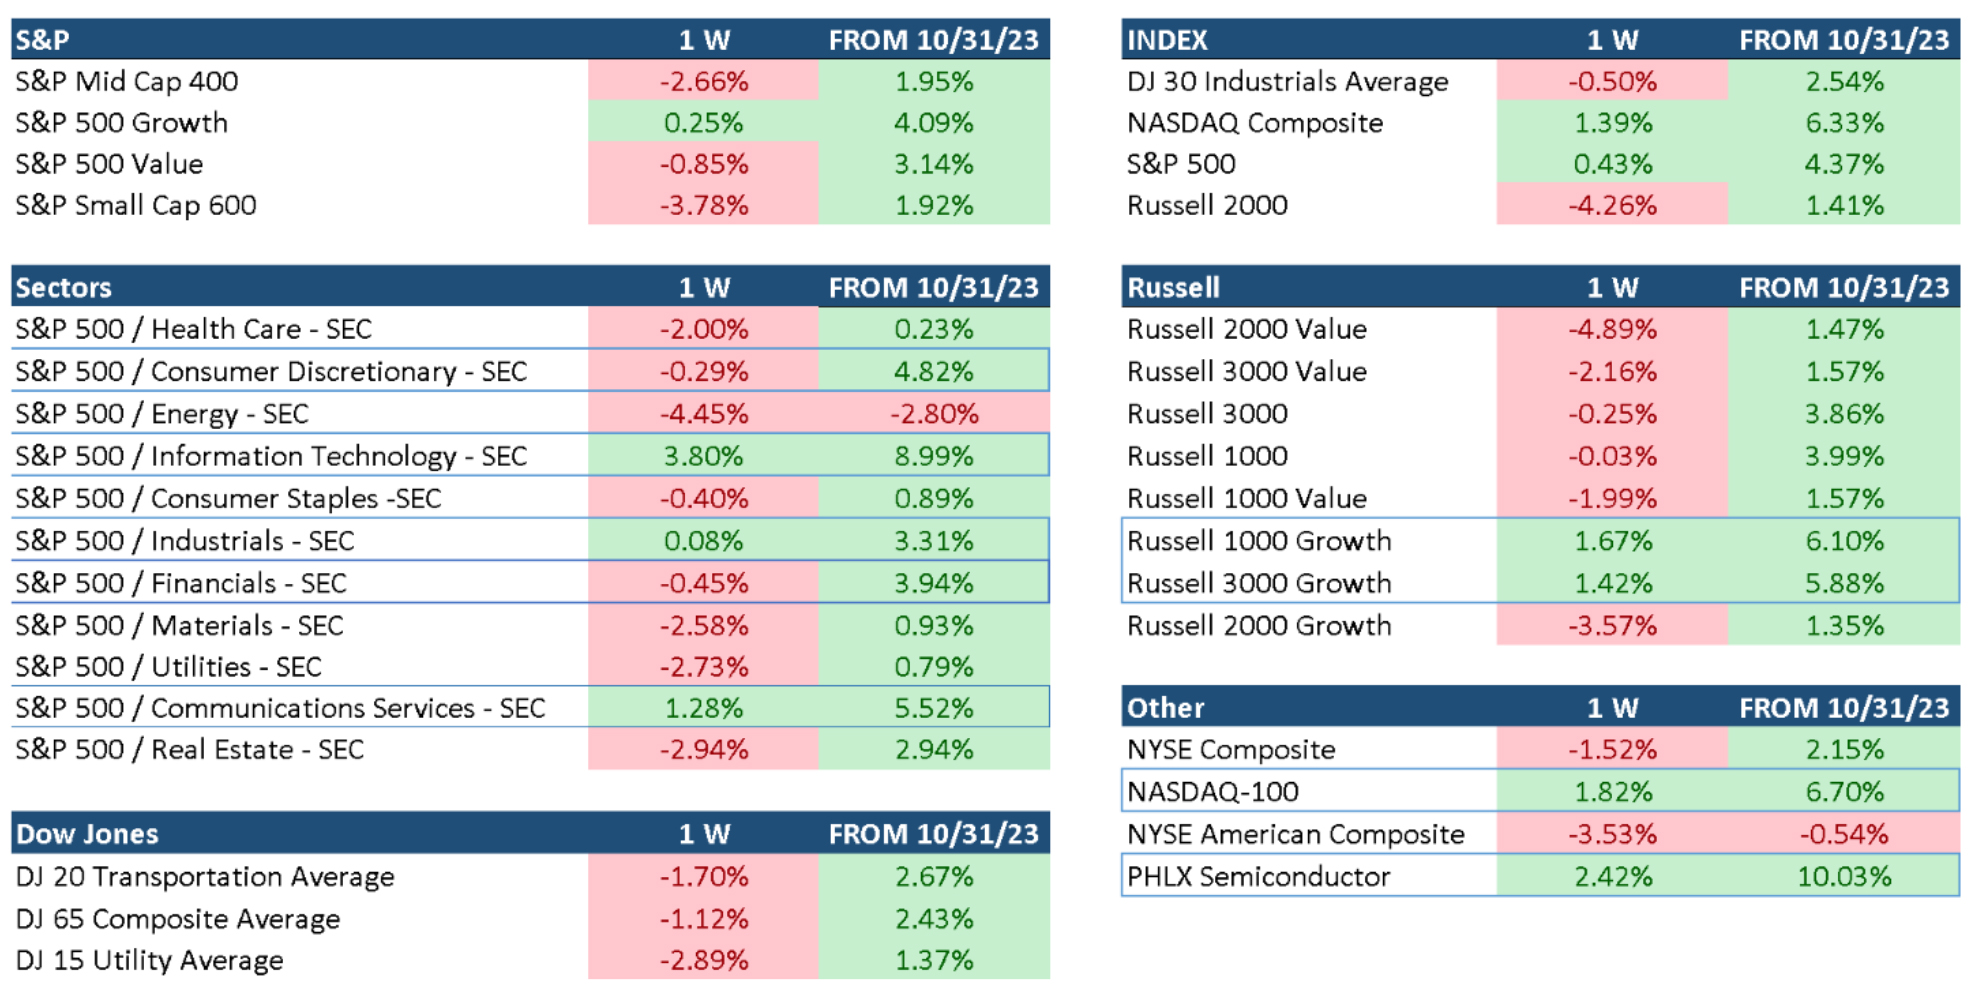
The recent market volatility has bucked historical trends dating back to 1990, namely that October through December are the strongest months of the year. October this year was a poor performer. But there’s still hope for a rockin’ good fourth quarter, since November is off to an awesome start:
Graphs are for illustrative and discussion purposes only. Please read important disclosures at the end of this commentary.
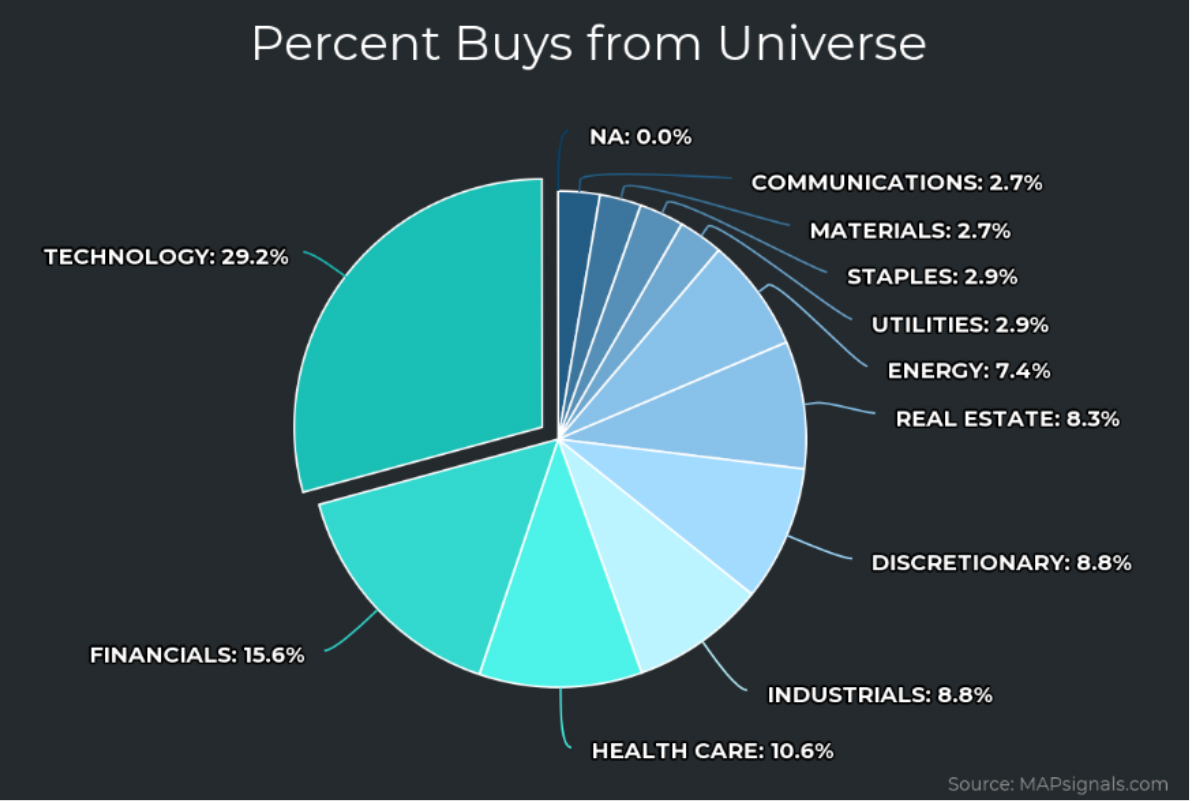
NASDAQ has shot up an astonishing 6.24% for the month of November, as of this writing. In the first table (above), I highlighted the areas that led the market higher since October’s oversold washout. Notice they are growth areas: Discretionary, Tech, Industrials, and Communications. You can see semiconductors are up 10% in the first days of November. The Russell 1000 growth indexes are also up, as is the S&P 500 Growth index. If we look at the breakdown of new buying, it’s plain to see the money flowing into Tech:
Graphs are for illustrative and discussion purposes only. Please read important disclosures at the end of this commentary.
Graphs are for illustrative and discussion purposes only. Please read important disclosures at the end of this commentary.
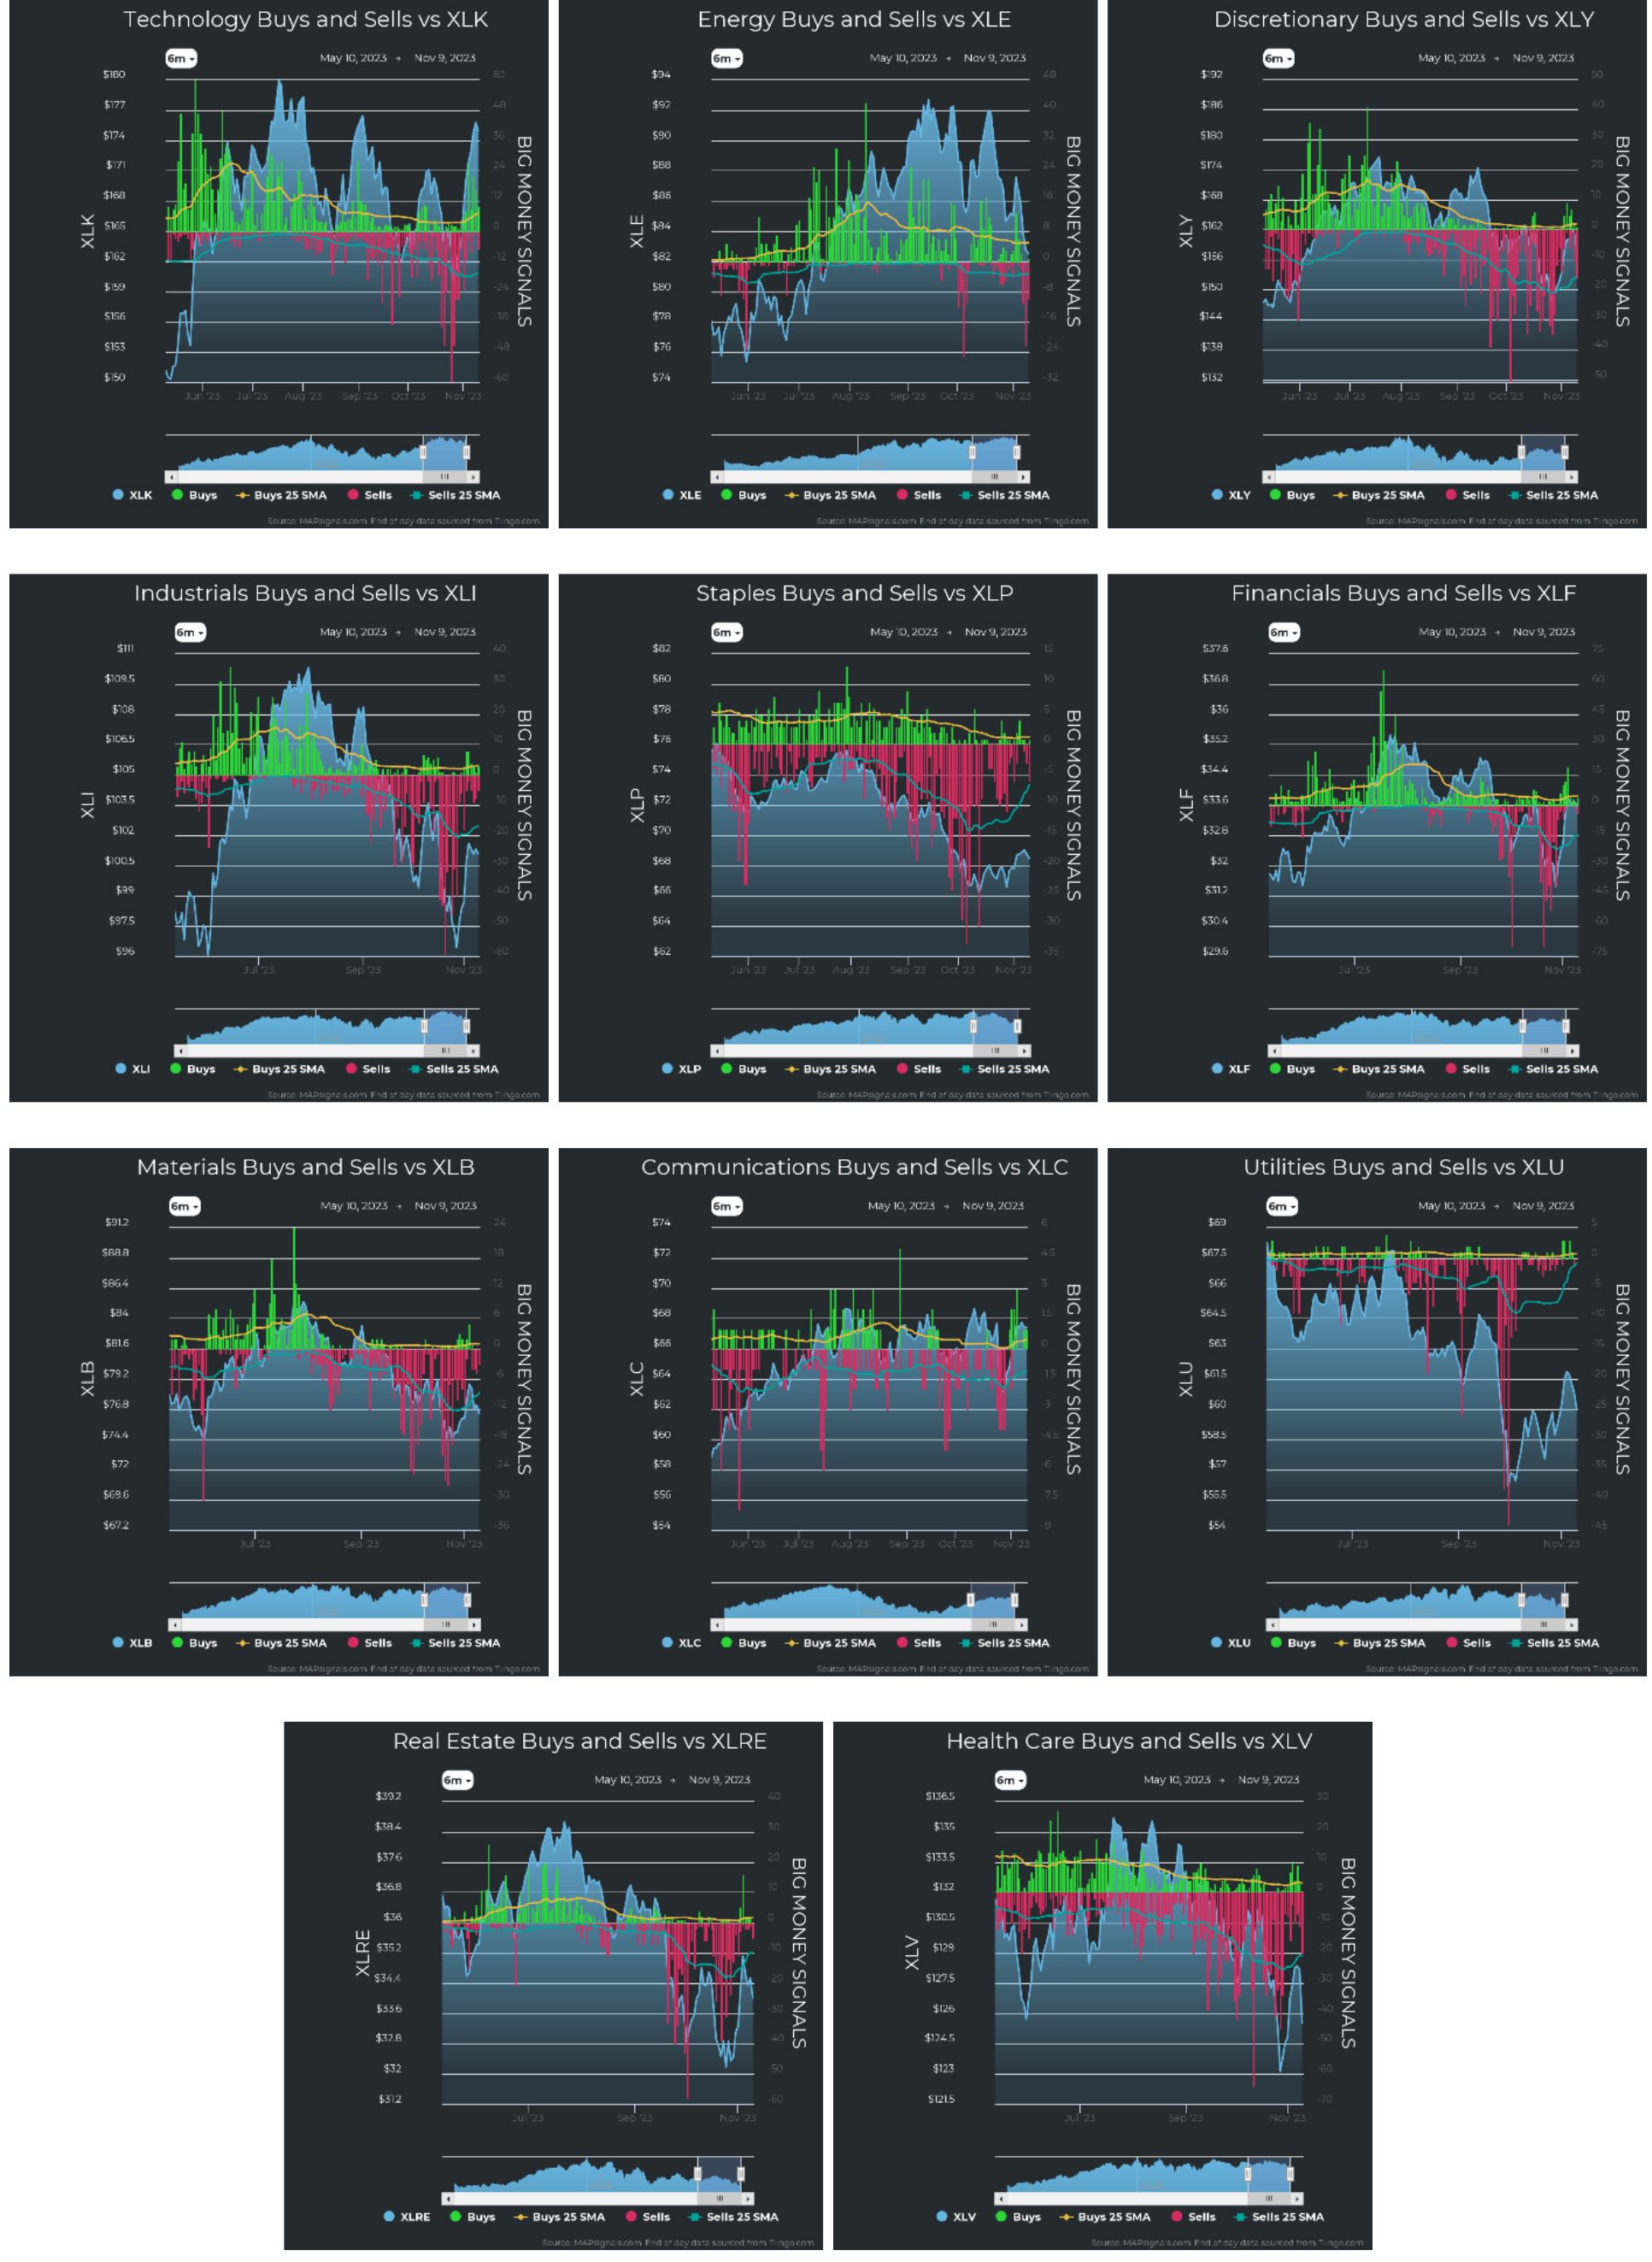
This new buying has catapulted Technology back into the #1 leadership position on the Sector Ranks:
![]()
Graphs are for illustrative and discussion purposes only. Please read important disclosures at the end of this commentary.
Energy saw some recent selling pressure, which indicates profit taking at the end of a bearish cycle. Energy was the only sector seemingly impervious to October’s intense selling. That said, nearly every other sector, with the exception of Health Care, saw selling vanish and even give way to new buying.
Graphs are for illustrative and discussion purposes only. Please read important disclosures at the end of this commentary.
This is constructive action, folks.
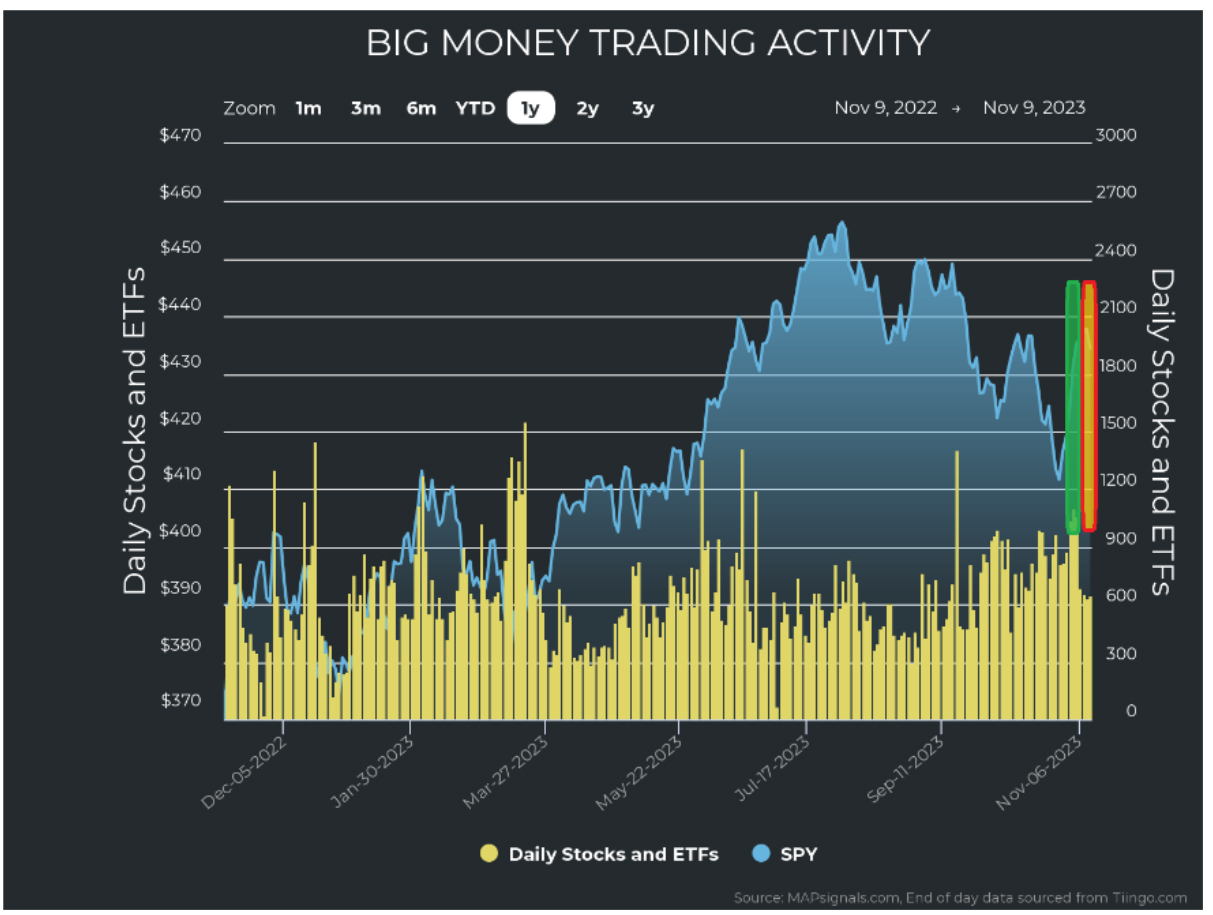
To take things a step further, let’s add this sector action to the bigger picture. First, let’s look at unusual trading volumes. The amber bars below show unusually large trades, according to my algorithms. What I found fascinating is that volume spiked huge as the market rocketed from the depths (green). And as the rally cooled, volume sank away (red). That’s what we want: Big up volume, and low down volume! That sets the stage for some continued constructive price action.
Graphs are for illustrative and discussion purposes only. Please read important disclosures at the end of this commentary.
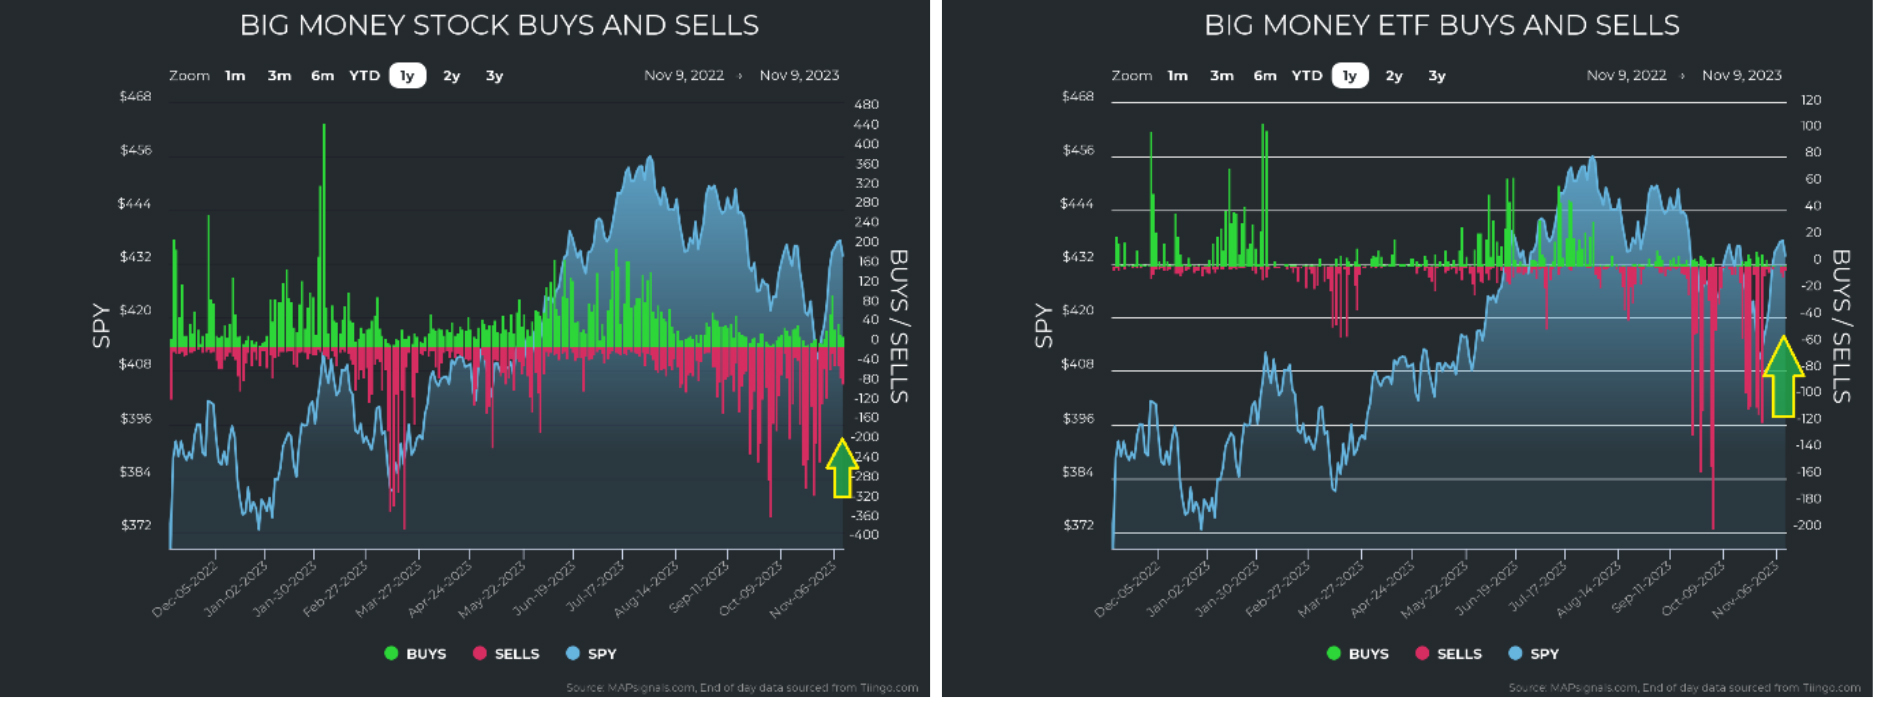
When we add this to a view of unusual buys and sells in stocks and ETFs, we see further positive indicators. Violent selling has subsided, nearly overnight – as if a switch were flipped on Halloween!
Graphs are for illustrative and discussion purposes only. Please read important disclosures at the end of this commentary.
This clearly points to some liquidations in October. I can’t say for sure, but this has the fingerprints of forced selling. July’s peak gave way to a bumpy August and weak September. October should have historically firmed up, but it weakened. And perhaps, portfolio managers were given the indication that it was time to reduce risk. Maybe investors redeemed their capital, requiring liquidation of positions. We can’t know for certain, but this has all the earmarks, because selling stopped on the last day of the month!
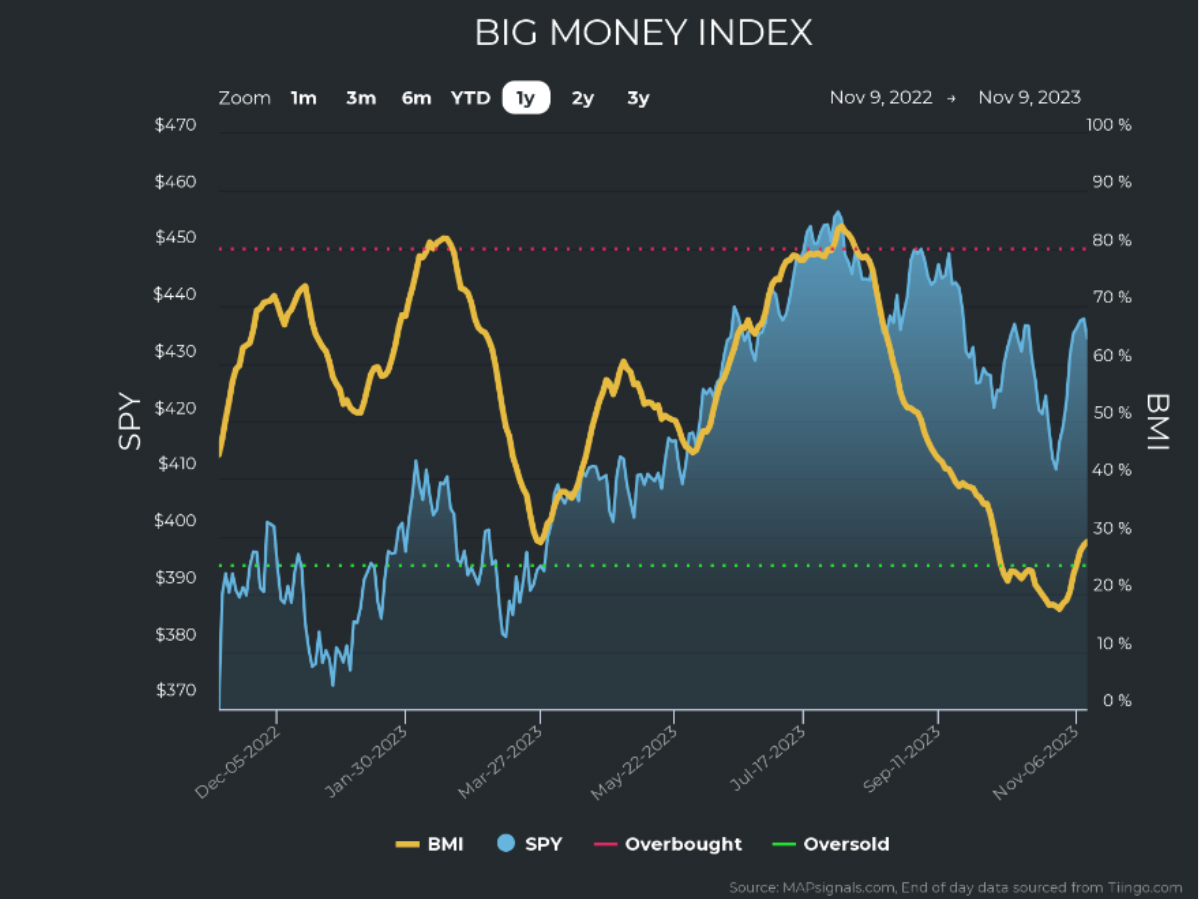
Now, look what happened to the Big Money Index (BMI).
Graphs are for illustrative and discussion purposes only. Please read important disclosures at the end of this commentary.
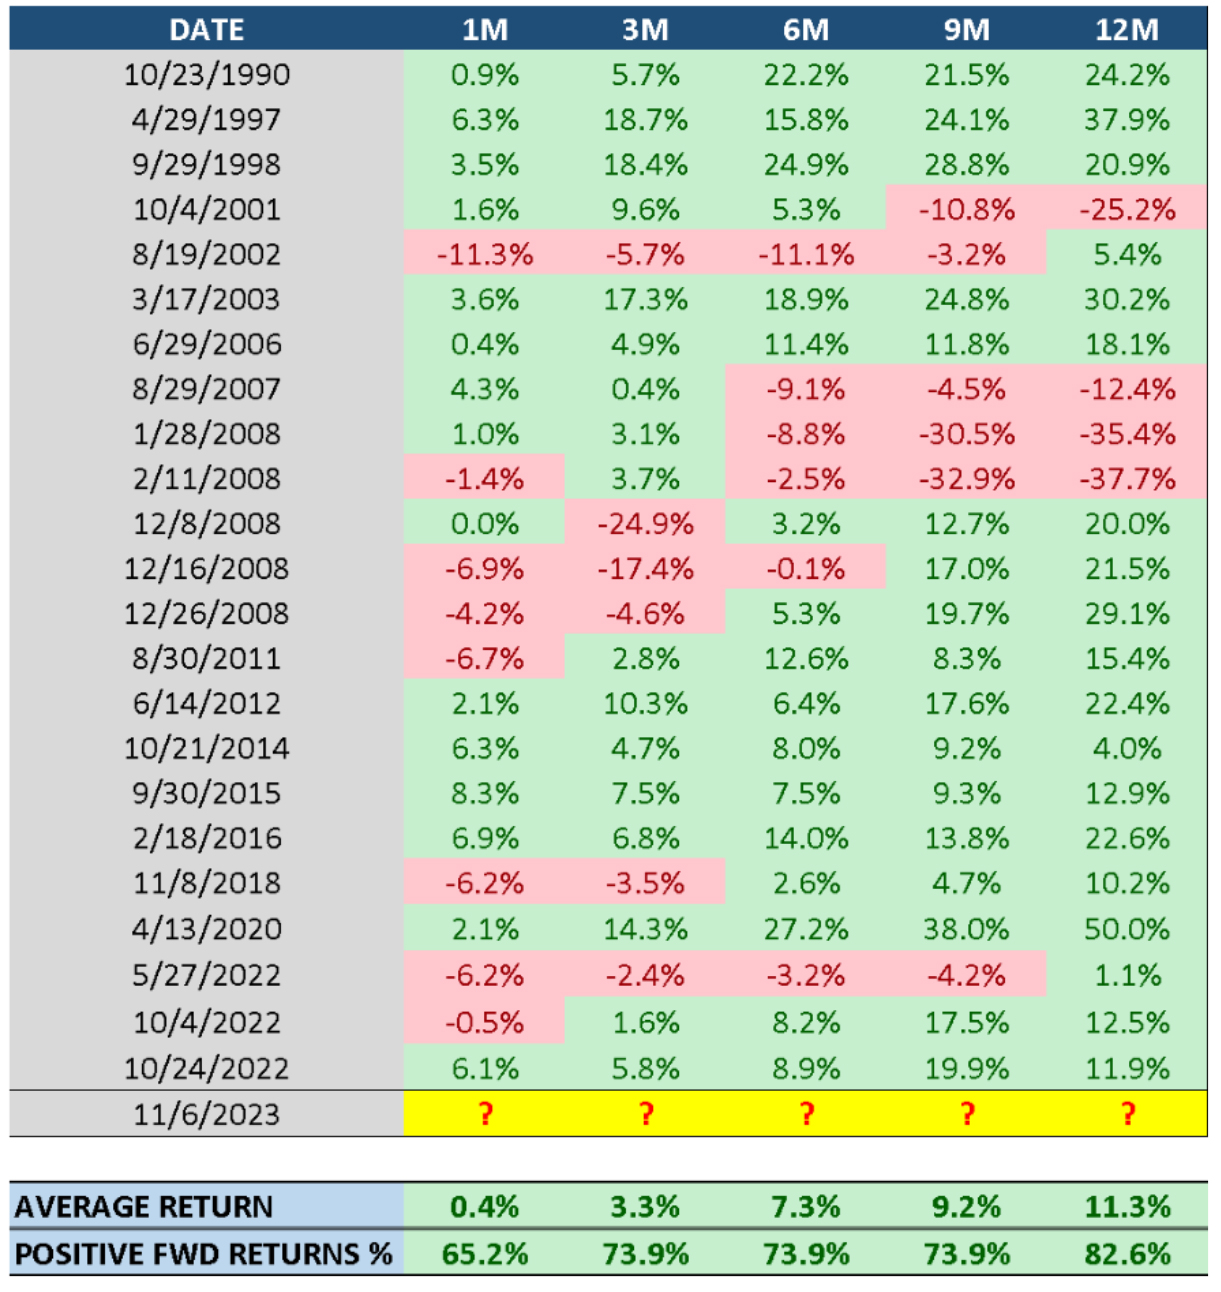
Talk about an about-face. The BMI went squarely into oversold territory, then turned on a dime and has since risen from oversold along with the immense rally we just saw. I wanted to see what prior instances like this now looked like, so I grabbed all the days in which the BMI closed above oversold after being oversold. This is what I found: the forward 1, 3, 6, 9 and 12-month returns were positive for a vast majority of the time. Markets rose at least 73.9% of the time, and 82.6% of the time 12 months later.
Graphs are for illustrative and discussion purposes only. Please read important disclosures at the end of this commentary.
Well, that’s certainly encouraging:
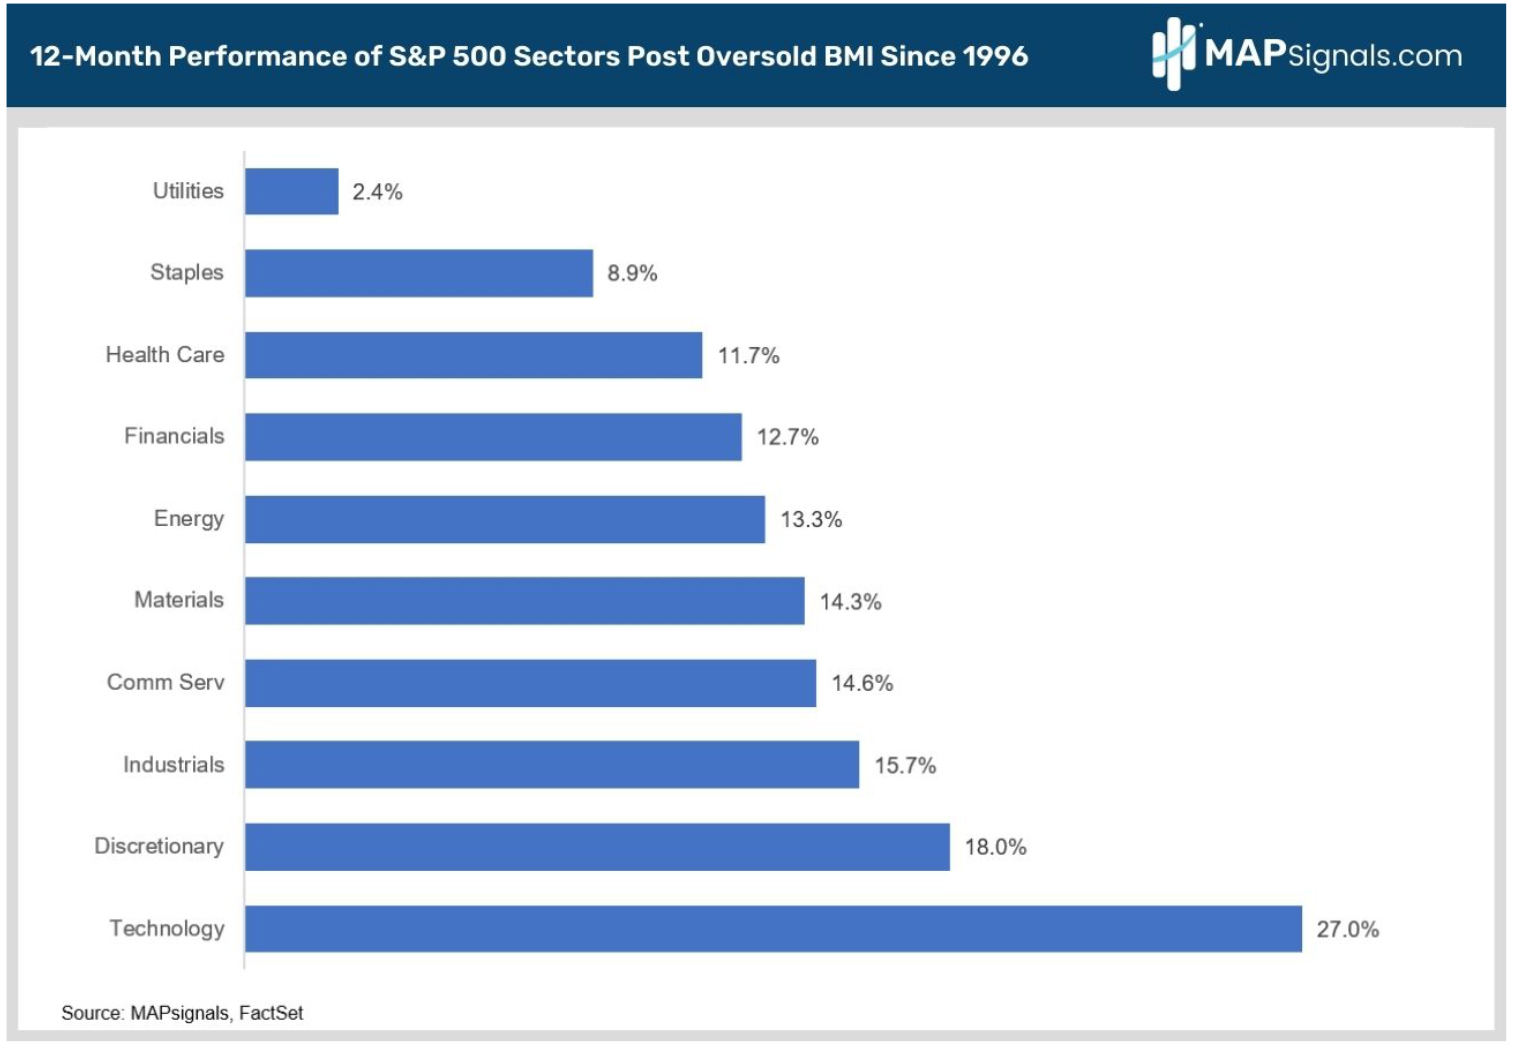
Now, if you want to know what is likely to lead us out of the bearishness, I already gave you a huge clue in the sector action above. My research firm MAPsignals undertook an awesome study that identified the best performing sectors after climbing out of oversold. If you guessed technology, you were right.
Here we can see how the sectors shook out (since 1996) after the BMI rose from oversold:
Graphs are for illustrative and discussion purposes only. Please read important disclosures at the end of this commentary.
The average tech returns of the 23 oversold instances since 1996 are as follows:
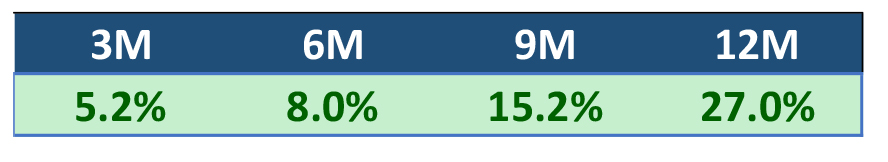
This is exciting, because we are already seeing early evidence of tech leading us out of the depths. Naturally, what you also shouldn’t overlook is that all sectors were higher in those instances since 1996.
Now, there are visual patterns we can assign to markets. Things like technical pivot points, bearish engulfing patterns, flags, Fibonacci retracements, and countless other patterns. Then on the other side, there is cold hard historical data. When we study the past and aggregate them for a forward prediction, it’s much more like associative learning. We are essentially doing trial and error.
This is the logic of AI… and ironically, it’s also the logic of pigeons. In either case, the news looks pretty good. We never know for sure, but if we can use proper logic to guide our decision making as investors, we can hope to avoid the pitfalls of assigning false patterns and trading on instinct.
Remember to stay humble. You could be replaced by a pigeon: “The learning principles that guide the behaviors of these AI machines are pretty similar to what pigeons use.” – Brandon Turner, Ohio State U.
All content above represents the opinion of Jason Bodner of Navellier & Associates, Inc.
Also In This Issue
A Look Ahead by Louis Navellier
Two Fed Presidents Audition for the Next Fed Chairmanship
Income Mail by Bryan Perry
The Teflon Tech Sector Is Leading a Chaotic Market
Growth Mail by Gary Alexander
Soaring Deficits – Who Cares? (Congress Doesn’t)
Global Mail by Ivan Martchev
So far, the Stock Market Bottom for 2023 Still Holds
Sector Spotlight by Jason Bodner
Can The Best Trading Systems Be Replaced by… Pigeons?
View Full Archive
Read Past Issues Here

Jason Bodner
MARKETMAIL EDITOR FOR SECTOR SPOTLIGHT
Jason Bodner writes Sector Spotlight in the weekly Marketmail publication and has authored several white papers for the company. He is also Co-Founder of Macro Analytics for Professionals which produces proprietary equity accumulation/distribution research for its clients. Previously, Mr. Bodner served as Director of European Equity Derivatives for Cantor Fitzgerald Europe in London, then moved to the role of Head of Equity Derivatives North America for the same company in New York. He also served as S.V.P. Equity Derivatives for Jefferies, LLC. He received a B.S. in business administration in 1996, with honors, from Skidmore College as a member of the Periclean Honors Society. All content of “Sector Spotlight” represents the opinion of Jason Bodner
Important Disclosures:
Jason Bodner is a co-founder and co-owner of Mapsignals. Mr. Bodner is an independent contractor who is occasionally hired by Navellier & Associates to write an article and or provide opinions for possible use in articles that appear in Navellier & Associates weekly Market Mail. Mr. Bodner is not employed or affiliated with Louis Navellier, Navellier & Associates, Inc., or any other Navellier owned entity. The opinions and statements made here are those of Mr. Bodner and not necessarily those of any other persons or entities. This is not an endorsement, or solicitation or testimonial or investment advice regarding the BMI Index or any statements or recommendations or analysis in the article or the BMI Index or Mapsignals or its products or strategies.
Although information in these reports has been obtained from and is based upon sources that Navellier believes to be reliable, Navellier does not guarantee its accuracy and it may be incomplete or condensed. All opinions and estimates constitute Navellier’s judgment as of the date the report was created and are subject to change without notice. These reports are for informational purposes only and are not a solicitation for the purchase or sale of a security. Any decision to purchase securities mentioned in these reports must take into account existing public information on such securities or any registered prospectus.To the extent permitted by law, neither Navellier & Associates, Inc., nor any of its affiliates, agents, or service providers assumes any liability or responsibility nor owes any duty of care for any consequences of any person acting or refraining to act in reliance on the information contained in this communication or for any decision based on it.
Past performance is no indication of future results. Investment in securities involves significant risk and has the potential for partial or complete loss of funds invested. It should not be assumed that any securities recommendations made by Navellier. in the future will be profitable or equal the performance of securities made in this report. Dividend payments are not guaranteed. The amount of a dividend payment, if any, can vary over time and issuers may reduce dividends paid on securities in the event of a recession or adverse event affecting a specific industry or issuer.
None of the stock information, data, and company information presented herein constitutes a recommendation by Navellier or a solicitation to buy or sell any securities. Any specific securities identified and described do not represent all of the securities purchased, sold, or recommended for advisory clients. The holdings identified do not represent all of the securities purchased, sold, or recommended for advisory clients and the reader should not assume that investments in the securities identified and discussed were or will be profitable.
Information presented is general information that does not take into account your individual circumstances, financial situation, or needs, nor does it present a personalized recommendation to you. Individual stocks presented may not be suitable for every investor. Investment in securities involves significant risk and has the potential for partial or complete loss of funds invested. Investment in fixed income securities has the potential for the investment return and principal value of an investment to fluctuate so that an investor’s holdings, when redeemed, may be worth less than their original cost.
One cannot invest directly in an index. Index is unmanaged and index performance does not reflect deduction of fees, expenses, or taxes. Presentation of Index data does not reflect a belief by Navellier that any stock index constitutes an investment alternative to any Navellier equity strategy or is necessarily comparable to such strategies. Among the most important differences between the Indices and Navellier strategies are that the Navellier equity strategies may (1) incur material management fees, (2) concentrate its investments in relatively few stocks, industries, or sectors, (3) have significantly greater trading activity and related costs, and (4) be significantly more or less volatile than the Indices.
ETF Risk: We may invest in exchange traded funds (“ETFs”) and some of our investment strategies are generally fully invested in ETFs. Like traditional mutual funds, ETFs charge asset-based fees, but they generally do not charge initial sales charges or redemption fees and investors typically pay only customary brokerage fees to buy and sell ETF shares. The fees and costs charged by ETFs held in client accounts will not be deducted from the compensation the client pays Navellier. ETF prices can fluctuate up or down, and a client account could lose money investing in an ETF if the prices of the securities owned by the ETF go down. ETFs are subject to additional risks:
- ETF shares may trade above or below their net asset value;
- An active trading market for an ETF’s shares may not develop or be maintained;
- The value of an ETF may be more volatile than the underlying portfolio of securities the ETF is designed to track;
- The cost of owning shares of the ETF may exceed those a client would incur by directly investing in the underlying securities; and
- Trading of an ETF’s shares may be halted if the listing exchange’s officials deem it appropriate, the shares are delisted from the exchange, or the activation of market-wide “circuit breakers” (which are tied to large decreases in stock prices) halts stock trading generally.
Grader Disclosures: Investment in equity strategies involves substantial risk and has the potential for partial or complete loss of funds invested. The sample portfolio and any accompanying charts are for informational purposes only and are not to be construed as a solicitation to buy or sell any financial instrument and should not be relied upon as the sole factor in an investment making decision. As a matter of normal and important disclosures to you, as a potential investor, please consider the following: The performance presented is not based on any actual securities trading, portfolio, or accounts, and the reported performance of the A, B, C, D, and F portfolios (collectively the “model portfolios”) should be considered mere “paper” or pro forma performance results based on Navellier’s research.
Investors evaluating any of Navellier & Associates, Inc.’s, (or its affiliates’) Investment Products must not use any information presented here, including the performance figures of the model portfolios, in their evaluation of any Navellier Investment Products. Navellier Investment Products include the firm’s mutual funds and managed accounts. The model portfolios, charts, and other information presented do not represent actual funded trades and are not actual funded portfolios. There are material differences between Navellier Investment Products’ portfolios and the model portfolios, research, and performance figures presented here. The model portfolios and the research results (1) may contain stocks or ETFs that are illiquid and difficult to trade; (2) may contain stock or ETF holdings materially different from actual funded Navellier Investment Product portfolios; (3) include the reinvestment of all dividends and other earnings, estimated trading costs, commissions, or management fees; and, (4) may not reflect prices obtained in an actual funded Navellier Investment Product portfolio. For these and other reasons, the reported performances of model portfolios do not reflect the performance results of Navellier’s actually funded and traded Investment Products. In most cases, Navellier’s Investment Products have materially lower performance results than the performances of the model portfolios presented.
This report contains statements that are, or may be considered to be, forward-looking statements. All statements that are not historical facts, including statements about our beliefs or expectations, are “forward-looking statements” within the meaning of The U.S. Private Securities Litigation Reform Act of 1995. These statements may be identified by such forward-looking terminology as “expect,” “estimate,” “plan,” “intend,” “believe,” “anticipate,” “may,” “will,” “should,” “could,” “continue,” “project,” or similar statements or variations of such terms. Our forward-looking statements are based on a series of expectations, assumptions, and projections, are not guarantees of future results or performance, and involve substantial risks and uncertainty as described in Form ADV Part 2A of our filing with the Securities and Exchange Commission (SEC), which is available at www.adviserinfo.sec.gov or by requesting a copy by emailing info@navellier.com. All of our forward-looking statements are as of the date of this report only. We can give no assurance that such expectations or forward-looking statements will prove to be correct. Actual results may differ materially. You are urged to carefully consider all such factors.
FEDERAL TAX ADVICE DISCLAIMER: As required by U.S. Treasury Regulations, you are informed that, to the extent this presentation includes any federal tax advice, the presentation is not written by Navellier to be used, and cannot be used, for the purpose of avoiding federal tax penalties. Navellier does not advise on any income tax requirements or issues. Use of any information presented by Navellier is for general information only and does not represent tax advice either express or implied. You are encouraged to seek professional tax advice for income tax questions and assistance.
IMPORTANT NEWSLETTER DISCLOSURE:The hypothetical performance results for investment newsletters that are authored or edited by Louis Navellier, including Louis Navellier’s Growth Investor, Louis Navellier’s Breakthrough Stocks, Louis Navellier’s Accelerated Profits, and Louis Navellier’s Platinum Club, are not based on any actual securities trading, portfolio, or accounts, and the newsletters’ reported hypothetical performances should be considered mere “paper” or proforma hypothetical performance results and are not actual performance of real world trades. Navellier & Associates, Inc. does not have any relation to or affiliation with the owner of these newsletters. There are material differences between Navellier Investment Products’ portfolios and the InvestorPlace Media, LLC newsletter portfolios authored by Louis Navellier. The InvestorPlace Media, LLC newsletters contain hypothetical performance that do not include transaction costs, advisory fees, or other fees a client might incur if actual investments and trades were being made by an investor. As a result, newsletter performance should not be used to evaluate Navellier Investment services which are separate and different from the newsletters. The owner of the newsletters is InvestorPlace Media, LLC and any questions concerning the newsletters, including any newsletter advertising or hypothetical Newsletter performance claims, (which are calculated solely by Investor Place Media and not Navellier) should be referred to InvestorPlace Media, LLC at (800) 718-8289.
Please note that Navellier & Associates and the Navellier Private Client Group are managed completely independent of the newsletters owned and published by InvestorPlace Media, LLC and written and edited by Louis Navellier, and investment performance of the newsletters should in no way be considered indicative of potential future investment performance for any Navellier & Associates separately managed account portfolio. Potential investors should consult with their financial advisor before investing in any Navellier Investment Product.
Navellier claims compliance with Global Investment Performance Standards (GIPS). To receive a complete list and descriptions of Navellier’s composites and/or a presentation that adheres to the GIPS standards, please contact Navellier or click here. It should not be assumed that any securities recommendations made by Navellier & Associates, Inc. in the future will be profitable or equal the performance of securities made in this report.
FactSet Disclosure: Navellier does not independently calculate the statistical information included in the attached report. The calculation and the information are provided by FactSet, a company not related to Navellier. Although information contained in the report has been obtained from FactSet and is based on sources Navellier believes to be reliable, Navellier does not guarantee its accuracy, and it may be incomplete or condensed. The report and the related FactSet sourced information are provided on an “as is” basis. The user assumes the entire risk of any use made of this information. Investors should consider the report as only a single factor in making their investment decision. The report is for informational purposes only and is not intended as an offer or solicitation for the purchase or sale of a security. FactSet sourced information is the exclusive property of FactSet. Without prior written permission of FactSet, this information may not be reproduced, disseminated or used to create any financial products. All indices are unmanaged and performance of the indices include reinvestment of dividends and interest income, unless otherwise noted, are not illustrative of any particular investment and an investment cannot be made in any index. Past performance is no guarantee of future results.