
by Ivan Martchev
July 14, 2026
This headline is a “teaser” (I hope it got your attention), but to be honest with you I don’t have a clue as to the answer. How do you value the assets of about 8.3 billion people and a livable planet that is 4.54 billion years old – give or take 50 million years? But the question came up in an Elon Musk tweet, July 9:
“SpaceX will be worth more than the rest of Earth if we accomplish our goals.” – Elon Musk
The key here is the little word “if” attached to his “goals.” That sure is a big “if,” the biggest “if” of any company trying to talk about the future. I like the fact that SpaceX wants to turn humanity into an interplanetary species. I like the fact he’s taking the fiction out of “science fiction.” Among his goals, they want to build a city on the Moon and later on Mars. That is fine and dandy, but I think it will take a few years, maybe decades, and share prices are about discounting future cash-flows. Those cities on the Moon and Mars are hard to discount, to put it mildly, as they certainly won’t happen within the next year or two.
Graphs are for illustrative and discussion purposes only. Please read important disclosures at the end of this commentary.
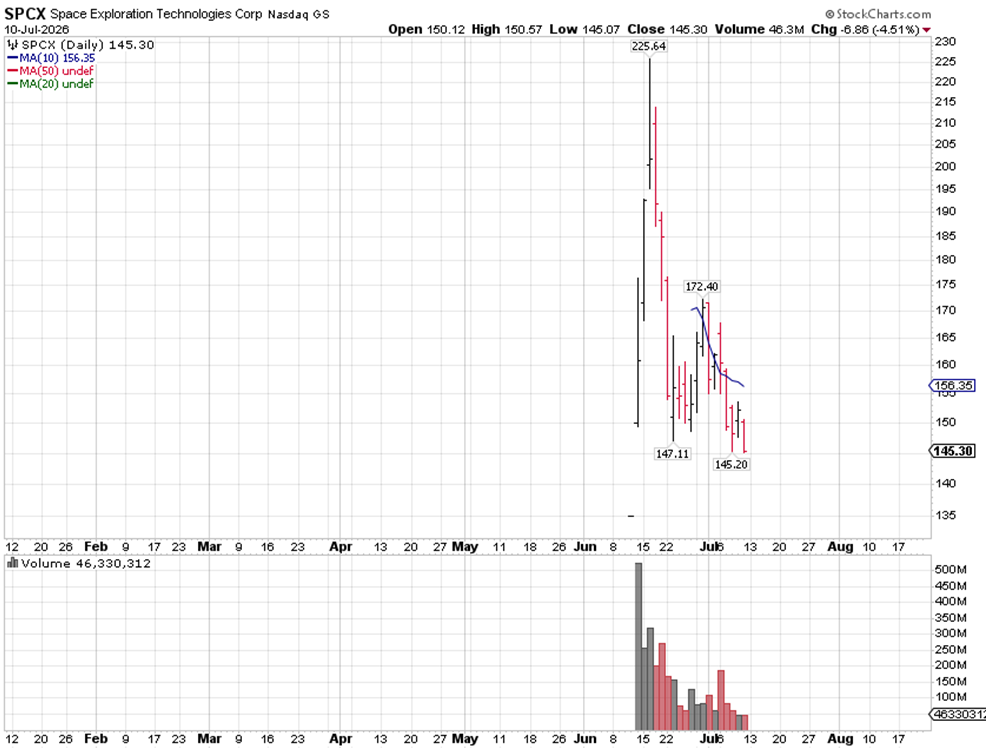
Musk wants to generate $1 trillion in revenues by 2030. If anyone can do it, Elon Musk can, but we are in a foggy period now, before any plans of how he is going to get there have become public, which is why on Friday SPCX stock traded at its lowest level reached in the secondary market with a trade of $145.07 (the IPO price was $135). I gave you my read of the situation before SPCX became a public company, simply because I’ve had to field a lot of questions about the stock, as it generates keen investor interest.
The leveraged ETF community has noticed this investor interest and has listed five 2X leveraged bullish single-stock ETFs on SpaceX, and one bearish-inverse ETF. I find the idea of single-stock 2X exchange-traded funds absurd. What type of a “fund” would hold only one stock?! And piling this 2X leverage on top of an already-volatile security is only going to make it more volatile.
If Elon Musk divulges more plans of how he will get to $1 trillion in revenues by 2030, and investors see credible corporate action, the stock will probably rally. If, however, his nebulous trillion-dollar plans are confined to cryptic tweets, then the breaking of the IPO price of $135 is all but a foregone conclusion.
Many point out Tesla’s spectacular growth after it became public in 2010, but few bothered to look up Tesla’s market cap at its IPO price – it was only $1.7 billion, while SpaceX’s debut price was 1,000+ times higher, at $1.75 trillion. Tesla grew dramatically since 2010, while SpaceX is already at a huge market cap. Investors will get a better grip on what SpaceX is worth after a huge part of the lockups expire in the August-December period and we get more details on his interplanetary exploration plans.
Right now, with only 4.3% of the float trading and the stock not acting well, if we get an escalation in the Iranian war, which seems to be happening as of this writing (on Sunday), the shares are headed towards $100. If we use SpaceX’s share price purely as a sentiment indicator, recent action indicates overall investor skittishness — indicating further declines in the stock (and the overall market) may be in store.
I think most investors hoped by now they would see some progress in the Iranian negotiations. Instead, the President has declared the truce “dead,” and the U.S. is trading strikes with the Iranians at an accelerating rate. The price of crude oil, Treasury bonds, or the level of the S&P 500 index do not suggest all is lost, indicating some hope these latest eruptions are simply skirmishes. But what if they aren’t?
I can’t handicap the Iranian situation (can anyone?). I know the White House wants it over, as it is too close to November’s mid-term elections. The Iranians are dragging their feet on purpose to get a better deal, and I know Israel would prefer to do as much damage as possible. Although no regime change is likely, given what we have witnessed so far, I am not sure what is the point of more bombing.
Graphs are for illustrative and discussion purposes only. Please read important disclosures at the end of this commentary.
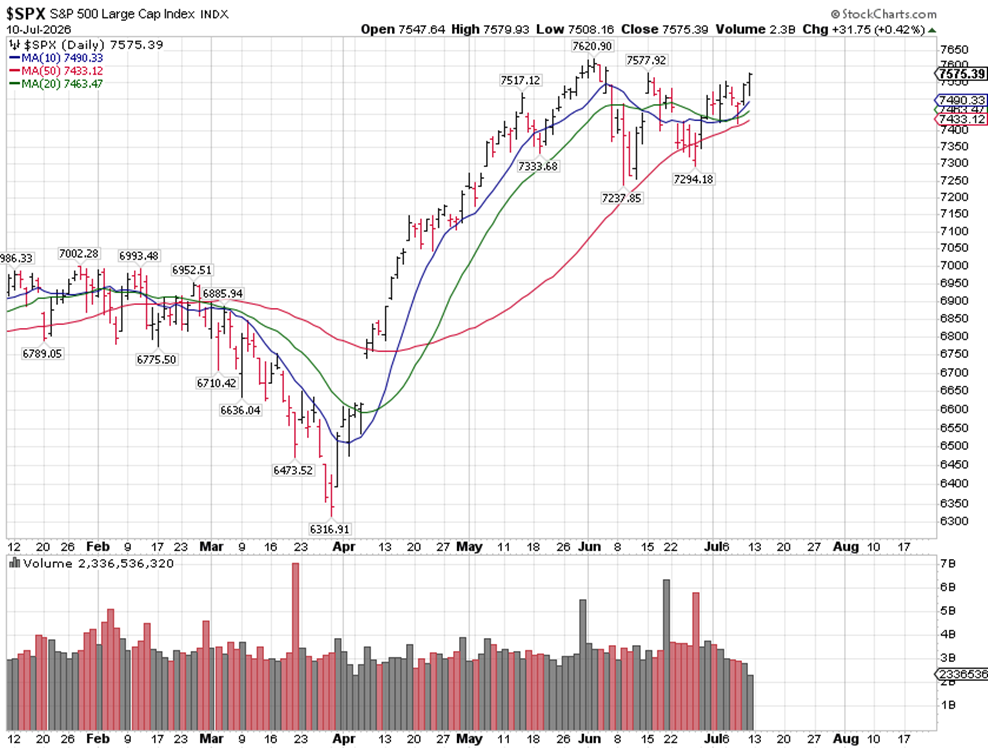
So far, what we have experienced in the stock market is a normal consolidation after a sharp rally. As bad as these vicious rotations feel on single days, indexes have not broken down enough to suggest a deeper correction. Both the Dow and the S&P 500 (equal weight variety) indexes made all-time highs early last week. If Iran does not explode, literally, maybe all we are going to get is a benign sideways consolidation before second-quarter earnings kick in mid-July and into August. Earnings are expected to be up ~25%.
If Iran does explode, literally, we have to play it day by day. There is room for a bigger sell-off in the next three-weeks, if we see bad Iranian headlines. The President moved the S&P 500 by 50-points with a single TruthSocial post on Friday. I have seen him move the S&P 200-points in either direction with his posts. It looks like we must remain on alert for word bombs emanating from the President’s Truth Social account.
Graphs are for illustrative and discussion purposes only. Please read important disclosures at the end of this commentary.
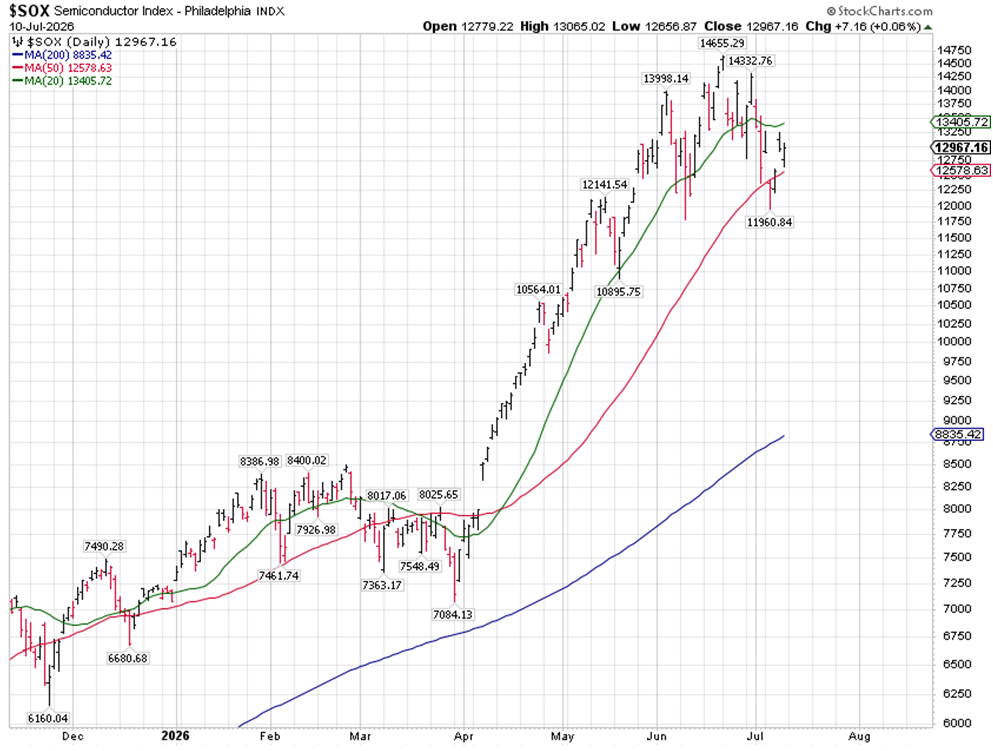
We also need to keep a close eye on the PHLX Semiconductor Index (SOX), as it kept making progress despite rotation out of technology, until recently. Yes, there are memory shortages, and yes, many of the components are trading at dirt cheap P/Es due to surging profits, but there is also record leverage from margin debt and exploding option volumes, which may push a normal correction a lot deeper when it gets going. A couple of closes below 11,960 (the July lows) probably mean a much deeper correction for the SOX and the broader market, so the 12,000 level on the SOX is as close to a line in the sand as it gets.
Navellier & Associates; do not own Space Exploration Technology Corp (SPCX) in managed accounts. A few accounts own Tesla (TSLA) per client request. Ivan Marchev does not own Space Exploration Technology Corp (SPCX) or SK Hynix ADR (SKHYV) personally.
All content above represents the opinion of Ivan Martchev of Navellier & Associates, Inc.
Also In This Issue
A Look Ahead by Louis Navellier
America’s 250th Birthday Celebrates America’s Leadership
Income Mail by Bryan Perry
Q2 Earnings Season May Deliver a Major Market Tailwind
Growth Mail by Gary Alexander
Report from America’s Big Birthday Bash in Vegas
Global Mail by Ivan Martchev
What is Planet Earth Worth?
Sector Spotlight by Jason Bodner
Is the Stock Market “Cavitating” On Us?
View Full Archive
Read Past Issues Here

Ivan Martchev
INVESTMENT STRATEGIST
Ivan Martchev is an investment strategist with Navellier. Previously, Ivan served as editorial director at InvestorPlace Media. Ivan was editor of Louis Rukeyser’s Mutual Funds and associate editor of Personal Finance. Ivan is also co-author of The Silk Road to Riches (Financial Times Press). The book provided analysis of geopolitical issues and investment strategy in natural resources and emerging markets with an emphasis on Asia. The book also correctly predicted the collapse in the U.S. real estate market, the rise of precious metals, and the resulting increased investor interest in emerging markets. Ivan’s commentaries have been published by MSNBC, The Motley Fool, MarketWatch, and others. All content of “Global Mail” represents the opinion of Ivan Martchev
Important Disclosures:
Although information in these reports has been obtained from and is based upon sources that Navellier believes to be reliable, Navellier does not guarantee its accuracy and it may be incomplete or condensed. All opinions and estimates constitute Navellier’s judgment as of the date the report was created and are subject to change without notice. These reports are for informational purposes only and are not a solicitation for the purchase or sale of a security. Any decision to purchase securities mentioned in these reports must take into account existing public information on such securities or any registered prospectus.To the extent permitted by law, neither Navellier & Associates, Inc., nor any of its affiliates, agents, or service providers assumes any liability or responsibility nor owes any duty of care for any consequences of any person acting or refraining to act in reliance on the information contained in this communication or for any decision based on it.
Past performance is no indication of future results. Investment in securities involves significant risk and has the potential for partial or complete loss of funds invested. It should not be assumed that any securities recommendations made by Navellier. in the future will be profitable or equal the performance of securities made in this report. Dividend payments are not guaranteed. The amount of a dividend payment, if any, can vary over time and issuers may reduce dividends paid on securities in the event of a recession or adverse event affecting a specific industry or issuer.
None of the stock information, data, and company information presented herein constitutes a recommendation by Navellier or a solicitation to buy or sell any securities. Any specific securities identified and described do not represent all of the securities purchased, sold, or recommended for advisory clients. The holdings identified do not represent all of the securities purchased, sold, or recommended for advisory clients and the reader should not assume that investments in the securities identified and discussed were or will be profitable.
Information presented is general information that does not take into account your individual circumstances, financial situation, or needs, nor does it present a personalized recommendation to you. Individual stocks presented may not be suitable for every investor. Investment in securities involves significant risk and has the potential for partial or complete loss of funds invested. Investment in fixed income securities has the potential for the investment return and principal value of an investment to fluctuate so that an investor’s holdings, when redeemed, may be worth less than their original cost.
One cannot invest directly in an index. Index is unmanaged and index performance does not reflect deduction of fees, expenses, or taxes. Presentation of Index data does not reflect a belief by Navellier that any stock index constitutes an investment alternative to any Navellier equity strategy or is necessarily comparable to such strategies. Among the most important differences between the Indices and Navellier strategies are that the Navellier equity strategies may (1) incur material management fees, (2) concentrate its investments in relatively few stocks, industries, or sectors, (3) have significantly greater trading activity and related costs, and (4) be significantly more or less volatile than the Indices.
ETF Risk: We may invest in exchange traded funds (“ETFs”) and some of our investment strategies are generally fully invested in ETFs. Like traditional mutual funds, ETFs charge asset-based fees, but they generally do not charge initial sales charges or redemption fees and investors typically pay only customary brokerage fees to buy and sell ETF shares. The fees and costs charged by ETFs held in client accounts will not be deducted from the compensation the client pays Navellier. ETF prices can fluctuate up or down, and a client account could lose money investing in an ETF if the prices of the securities owned by the ETF go down. ETFs are subject to additional risks:
- ETF shares may trade above or below their net asset value;
- An active trading market for an ETF’s shares may not develop or be maintained;
- The value of an ETF may be more volatile than the underlying portfolio of securities the ETF is designed to track;
- The cost of owning shares of the ETF may exceed those a client would incur by directly investing in the underlying securities; and
- Trading of an ETF’s shares may be halted if the listing exchange’s officials deem it appropriate, the shares are delisted from the exchange, or the activation of market-wide “circuit breakers” (which are tied to large decreases in stock prices) halts stock trading generally.
Grader Disclosures: Investment in equity strategies involves substantial risk and has the potential for partial or complete loss of funds invested. The sample portfolio and any accompanying charts are for informational purposes only and are not to be construed as a solicitation to buy or sell any financial instrument and should not be relied upon as the sole factor in an investment making decision. As a matter of normal and important disclosures to you, as a potential investor, please consider the following: The performance presented is not based on any actual securities trading, portfolio, or accounts, and the reported performance of the A, B, C, D, and F portfolios (collectively the “model portfolios”) should be considered mere “paper” or pro forma performance results based on Navellier’s research.
Investors evaluating any of Navellier & Associates, Inc.’s, (or its affiliates’) Investment Products must not use any information presented here, including the performance figures of the model portfolios, in their evaluation of any Navellier Investment Products. Navellier Investment Products include the firm’s mutual funds and managed accounts. The model portfolios, charts, and other information presented do not represent actual funded trades and are not actual funded portfolios. There are material differences between Navellier Investment Products’ portfolios and the model portfolios, research, and performance figures presented here. The model portfolios and the research results (1) may contain stocks or ETFs that are illiquid and difficult to trade; (2) may contain stock or ETF holdings materially different from actual funded Navellier Investment Product portfolios; (3) include the reinvestment of all dividends and other earnings, estimated trading costs, commissions, or management fees; and, (4) may not reflect prices obtained in an actual funded Navellier Investment Product portfolio. For these and other reasons, the reported performances of model portfolios do not reflect the performance results of Navellier’s actually funded and traded Investment Products. In most cases, Navellier’s Investment Products have materially lower performance results than the performances of the model portfolios presented.
This report contains statements that are, or may be considered to be, forward-looking statements. All statements that are not historical facts, including statements about our beliefs or expectations, are “forward-looking statements” within the meaning of The U.S. Private Securities Litigation Reform Act of 1995. These statements may be identified by such forward-looking terminology as “expect,” “estimate,” “plan,” “intend,” “believe,” “anticipate,” “may,” “will,” “should,” “could,” “continue,” “project,” or similar statements or variations of such terms. Our forward-looking statements are based on a series of expectations, assumptions, and projections, are not guarantees of future results or performance, and involve substantial risks and uncertainty as described in Form ADV Part 2A of our filing with the Securities and Exchange Commission (SEC), which is available at www.adviserinfo.sec.gov or by requesting a copy by emailing info@navellier.com. All of our forward-looking statements are as of the date of this report only. We can give no assurance that such expectations or forward-looking statements will prove to be correct. Actual results may differ materially. You are urged to carefully consider all such factors.
FEDERAL TAX ADVICE DISCLAIMER: As required by U.S. Treasury Regulations, you are informed that, to the extent this presentation includes any federal tax advice, the presentation is not written by Navellier to be used, and cannot be used, for the purpose of avoiding federal tax penalties. Navellier does not advise on any income tax requirements or issues. Use of any information presented by Navellier is for general information only and does not represent tax advice either express or implied. You are encouraged to seek professional tax advice for income tax questions and assistance.
IMPORTANT NEWSLETTER DISCLOSURE:The hypothetical performance results for investment newsletters that are authored or edited by Louis Navellier, including Louis Navellier’s Growth Investor, Louis Navellier’s Breakthrough Stocks, Louis Navellier’s Accelerated Profits, and Louis Navellier’s Platinum Club, are not based on any actual securities trading, portfolio, or accounts, and the newsletters’ reported hypothetical performances should be considered mere “paper” or proforma hypothetical performance results and are not actual performance of real world trades. Navellier & Associates, Inc. does not have any relation to or affiliation with the owner of these newsletters. There are material differences between Navellier Investment Products’ portfolios and the InvestorPlace Media, LLC newsletter portfolios authored by Louis Navellier. The InvestorPlace Media, LLC newsletters contain hypothetical performance that do not include transaction costs, advisory fees, or other fees a client might incur if actual investments and trades were being made by an investor. As a result, newsletter performance should not be used to evaluate Navellier Investment services which are separate and different from the newsletters. The owner of the newsletters is InvestorPlace Media, LLC and any questions concerning the newsletters, including any newsletter advertising or hypothetical Newsletter performance claims, (which are calculated solely by Investor Place Media and not Navellier) should be referred to InvestorPlace Media, LLC at (800) 718-8289.
Please note that Navellier & Associates and the Navellier Private Client Group are managed completely independent of the newsletters owned and published by InvestorPlace Media, LLC and written and edited by Louis Navellier, and investment performance of the newsletters should in no way be considered indicative of potential future investment performance for any Navellier & Associates separately managed account portfolio. Potential investors should consult with their financial advisor before investing in any Navellier Investment Product.
Navellier claims compliance with Global Investment Performance Standards (GIPS). To receive a complete list and descriptions of Navellier’s composites and/or a presentation that adheres to the GIPS standards, please contact Navellier or click here. It should not be assumed that any securities recommendations made by Navellier & Associates, Inc. in the future will be profitable or equal the performance of securities made in this report.
FactSet Disclosure: Navellier does not independently calculate the statistical information included in the attached report. The calculation and the information are provided by FactSet, a company not related to Navellier. Although information contained in the report has been obtained from FactSet and is based on sources Navellier believes to be reliable, Navellier does not guarantee its accuracy, and it may be incomplete or condensed. The report and the related FactSet sourced information are provided on an “as is” basis. The user assumes the entire risk of any use made of this information. Investors should consider the report as only a single factor in making their investment decision. The report is for informational purposes only and is not intended as an offer or solicitation for the purchase or sale of a security. FactSet sourced information is the exclusive property of FactSet. Without prior written permission of FactSet, this information may not be reproduced, disseminated or used to create any financial products. All indices are unmanaged and performance of the indices include reinvestment of dividends and interest income, unless otherwise noted, are not illustrative of any particular investment and an investment cannot be made in any index. Past performance is no guarantee of future results.