
by Bryan Perry
July 14, 2026
Second-quarter 2026 earnings season is unfolding with unprecedented momentum. Wall Street consensus began the year expecting strong results, but an extraordinary trend developed between April and June: Analysts raised their financial forecasts. In a typical quarter, estimates fall by 2% to 3% as reality sets in, whereas for Q2 2026, S&P 500 earnings per share projections were revised upward by 3.4% last quarter.
Entering mid-July, the consensus year-over-year earnings growth rate is a spectacular 23.6%. However, this is just the baseline. Taking into account historical beat rates – where 78% to 80% of all companies habitually clear Wall Street’s bar – the most bullish outlook for Q2 earnings suggests a 30% growth rate.
This 30% growth rate would represent the highest corporate profit expansion since the post-pandemic boom of late 2021, and its impact on the stock market would be profound. To understand how the S&P 500 could achieve a 30%+ earnings surge, one must look at the immense operating leverage sweeping corporate America. This bullish case relies on a dual engine: relentless demand for artificial intelligence infrastructure and some resilience in heavy industry and energy. Here is the math, as reported by FactSet:
“Over the past four-quarters (Q2 2025 through Q1 2026), actual earnings reported by S&P 500 companies have exceeded estimated earnings by 9.2% on average. During these four-quarters, 80% of companies in the S&P 500 reported actual EPS above the mean EPS estimate on average. As a result, from the end of the quarter through the end of the earnings season, the earnings growth rate has increased by 8.5 percentage points on average (during the past four-quarters) due to the number and magnitude of positive earnings surprises. If this average increase is applied to the estimated earnings growth rate at the end of Q2 (June 30) of 23.2%, the actual earnings growth rate for the quarter would be 31.7% (23.2% + 8.5% = 31.7%).”
While 2024 and 2025 focused heavily on software and early chip architectures, Q2 2026 is experiencing an all-out physical supply squeeze. High-end memory manufacturers and semiconductor infrastructure companies are delivering outsized figures. The bullish thesis sees the technology hyperscalers expanding capital expenditure aggressively, translating directly into double-digit revenue expansions for suppliers. Memory chip bottle-necks allowed pricing power to surge, insulating technology margins from broad inflationary pressure.
The unexpected champion of this hyper-bullish narrative is physical infrastructure. Artificial intelligence data centers require massive quantities of electricity and heavy hardware. Industrial sectors are capitalizing on a surge in power-infrastructure buildouts, with backlog growth averaging 34% and order growth exceeding 24%. Power-related commercial segments are seeing sales jump by 35%, with exponentially scaling net margins. When combined with utility expansions, the picks and shovels of the digital age are generating traditional industrial growth numbers not seen in decades.
A primary reason for Q2 revisions turning positive was the energy sector. Driven by stabilized global demand and shifting supply dynamics, energy companies saw the largest upward EPS adjustments of any sector in the quarter (+61.5%). Under the most bullish framework, energy acts as a massive cyclical cushion, so even if consumer-discretionary sectors feel minor pinches, the index is heavily insulated.
A corporate earnings “beat” of this magnitude alters the fundamental math underpinning equity values, driving changes across several key market dynamics. The S&P 500 has climbed past 7,600, causing a wave of anxiety regarding any possibility of higher forward price-to-earnings (P/E) multiples.
Critics have warned that a 21x to 22x forward P/E leaves the market vulnerable. However, 30% earnings expansion acts as an immediate de-risking mechanism. When earnings grow faster than stock prices, the P/E ratio compresses, without requiring a drop in stock prices. A hyper-bullish corporate scorecard would validate these lofty valuations, turning speculative bubble fears into a fundamentally justified expansion.
For the past two-years, equity gains were heavily concentrated in a tight handful of mega-cap technology stocks. The ultra-bullish Q2 earnings case provides the fundamental catalyst for long-awaited market breadth. With 10 out of 11 S&P 500 sectors projected to post positive year-over-year gains, capital is actively rotating into equal-weight index segments – industrials, financial institutions and materials.
A market hitting record highs, supported by hundreds of advancing stocks, is structurally safer and more resilient than one relying on just a handful of tech giants alone. And rapidly rising earnings expansions yield serious free cash flow. If corporate cash generation clears the bull-case hurdle, corporations will likely announce expanded share-buyback authorizations for the second half of 2026.
This dynamic creates a structural floor for stock prices, as companies become the primary buyers of their own equities. Furthermore, it allows technology firms to maintain their huge and growing AI investments without exhausting cash reserves or expanding debt burdens in an elevated interest-rate environment.
The financial data heading into the heart of July confirms corporate America is operating with remarkable efficiency. An earnings growth rate hitting the 30% mark would fundamentally shift the psychological backdrop. Rather than fearing a late-cycle correction or imminent economic slowdown, investors would be forced to price in an enduring expansion. Under this optimistic lens, the corporate earnings engine is capable of carrying the S&P 500 through the rest of the year on a foundation of greater dollar profits.
The S&P has gained only a few points going back to the end of April, with a whole lot of hand wringing over AI capex spending, two monster IPOs, the on-again, off-again, on-again war with Iran, supply chain bottle-necks, rising Treasury yields, central banks shifting policy to a tighter stance, and sticky inflation.
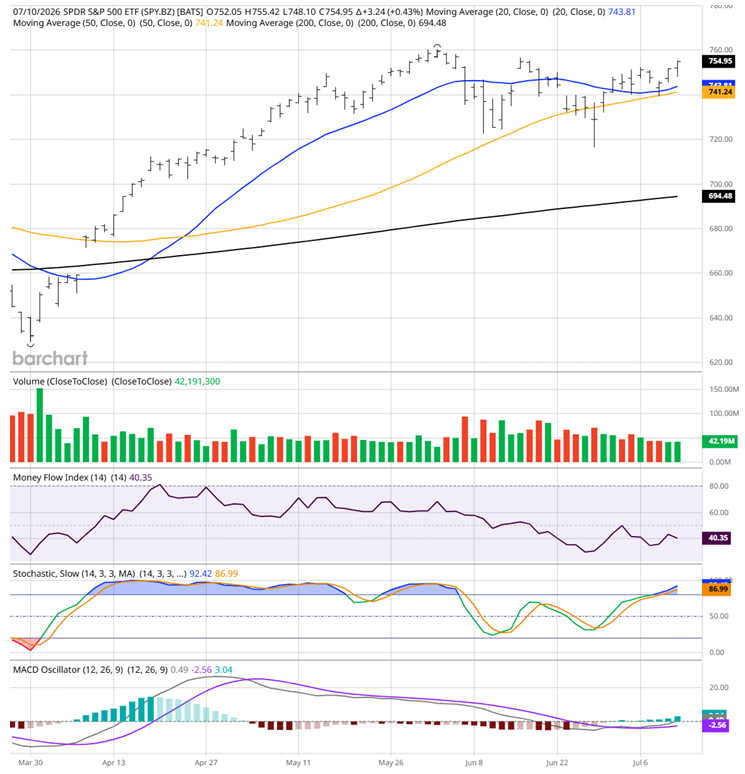
Graphs are for illustrative and discussion purposes only. Please read important disclosures at the end of this commentary.
The market has been given more than enough fodder to roll over in protest over these headwinds, but it has instead held on, like the Cinderella Man (James Braddock), taking fierce blows only to get up off the mat and deliver just the right counter punches. Such is the market set up, ready to deliver the knockout blows to bears when earnings season takes center stage, showing the world why America is unmatched in its economic potential that could ignite the S&P to take out the 8,000 like a hot knife through butter.

Let’s Get Ready to Rumble!
Navellier & Associates; do not own SK Hynix ADR (SKHYV) or Space Exploration Technology Corp (SPCX) in managed accounts. Bryan Perry owns Space Exploration Technology Corp (SPCX) and he does not own SK Hynix ADR (SKHYV) personally.
All content above represents the opinion of Bryan Perry of Navellier & Associates, Inc.
Also In This Issue
A Look Ahead by Louis Navellier
America’s 250th Birthday Celebrates America’s Leadership
Income Mail by Bryan Perry
Q2 Earnings Season May Deliver a Major Market Tailwind
Growth Mail by Gary Alexander
Report from America’s Big Birthday Bash in Vegas
Global Mail by Ivan Martchev
What is Planet Earth Worth?
Sector Spotlight by Jason Bodner
Is the Stock Market “Cavitating” On Us?
View Full Archive
Read Past Issues Here

Bryan Perry
SENIOR DIRECTOR
Bryan Perry is a Senior Director with Navellier Private Client Group, advising and facilitating high net worth investors in the pursuit of their financial goals.
Bryan’s financial services career spanning the past three decades includes over 20-years of wealth management experience with Wall Street firms that include Bear Stearns, Lehman Brothers and Paine Webber, working with both retail and institutional clients. Bryan earned a B.A. in Political Science from Virginia Polytechnic Institute & State University and currently holds a Series 65 license. All content of “Income Mail” represents the opinion of Bryan Perry
Important Disclosures:
Although information in these reports has been obtained from and is based upon sources that Navellier believes to be reliable, Navellier does not guarantee its accuracy and it may be incomplete or condensed. All opinions and estimates constitute Navellier’s judgment as of the date the report was created and are subject to change without notice. These reports are for informational purposes only and are not a solicitation for the purchase or sale of a security. Any decision to purchase securities mentioned in these reports must take into account existing public information on such securities or any registered prospectus.To the extent permitted by law, neither Navellier & Associates, Inc., nor any of its affiliates, agents, or service providers assumes any liability or responsibility nor owes any duty of care for any consequences of any person acting or refraining to act in reliance on the information contained in this communication or for any decision based on it.
Past performance is no indication of future results. Investment in securities involves significant risk and has the potential for partial or complete loss of funds invested. It should not be assumed that any securities recommendations made by Navellier. in the future will be profitable or equal the performance of securities made in this report. Dividend payments are not guaranteed. The amount of a dividend payment, if any, can vary over time and issuers may reduce dividends paid on securities in the event of a recession or adverse event affecting a specific industry or issuer.
None of the stock information, data, and company information presented herein constitutes a recommendation by Navellier or a solicitation to buy or sell any securities. Any specific securities identified and described do not represent all of the securities purchased, sold, or recommended for advisory clients. The holdings identified do not represent all of the securities purchased, sold, or recommended for advisory clients and the reader should not assume that investments in the securities identified and discussed were or will be profitable.
Information presented is general information that does not take into account your individual circumstances, financial situation, or needs, nor does it present a personalized recommendation to you. Individual stocks presented may not be suitable for every investor. Investment in securities involves significant risk and has the potential for partial or complete loss of funds invested. Investment in fixed income securities has the potential for the investment return and principal value of an investment to fluctuate so that an investor’s holdings, when redeemed, may be worth less than their original cost.
One cannot invest directly in an index. Index is unmanaged and index performance does not reflect deduction of fees, expenses, or taxes. Presentation of Index data does not reflect a belief by Navellier that any stock index constitutes an investment alternative to any Navellier equity strategy or is necessarily comparable to such strategies. Among the most important differences between the Indices and Navellier strategies are that the Navellier equity strategies may (1) incur material management fees, (2) concentrate its investments in relatively few stocks, industries, or sectors, (3) have significantly greater trading activity and related costs, and (4) be significantly more or less volatile than the Indices.
ETF Risk: We may invest in exchange traded funds (“ETFs”) and some of our investment strategies are generally fully invested in ETFs. Like traditional mutual funds, ETFs charge asset-based fees, but they generally do not charge initial sales charges or redemption fees and investors typically pay only customary brokerage fees to buy and sell ETF shares. The fees and costs charged by ETFs held in client accounts will not be deducted from the compensation the client pays Navellier. ETF prices can fluctuate up or down, and a client account could lose money investing in an ETF if the prices of the securities owned by the ETF go down. ETFs are subject to additional risks:
- ETF shares may trade above or below their net asset value;
- An active trading market for an ETF’s shares may not develop or be maintained;
- The value of an ETF may be more volatile than the underlying portfolio of securities the ETF is designed to track;
- The cost of owning shares of the ETF may exceed those a client would incur by directly investing in the underlying securities; and
- Trading of an ETF’s shares may be halted if the listing exchange’s officials deem it appropriate, the shares are delisted from the exchange, or the activation of market-wide “circuit breakers” (which are tied to large decreases in stock prices) halts stock trading generally.
Grader Disclosures: Investment in equity strategies involves substantial risk and has the potential for partial or complete loss of funds invested. The sample portfolio and any accompanying charts are for informational purposes only and are not to be construed as a solicitation to buy or sell any financial instrument and should not be relied upon as the sole factor in an investment making decision. As a matter of normal and important disclosures to you, as a potential investor, please consider the following: The performance presented is not based on any actual securities trading, portfolio, or accounts, and the reported performance of the A, B, C, D, and F portfolios (collectively the “model portfolios”) should be considered mere “paper” or pro forma performance results based on Navellier’s research.
Investors evaluating any of Navellier & Associates, Inc.’s, (or its affiliates’) Investment Products must not use any information presented here, including the performance figures of the model portfolios, in their evaluation of any Navellier Investment Products. Navellier Investment Products include the firm’s mutual funds and managed accounts. The model portfolios, charts, and other information presented do not represent actual funded trades and are not actual funded portfolios. There are material differences between Navellier Investment Products’ portfolios and the model portfolios, research, and performance figures presented here. The model portfolios and the research results (1) may contain stocks or ETFs that are illiquid and difficult to trade; (2) may contain stock or ETF holdings materially different from actual funded Navellier Investment Product portfolios; (3) include the reinvestment of all dividends and other earnings, estimated trading costs, commissions, or management fees; and, (4) may not reflect prices obtained in an actual funded Navellier Investment Product portfolio. For these and other reasons, the reported performances of model portfolios do not reflect the performance results of Navellier’s actually funded and traded Investment Products. In most cases, Navellier’s Investment Products have materially lower performance results than the performances of the model portfolios presented.
This report contains statements that are, or may be considered to be, forward-looking statements. All statements that are not historical facts, including statements about our beliefs or expectations, are “forward-looking statements” within the meaning of The U.S. Private Securities Litigation Reform Act of 1995. These statements may be identified by such forward-looking terminology as “expect,” “estimate,” “plan,” “intend,” “believe,” “anticipate,” “may,” “will,” “should,” “could,” “continue,” “project,” or similar statements or variations of such terms. Our forward-looking statements are based on a series of expectations, assumptions, and projections, are not guarantees of future results or performance, and involve substantial risks and uncertainty as described in Form ADV Part 2A of our filing with the Securities and Exchange Commission (SEC), which is available at www.adviserinfo.sec.gov or by requesting a copy by emailing info@navellier.com. All of our forward-looking statements are as of the date of this report only. We can give no assurance that such expectations or forward-looking statements will prove to be correct. Actual results may differ materially. You are urged to carefully consider all such factors.
FEDERAL TAX ADVICE DISCLAIMER: As required by U.S. Treasury Regulations, you are informed that, to the extent this presentation includes any federal tax advice, the presentation is not written by Navellier to be used, and cannot be used, for the purpose of avoiding federal tax penalties. Navellier does not advise on any income tax requirements or issues. Use of any information presented by Navellier is for general information only and does not represent tax advice either express or implied. You are encouraged to seek professional tax advice for income tax questions and assistance.
IMPORTANT NEWSLETTER DISCLOSURE:The hypothetical performance results for investment newsletters that are authored or edited by Louis Navellier, including Louis Navellier’s Growth Investor, Louis Navellier’s Breakthrough Stocks, Louis Navellier’s Accelerated Profits, and Louis Navellier’s Platinum Club, are not based on any actual securities trading, portfolio, or accounts, and the newsletters’ reported hypothetical performances should be considered mere “paper” or proforma hypothetical performance results and are not actual performance of real world trades. Navellier & Associates, Inc. does not have any relation to or affiliation with the owner of these newsletters. There are material differences between Navellier Investment Products’ portfolios and the InvestorPlace Media, LLC newsletter portfolios authored by Louis Navellier. The InvestorPlace Media, LLC newsletters contain hypothetical performance that do not include transaction costs, advisory fees, or other fees a client might incur if actual investments and trades were being made by an investor. As a result, newsletter performance should not be used to evaluate Navellier Investment services which are separate and different from the newsletters. The owner of the newsletters is InvestorPlace Media, LLC and any questions concerning the newsletters, including any newsletter advertising or hypothetical Newsletter performance claims, (which are calculated solely by Investor Place Media and not Navellier) should be referred to InvestorPlace Media, LLC at (800) 718-8289.
Please note that Navellier & Associates and the Navellier Private Client Group are managed completely independent of the newsletters owned and published by InvestorPlace Media, LLC and written and edited by Louis Navellier, and investment performance of the newsletters should in no way be considered indicative of potential future investment performance for any Navellier & Associates separately managed account portfolio. Potential investors should consult with their financial advisor before investing in any Navellier Investment Product.
Navellier claims compliance with Global Investment Performance Standards (GIPS). To receive a complete list and descriptions of Navellier’s composites and/or a presentation that adheres to the GIPS standards, please contact Navellier or click here. It should not be assumed that any securities recommendations made by Navellier & Associates, Inc. in the future will be profitable or equal the performance of securities made in this report.
FactSet Disclosure: Navellier does not independently calculate the statistical information included in the attached report. The calculation and the information are provided by FactSet, a company not related to Navellier. Although information contained in the report has been obtained from FactSet and is based on sources Navellier believes to be reliable, Navellier does not guarantee its accuracy, and it may be incomplete or condensed. The report and the related FactSet sourced information are provided on an “as is” basis. The user assumes the entire risk of any use made of this information. Investors should consider the report as only a single factor in making their investment decision. The report is for informational purposes only and is not intended as an offer or solicitation for the purchase or sale of a security. FactSet sourced information is the exclusive property of FactSet. Without prior written permission of FactSet, this information may not be reproduced, disseminated or used to create any financial products. All indices are unmanaged and performance of the indices include reinvestment of dividends and interest income, unless otherwise noted, are not illustrative of any particular investment and an investment cannot be made in any index. Past performance is no guarantee of future results.