by Gary Alexander
May 29, 2024
Memorial Day was first observed on May 30, 1868, as Decoration Day, to honor 620,000 lost Civil War soldiers who died in battle or in related war infections. Since 31 million Americans were counted in the 1860 Census, that’s a 2% death rate, equivalent to 6.6 million lost, if war broke out today. For 103 years, Memorial Day was observed on May 30. Since 1971, we honor our fallen on the fourth Monday in May.
In these columns, I ask readers to remember history in several other ways, in many arenas, most notably via stock market and economic history, for the purpose of demonstrating that we are a resilient nation. We have faced far worse crises in the past and have always recovered. To create more vivid snapshots in time, I often examine time capsules from 50 or 100 years ago. This week, I’ll look at the summers of 1974 and 1924 as notably dark times in America, but with the seeds of phenomenal recoveries planted very quietly.
1974: A President Resigns, A Market Tanks, But Seeds of Future Fortunes are Sown
The Vietnam War was about to end in an ignominious defeat. President Nixon was on his last legs, about to resign over his Watergate cover-up. The stock market was in a free-fall, as was the U.S. dollar – to gold and most paper currencies. The Dow Jones Index declined 45% from the start of 1973 to the end of 1974, but the other indexes fell faster, particularly in the third quarter of 1974. The new NASDAQ Composite fell from 136.84 in January 1973 (and 95 in March 1974) to 55.67 on September 30, 1974, a 59% haircut in 21 months and -42% in just six months. The S&P 500 lost 26% in the third quarter of 1974 alone.
The economy was cratering. Auto sales were off 20%, housing starts were down 40% and unemployment hit 7.2% by year’s end. Inflation reached double digits for the second straight year, creating a new word: Stagflation. The S&P 500 took a particularly steep stumble (-8.7%) the week after new President Gerald Ford pardoned ex-President Nixon on Sunday, September 8, 1974, of any crimes he may have committed in office, but very quietly that previous week the seeds were sown of a huge generational stock market boom, fueling the biggest bull market of the century, giving Baby Boomers a golden birthright bonanza.
The Employee Retirement Income Security Act of 1974 (ERISA) was enacted on Monday, September 2, 1974. It created the traditional Individual Retirement Accounts (IRAs) that allowed for a self-directed alternative to the dead-end Ponzi scheme called Social Security, in which one person’s forced payroll deductions were (still are) immediately mailed out to someone else, rather than invested in one’s name.
The next year, on May 1, 1975, the Securities & Exchange Commission (SEC) broke up the Big Broker cartel by mandating that brokerages must negotiate commissions with customers rather than charge fixed (top 8.5%) commissions, in what amounted to a price-fixing ring. This gave birth to a discount broker revolution, a big boon to small investors, just after ERISA, when they could manage their own pensions.
Later, with the Revenue Act of November 6, 1978, IRS code section 401(k) added additional tax benefits for self-directed accounts. Then President Reagan was elected, and his zealots passed the Economic Recovery Act of 1981, giving tax benefits to IRAs and Keoghs just before the bull market of 1982 began.

As a result of these legal reforms and a 40-year bull market (with notable disruptions from 2001 to 2008), Baby Boomer-led households’ collective net worth skyrocketed 19-fold since 1990, according to Ed Yardeni. Following the advice of one of the Boomers’ generational heroes, Star Trek’s Spock (“live long and prosper”), this once-rebellious hippie generation has sort of accidentally lived long and prospered.
Ed Yardeni wrote last week that “During the Boomers’ adult lifetimes so far, the Dow Jones Industrials Average (DJIA) increased 40-fold from 1000 in late 1982 to just over 40,000 on Friday. The S&P 500 matched that gain, with its market capitalization rising from $1 trillion in 1982 to over $40 trillion”:
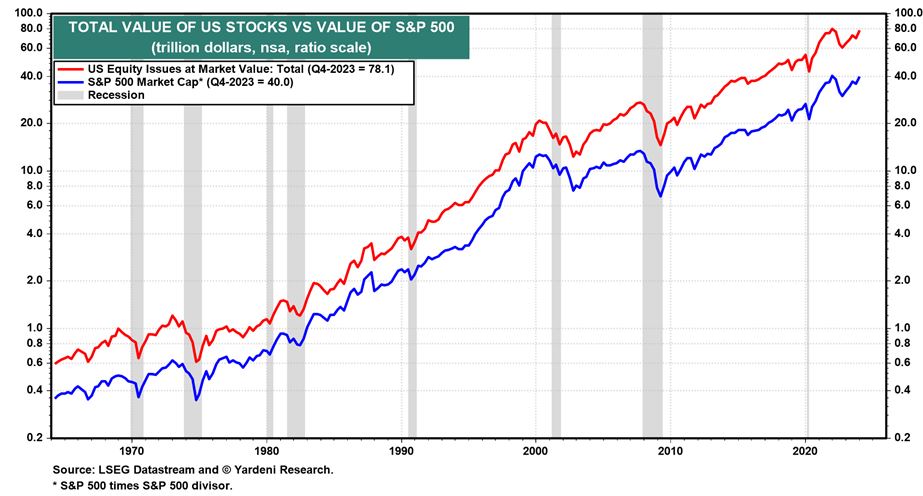
Graphs are for illustrative and discussion purposes only. Please read important disclosures at the end of this commentary.
In addition, says Yardeni, these Boomers have enjoyed a 40-year super-boom of wealth creation:
- “Since late 1982, nominal GDP is up more than eight-fold.
- “Real personal consumption expenditures per household rose from about $55,000 in 1982 to $119,800 at the start of this year. By this measure, the standard of living doubled over those four decades.
- “Real average hourly earnings rose more than 40% since bottoming in the mid-1990s from about $17 per hour to $24 for production and non-supervisory workers, who account for about 80% of the labor force.
- “Since 1982, after-tax corporate profits increased 14-fold.
- “S&P 500 reported earnings per share is also up 14-fold over this period.
- “The net worth of Baby Boomer-led households has increased 19-fold from $4.1 trillion at the start of the data (compiled by the Fed starting in 1990) to $76.2 trillion during Q4-2023.’
As a result of this litany of blessings, the value of corporate equities and mutual funds (excluding money market mutual funds) held by Baby Boomers has risen from $0.3 trillion to $21.6 trillion over this period, which dwarfs their real estate gain, which barely tripled, from $4.6 trillion in 1990 to $16.0 trillion now.
They’ve lived long and prospered, compared to other cohorts, as the following blue line shows:
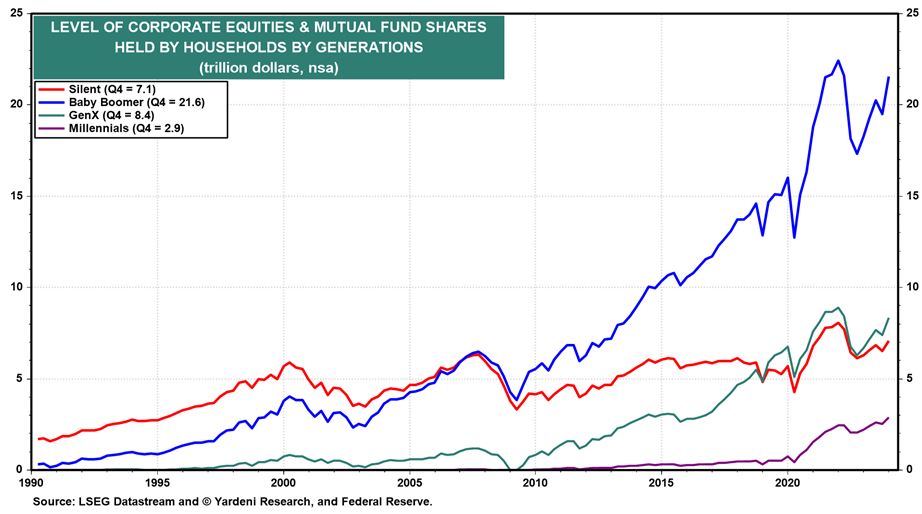
Graphs are for illustrative and discussion purposes only. Please read important disclosures at the end of this commentary.
It’s refreshing to see the Gen-Xers and Millennials catching on, too, but as a late member of the Silent Generation (the relatively flat red line, above), I’m a bit chagrined at our under-achievement. I turned bullish on stocks late in life, in 1990, but am thankful for wising up in time for the market’s biggest moves. In talking with several Baby Boomers (born 1946 to 1964), I can generalize that this late-life wealth seems to have taken some by surprise. They invested in IRAs as part of their corporate benefits package, then partook in their company’s matching 401(k) plan and suddenly found themselves sitting on half a million (or more) bucks, plus their home, so they’re happily set for a comfortable retirement.
It’s all thanks to that ERISA law, born in the summer of 1974 amid the tornado of dark news surrounding Nixon’s resignation, Ford’s pardon, high inflation, a deep recession, a weak dollar, soaring gold and WIN buttons. (On September 28, 1974. President Ford concluded an emergency two-day summit on how to fix inflation and recession. His answer was to wear “WIN” buttons: Whip Inflation Now. It didn’t work: From September 20 to October 4 1974, the Dow fell 13%, but that was the market bottom for the decade).
1924: The Roaring ‘20s Began Amid Scandals and Scares
I’ve covered 1924 before*, so I’ll be brief, and I’ll cover a new angle this time. The Roaring ‘20s didn’t begin in 1920. That was a year of a market crash at the tail end of a global pandemic, plus a Red Scare, an absentee President (Woodrow Wilson had a stroke in 1919, and his wife Edith was de facto President). The next president, Warren Harding, was ineffective and scandal-ridden, but when he died in August of 1923, his VP, Cal Coolidge, launched six years of prosperity with his honesty and pro-business policies.
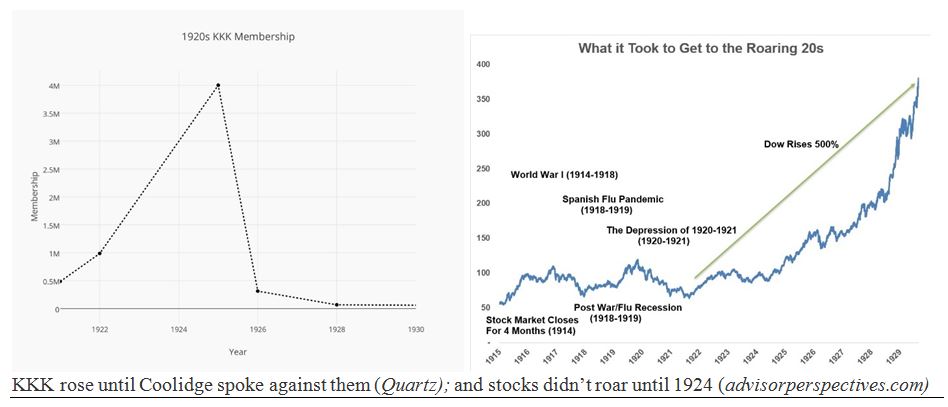
Graphs are for illustrative and discussion purposes only. Please read important disclosures at the end of this commentary.
Going into mid-1924, Coolidge faced deep challenges. Congress passed the Johnson-Reed Act on May 26, establishing far more severe immigration quotas, championed in part by a record high (four million) KKK membership. In June, the Teapot Dome scandal reached a boiling point, as a federal grand jury indicted Secretary of the Interior Albert Fall and two major oil company executives on June 30. Far from covering up the scandal, President Coolidge wasn’t silent, condemning all three to purgatory. As a result of his reputation for honesty and incorruptibility, Silent Cal won every North and Western state but one.

This history applies to our current election year if you prefer Cal’s pro-business, lower tax policies. Even if this scenario doesn’t seem possible when surveying the likely presidential choices, all 435 members of Congress and 33 Senators are also running for office, and a principled Congress can make a difference.
*Here are some other relevant past columns about 1924, if you want to review some other 1920s parallels:
7-4-23: Happy Birthday, America – and Calvin Coolidge – Navellier
1-3-24: It’s Decision Time: Roaring ‘20s or Stagnant ‘70s? – Navellier
4-16-24: How to Create a Roaring (2nd Half of the) Twenties – Navellier
All content above represents the opinion of Gary Alexander of Navellier & Associates, Inc.
Also In This Issue
A Look Ahead by Louis Navellier
Why June Could Bring a Return of $90 to $100 Crude Oil Prices
Income Mail by Bryan Perry
How to Add Premium Income from Selling Covered-Calls in Big Cap AI Stocks
Growth Mail by Gary Alexander
Remembering Our Dark Summers 50 and 100 Years Ago
Global Mail by Ivan Martchev
The Stock Market is Channeling Yogi Berra
Sector Spotlight by Jason Bodner
Don’t Worry: Be Healthy, Happy (and Richer)
View Full Archive
Read Past Issues Here
About The Author

Gary Alexander
SENIOR EDITOR
Gary Alexander has been Senior Writer at Navellier since 2009. He edits Navellier’s weekly Marketmail and writes a weekly Growth Mail column, in which he uses market history to support the case for growth stocks. For the previous 20 years before joining Navellier, he was Senior Executive Editor at InvestorPlace Media (formerly Phillips Publishing), where he worked with several leading investment analysts, including Louis Navellier (since 1997), helping launch Louis Navellier’s Blue Chip Growth and Global Growth newsletters.
Prior to that, Gary edited Wealth Magazine and Gold Newsletter and wrote various investment research reports for Jefferson Financial in New Orleans in the 1980s. He began his financial newsletter career with KCI Communications in 1980, where he served as consulting editor for Personal Finance newsletter while serving as general manager of KCI’s Alexandria House book division. Before that, he covered the economics beat for news magazines. All content of “Growth Mail” represents the opinion of Gary Alexander
Important Disclosures:
Although information in these reports has been obtained from and is based upon sources that Navellier believes to be reliable, Navellier does not guarantee its accuracy and it may be incomplete or condensed. All opinions and estimates constitute Navellier’s judgment as of the date the report was created and are subject to change without notice. These reports are for informational purposes only and are not a solicitation for the purchase or sale of a security. Any decision to purchase securities mentioned in these reports must take into account existing public information on such securities or any registered prospectus.To the extent permitted by law, neither Navellier & Associates, Inc., nor any of its affiliates, agents, or service providers assumes any liability or responsibility nor owes any duty of care for any consequences of any person acting or refraining to act in reliance on the information contained in this communication or for any decision based on it.
Past performance is no indication of future results. Investment in securities involves significant risk and has the potential for partial or complete loss of funds invested. It should not be assumed that any securities recommendations made by Navellier. in the future will be profitable or equal the performance of securities made in this report. Dividend payments are not guaranteed. The amount of a dividend payment, if any, can vary over time and issuers may reduce dividends paid on securities in the event of a recession or adverse event affecting a specific industry or issuer.
None of the stock information, data, and company information presented herein constitutes a recommendation by Navellier or a solicitation to buy or sell any securities. Any specific securities identified and described do not represent all of the securities purchased, sold, or recommended for advisory clients. The holdings identified do not represent all of the securities purchased, sold, or recommended for advisory clients and the reader should not assume that investments in the securities identified and discussed were or will be profitable.
Information presented is general information that does not take into account your individual circumstances, financial situation, or needs, nor does it present a personalized recommendation to you. Individual stocks presented may not be suitable for every investor. Investment in securities involves significant risk and has the potential for partial or complete loss of funds invested. Investment in fixed income securities has the potential for the investment return and principal value of an investment to fluctuate so that an investor’s holdings, when redeemed, may be worth less than their original cost.
One cannot invest directly in an index. Index is unmanaged and index performance does not reflect deduction of fees, expenses, or taxes. Presentation of Index data does not reflect a belief by Navellier that any stock index constitutes an investment alternative to any Navellier equity strategy or is necessarily comparable to such strategies. Among the most important differences between the Indices and Navellier strategies are that the Navellier equity strategies may (1) incur material management fees, (2) concentrate its investments in relatively few stocks, industries, or sectors, (3) have significantly greater trading activity and related costs, and (4) be significantly more or less volatile than the Indices.
ETF Risk: We may invest in exchange traded funds (“ETFs”) and some of our investment strategies are generally fully invested in ETFs. Like traditional mutual funds, ETFs charge asset-based fees, but they generally do not charge initial sales charges or redemption fees and investors typically pay only customary brokerage fees to buy and sell ETF shares. The fees and costs charged by ETFs held in client accounts will not be deducted from the compensation the client pays Navellier. ETF prices can fluctuate up or down, and a client account could lose money investing in an ETF if the prices of the securities owned by the ETF go down. ETFs are subject to additional risks:
- ETF shares may trade above or below their net asset value;
- An active trading market for an ETF’s shares may not develop or be maintained;
- The value of an ETF may be more volatile than the underlying portfolio of securities the ETF is designed to track;
- The cost of owning shares of the ETF may exceed those a client would incur by directly investing in the underlying securities; and
- Trading of an ETF’s shares may be halted if the listing exchange’s officials deem it appropriate, the shares are delisted from the exchange, or the activation of market-wide “circuit breakers” (which are tied to large decreases in stock prices) halts stock trading generally.
Grader Disclosures: Investment in equity strategies involves substantial risk and has the potential for partial or complete loss of funds invested. The sample portfolio and any accompanying charts are for informational purposes only and are not to be construed as a solicitation to buy or sell any financial instrument and should not be relied upon as the sole factor in an investment making decision. As a matter of normal and important disclosures to you, as a potential investor, please consider the following: The performance presented is not based on any actual securities trading, portfolio, or accounts, and the reported performance of the A, B, C, D, and F portfolios (collectively the “model portfolios”) should be considered mere “paper” or pro forma performance results based on Navellier’s research.
Investors evaluating any of Navellier & Associates, Inc.’s, (or its affiliates’) Investment Products must not use any information presented here, including the performance figures of the model portfolios, in their evaluation of any Navellier Investment Products. Navellier Investment Products include the firm’s mutual funds and managed accounts. The model portfolios, charts, and other information presented do not represent actual funded trades and are not actual funded portfolios. There are material differences between Navellier Investment Products’ portfolios and the model portfolios, research, and performance figures presented here. The model portfolios and the research results (1) may contain stocks or ETFs that are illiquid and difficult to trade; (2) may contain stock or ETF holdings materially different from actual funded Navellier Investment Product portfolios; (3) include the reinvestment of all dividends and other earnings, estimated trading costs, commissions, or management fees; and, (4) may not reflect prices obtained in an actual funded Navellier Investment Product portfolio. For these and other reasons, the reported performances of model portfolios do not reflect the performance results of Navellier’s actually funded and traded Investment Products. In most cases, Navellier’s Investment Products have materially lower performance results than the performances of the model portfolios presented.
This report contains statements that are, or may be considered to be, forward-looking statements. All statements that are not historical facts, including statements about our beliefs or expectations, are “forward-looking statements” within the meaning of The U.S. Private Securities Litigation Reform Act of 1995. These statements may be identified by such forward-looking terminology as “expect,” “estimate,” “plan,” “intend,” “believe,” “anticipate,” “may,” “will,” “should,” “could,” “continue,” “project,” or similar statements or variations of such terms. Our forward-looking statements are based on a series of expectations, assumptions, and projections, are not guarantees of future results or performance, and involve substantial risks and uncertainty as described in Form ADV Part 2A of our filing with the Securities and Exchange Commission (SEC), which is available at www.adviserinfo.sec.gov or by requesting a copy by emailing info@navellier.com. All of our forward-looking statements are as of the date of this report only. We can give no assurance that such expectations or forward-looking statements will prove to be correct. Actual results may differ materially. You are urged to carefully consider all such factors.
FEDERAL TAX ADVICE DISCLAIMER: As required by U.S. Treasury Regulations, you are informed that, to the extent this presentation includes any federal tax advice, the presentation is not written by Navellier to be used, and cannot be used, for the purpose of avoiding federal tax penalties. Navellier does not advise on any income tax requirements or issues. Use of any information presented by Navellier is for general information only and does not represent tax advice either express or implied. You are encouraged to seek professional tax advice for income tax questions and assistance.
IMPORTANT NEWSLETTER DISCLOSURE:The hypothetical performance results for investment newsletters that are authored or edited by Louis Navellier, including Louis Navellier’s Growth Investor, Louis Navellier’s Breakthrough Stocks, Louis Navellier’s Accelerated Profits, and Louis Navellier’s Platinum Club, are not based on any actual securities trading, portfolio, or accounts, and the newsletters’ reported hypothetical performances should be considered mere “paper” or proforma hypothetical performance results and are not actual performance of real world trades. Navellier & Associates, Inc. does not have any relation to or affiliation with the owner of these newsletters. There are material differences between Navellier Investment Products’ portfolios and the InvestorPlace Media, LLC newsletter portfolios authored by Louis Navellier. The InvestorPlace Media, LLC newsletters contain hypothetical performance that do not include transaction costs, advisory fees, or other fees a client might incur if actual investments and trades were being made by an investor. As a result, newsletter performance should not be used to evaluate Navellier Investment services which are separate and different from the newsletters. The owner of the newsletters is InvestorPlace Media, LLC and any questions concerning the newsletters, including any newsletter advertising or hypothetical Newsletter performance claims, (which are calculated solely by Investor Place Media and not Navellier) should be referred to InvestorPlace Media, LLC at (800) 718-8289.
Please note that Navellier & Associates and the Navellier Private Client Group are managed completely independent of the newsletters owned and published by InvestorPlace Media, LLC and written and edited by Louis Navellier, and investment performance of the newsletters should in no way be considered indicative of potential future investment performance for any Navellier & Associates separately managed account portfolio. Potential investors should consult with their financial advisor before investing in any Navellier Investment Product.
Navellier claims compliance with Global Investment Performance Standards (GIPS). To receive a complete list and descriptions of Navellier’s composites and/or a presentation that adheres to the GIPS standards, please contact Navellier or click here. It should not be assumed that any securities recommendations made by Navellier & Associates, Inc. in the future will be profitable or equal the performance of securities made in this report.
FactSet Disclosure: Navellier does not independently calculate the statistical information included in the attached report. The calculation and the information are provided by FactSet, a company not related to Navellier. Although information contained in the report has been obtained from FactSet and is based on sources Navellier believes to be reliable, Navellier does not guarantee its accuracy, and it may be incomplete or condensed. The report and the related FactSet sourced information are provided on an “as is” basis. The user assumes the entire risk of any use made of this information. Investors should consider the report as only a single factor in making their investment decision. The report is for informational purposes only and is not intended as an offer or solicitation for the purchase or sale of a security. FactSet sourced information is the exclusive property of FactSet. Without prior written permission of FactSet, this information may not be reproduced, disseminated or used to create any financial products. All indices are unmanaged and performance of the indices include reinvestment of dividends and interest income, unless otherwise noted, are not illustrative of any particular investment and an investment cannot be made in any index. Past performance is no guarantee of future results.