by Gary Alexander
April 16, 2024
Last week, I wrote about why tax increases don’t usually raise tax receipts. This week, I’ll show how tax rate cuts always raise tax receipts, especially from the rich. This is based on the work of Art Laffer, whom I first met when I worked at USC in the late 1970s, where he was a Professor of Economics, developing the Laffer Curve and leading the fight against soaring property taxes via California’s Proposition 13.
Later, when I edited Wealth Magazine (1983-86), Laffer was working in the Reagan administration to devise a low-rate flat tax (described here last week), so I contacted him in early 1985 to write an article for us using his historical insights. In “A New Model for Growth, ” Art shared his now-obvious truths – which most politicians ignore – that “People don’t work just because jobs are available. They work to be paid, and paid after tax at that.” He said the new bi-partisan tax bill “led by Democrats such as Sen. Bill Bradley has produced a veritable ground swell for a flatter tax. The Reagan Administration and the 1980s will be seen in retrospect as a turning point for the U.S. economy when the new model comes to fruition.”
In retrospect, he was right. The two Reagan tax cuts delivered the biggest economic and stock market boom of the century, and in the Reagan years (1981 to 1988), tax revenues collected from the richest 1% grew in real terms by a massive 146%. The economic expansion of 1982-2000 delivered real GDP growth of 3.8% per year, supercharged with 14% GDP growth in the first two combined boom years, 1983-84.
There was only one brief, shallow recession in 18 years, and the Dow rose from 776 to 11,723 (15-fold in 17.5 years), with inflation averaging 2% for nearly 40 years and balanced budgets, 1998-2001, following a decade of near-zero real growth due to stagflation (inflation and recession) with bracket-creep in taxes.
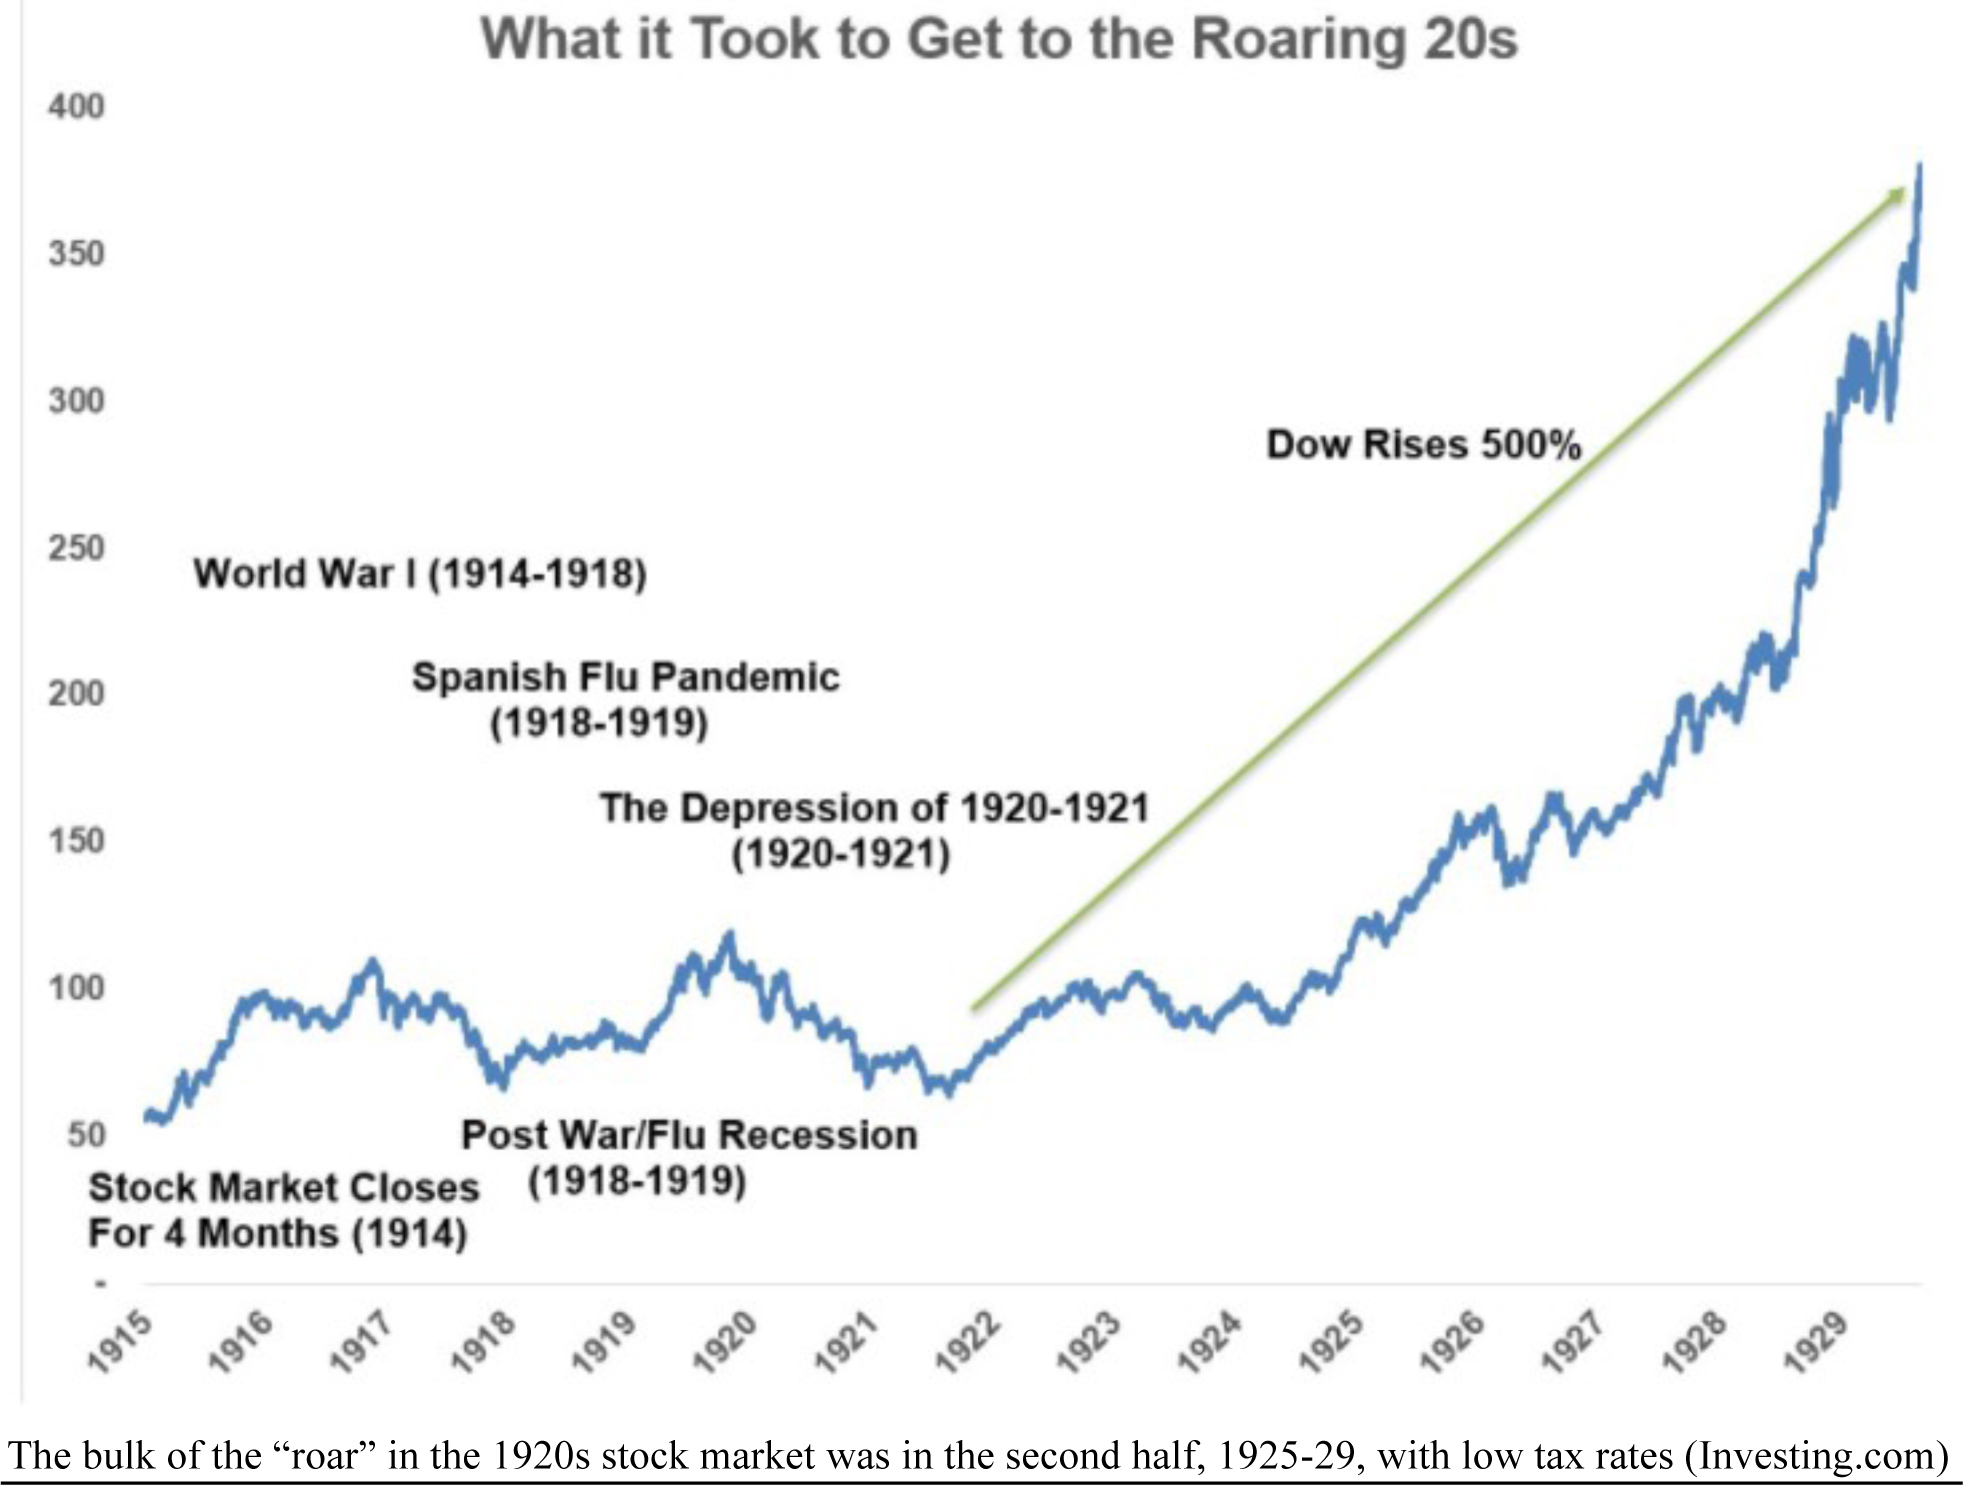
However, that wasn’t the only multi-year miracle boom of the last century. In the interest of creating a new Roaring 20s, let me focus on a decade of 500% stock gains, rising GDP and 10 balanced budgets.
In the First Roaring 20s, Cal Coolidge and Andrew Mellon Created Economic Nirvana
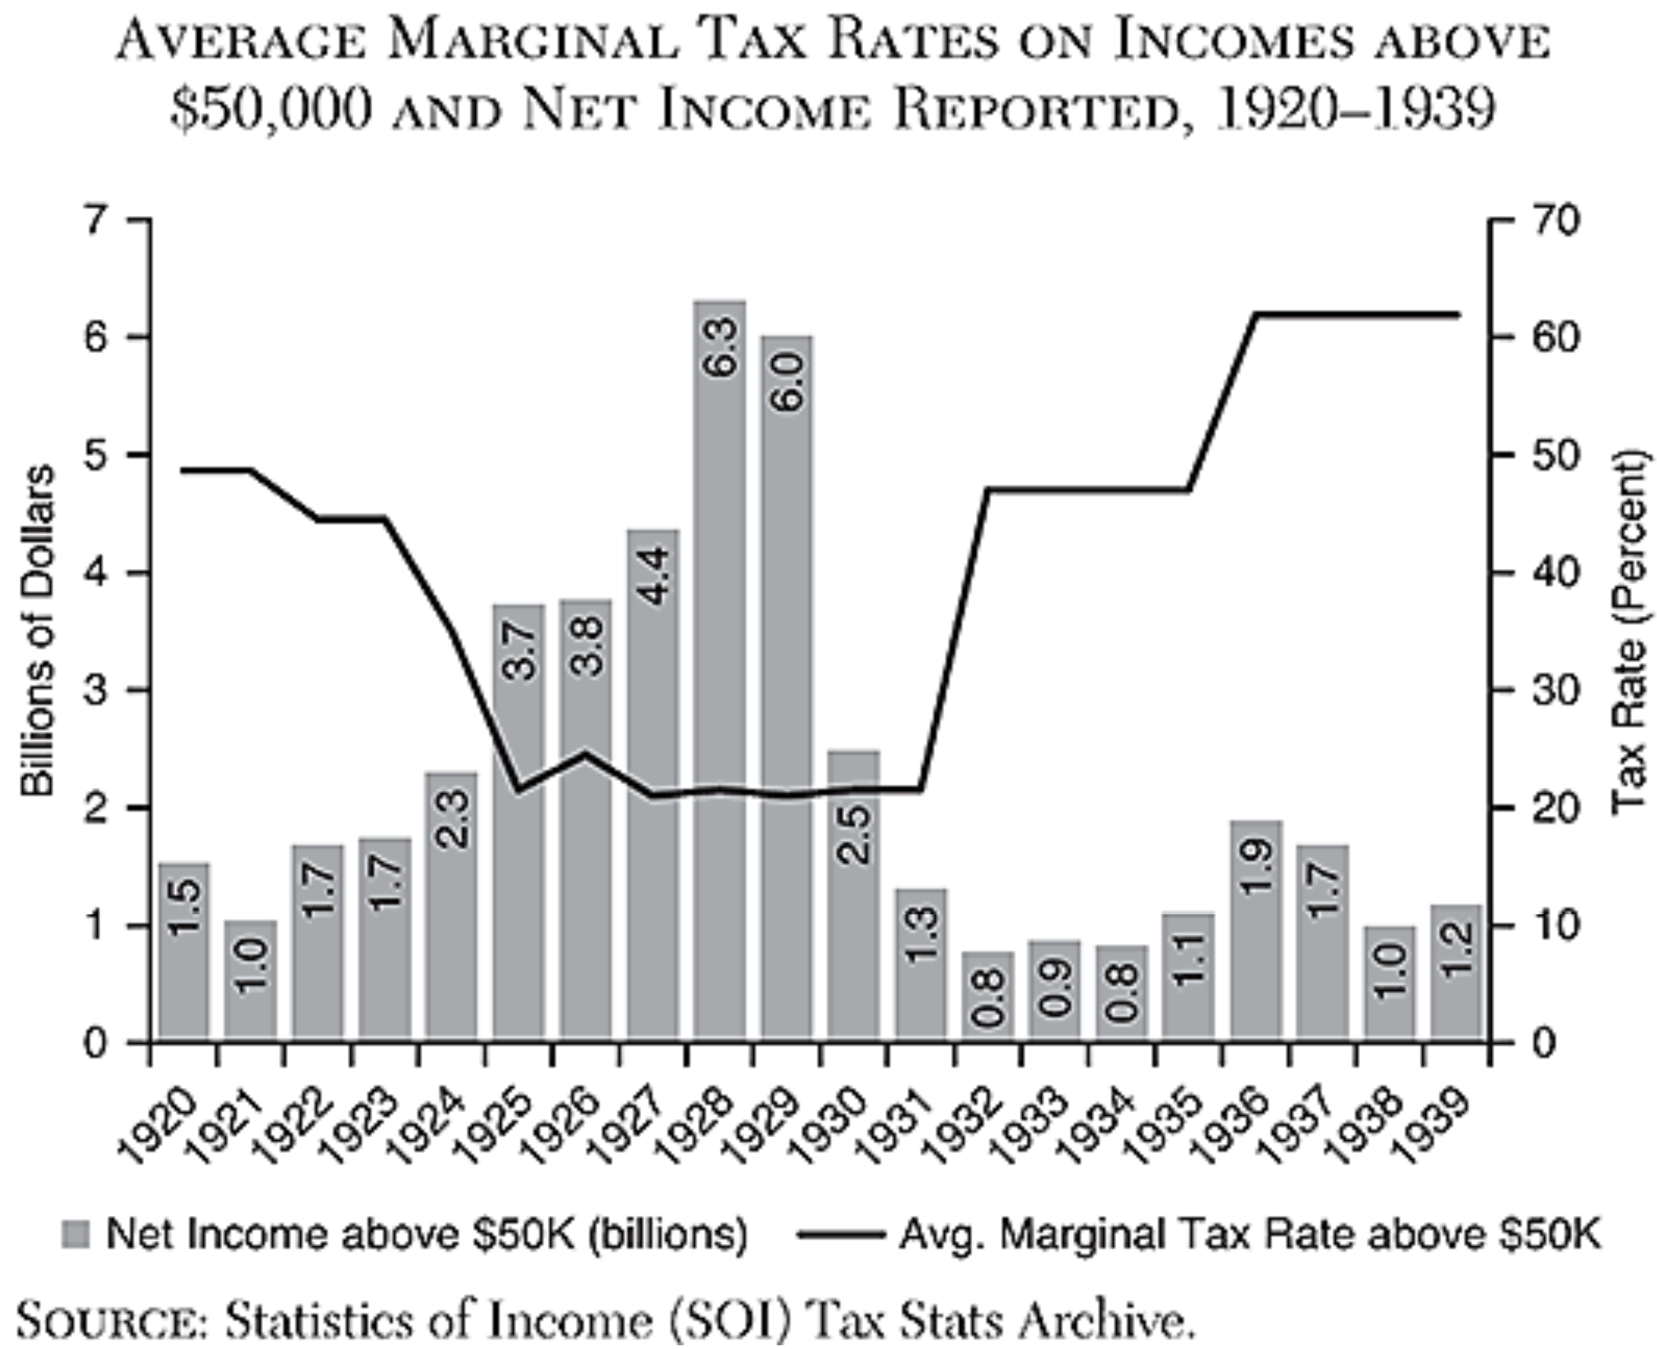
In the 1920s, the federal budget ran a surplus for 11 years, even as the government faced its largest debt-service obligations in 50 years, due to World War I. Even as the top tax rate declined sharply, from 73% to 25%, taxes paid by the rich soared, as did stocks and the GDP. Like these 20s, the decade began with a pandemic and a short recession. Unlike this decade, it was deflationary, and politicians cut spending.
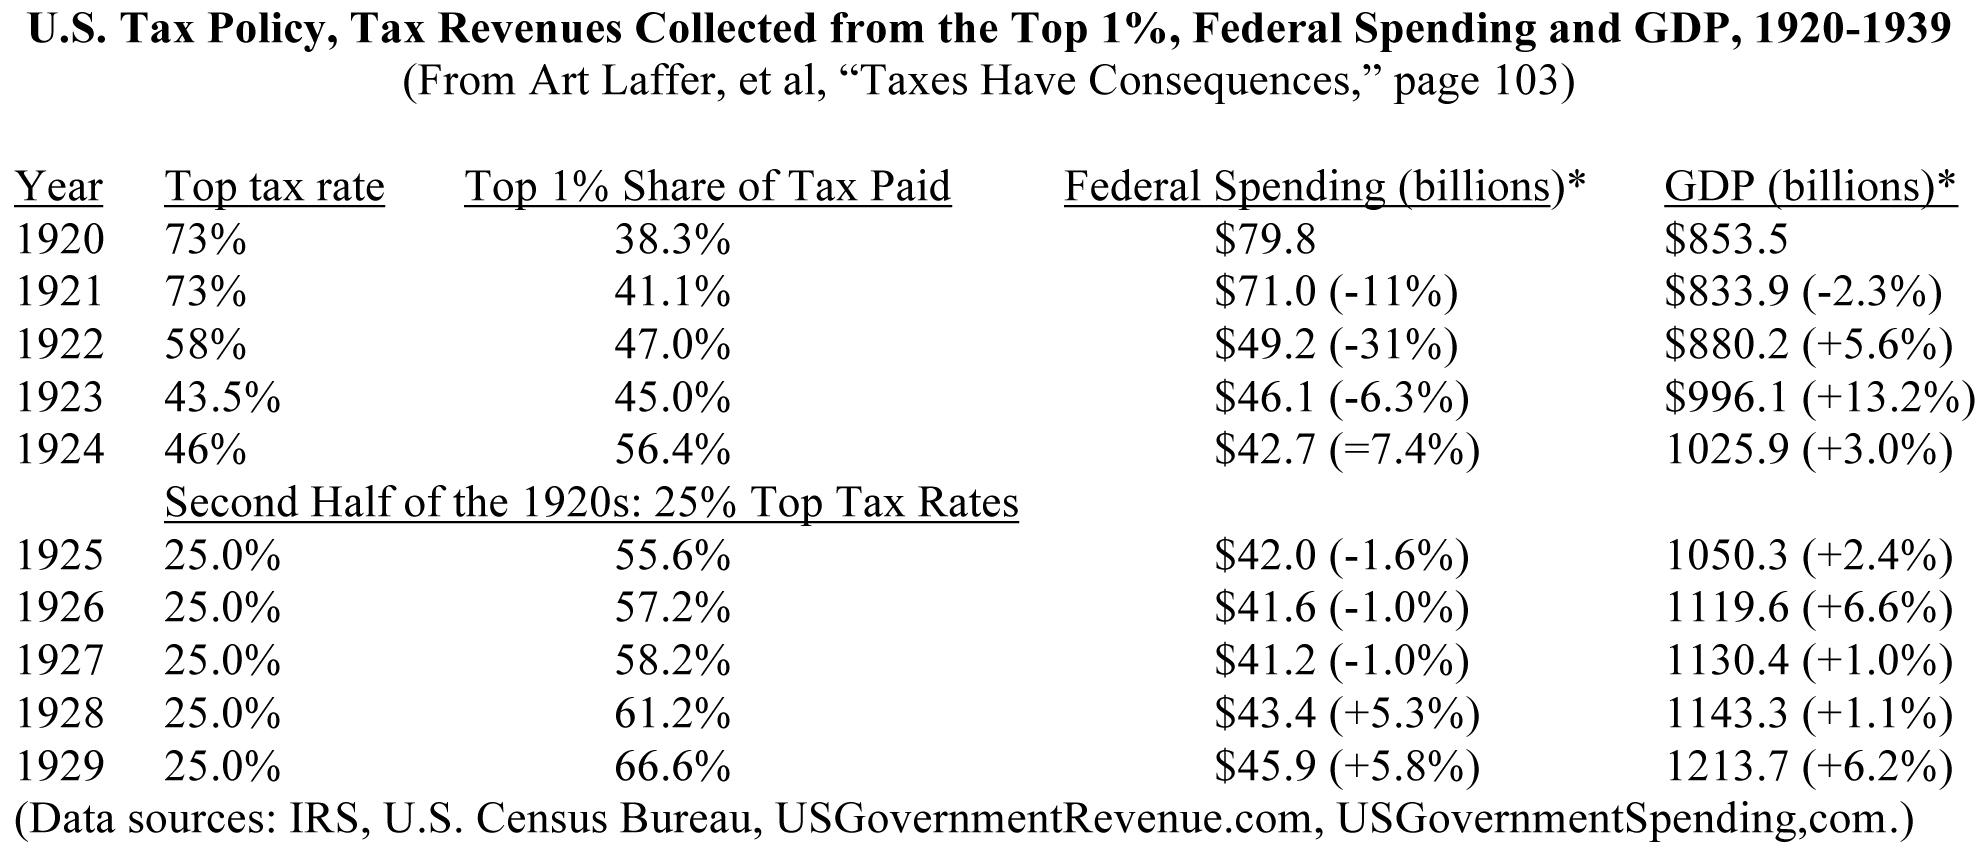
From this table, notice these key trends for creating a model for growth for the second half of the 20s:
- The top tax rate declined from 73% at the start of the decade to just 25% in the second half of the 20s.
- The top 1% of taxpayers were responsible for paying more revenues each year, up to two-thirds in 1929.
- *Federal spending (in billions of 2018 dollars) declined each year until the start of the Hoover era.
- **GDP (measured in billions of 2018 dollars) grew each year in the 20s, after the flash 1920-21 recession.
Graphs are for illustrative and discussion purposes only. Please read important disclosures at the end of this commentary.
None of these policies were responsible for the Great Depression, as numerous books can prove*. It was Herbert Hoover, not FDR, who passed the sky-high Smoot-Hawley tariffs in 1930 and raised taxes to sky-high levels in 1932. In fact, the top tax rate was never below 63% for 48 years, from 1932 to 1980.
*See “A Monetary History of the United States” by Milton Friedman and Anna Schwartz, “America’s Great Depression” by Murray Rothbard, and “Taxes Have Consequences,” by Art Laffer, et al)
Graphs are for illustrative and discussion purposes only. Please read important disclosures at the end of this commentary.
This master plan for prosperity (mostly credited to Treasury Secretary Andrew Mellon) was repeated by the Democrats in the 1960s, when President Kennedy said, in December 1962, that he was about to send a comprehensive tax cut package to Congress. Speaking before the Economic Club of New York, he said,
“An economy hampered by restrictive tax rates will never produce enough revenue to balance our budget, just as it will never produce enough profits. Surely the lesson of the last decade is that budget deficits are not caused by wild-eyed spenders but by slow economic growth and periodic recessions.”
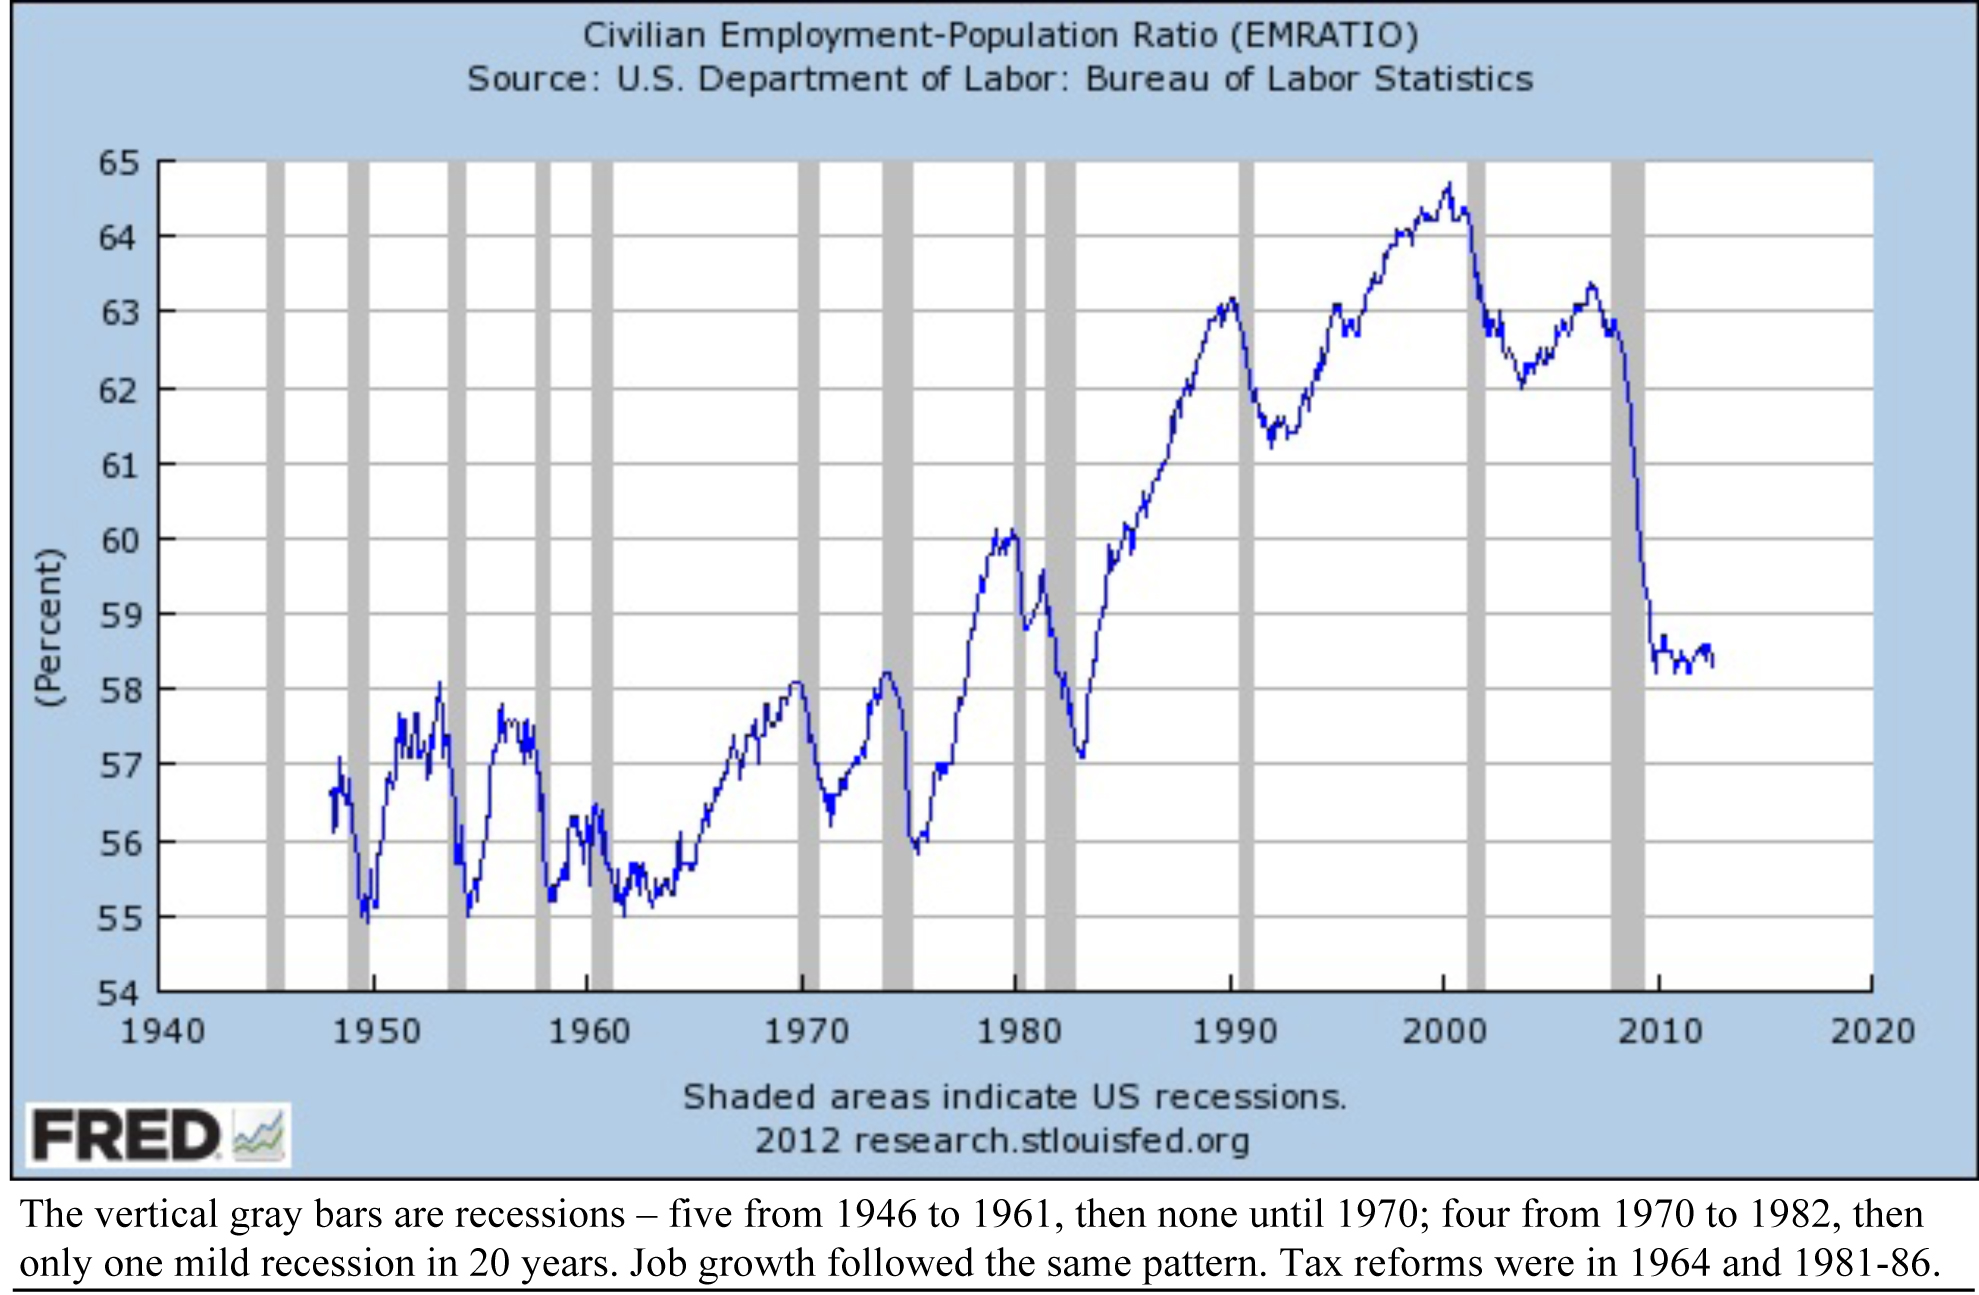
Sure enough, the 1950s were a time of frequent recessions, but there were no recessions from 1961 to 1970 after JFK and LBJ cut the top tax rate from a punitive 91% down to 70%. This action more than tripled the “take home pay” of the rich (30% vs. 9%). This same pattern yin-yang repeated in the next 20 years when staglationary-recessions in the 1970s were followed by an 18-year period of only one mild recession following the Reagan-era tax cuts of the 1980s, which cut the top tax rate from 70% to 28%.
Graphs are for illustrative and discussion purposes only. Please read important disclosures at the end of this commentary.
Bringing this story up to the present, America had a slow growth 16-year malaise to start this century, and we never enjoyed a standard recovery from the 2008 Great Recession. Art Laffer writes, “As of 2017, the United States had failed to achieve a year of 3% economic growth for each of the previous dozen years. This was the first time this had ever happened in American history. Moreover, in 2016 and 2017, the eurozone rate of growth was faster than that of the United States. In 2016, while notoriously sclerotic Europe grew at about 2%, America grew at 1.75%.” Then, Donald Trump beat Hillary Clinton and passed the Tax Cuts and Jobs Act (TCJA) in December of 2017 by a handful of votes (12 in the House, two in the Senate), and in 2018 we had our first 3% GDP growth year since 2005 – the year after the Bush tax cuts.
This Master Plan for Growth worked in the 1920s, 1960s, 1980s and recently. It can work again by allowing the 2017 tax cuts to stand after 2025, and even lowering them further, if we dare follow history.
All content above represents the opinion of Gary Alexander of Navellier & Associates, Inc.
Also In This Issue
A Look Ahead by Louis Navellier
The Global Implications of Rising Energy Prices
Income Mail by Bryan Perry
Factoring In the New War Realities
Growth Mail by Gary Alexander
How to Create a Roaring (2nd Half of the) Twenties
Global Mail by Ivan Martchev
Possible Rising Recriminations Face the Stock Market
Sector Spotlight by Jason Bodner
Is a Market Cataclysm Coming Soon?
View Full Archive
Read Past Issues Here
About The Author

Gary Alexander
SENIOR EDITOR
Gary Alexander has been Senior Writer at Navellier since 2009. He edits Navellier’s weekly Marketmail and writes a weekly Growth Mail column, in which he uses market history to support the case for growth stocks. For the previous 20 years before joining Navellier, he was Senior Executive Editor at InvestorPlace Media (formerly Phillips Publishing), where he worked with several leading investment analysts, including Louis Navellier (since 1997), helping launch Louis Navellier’s Blue Chip Growth and Global Growth newsletters.
Prior to that, Gary edited Wealth Magazine and Gold Newsletter and wrote various investment research reports for Jefferson Financial in New Orleans in the 1980s. He began his financial newsletter career with KCI Communications in 1980, where he served as consulting editor for Personal Finance newsletter while serving as general manager of KCI’s Alexandria House book division. Before that, he covered the economics beat for news magazines. All content of “Growth Mail” represents the opinion of Gary Alexander
Important Disclosures:
Although information in these reports has been obtained from and is based upon sources that Navellier believes to be reliable, Navellier does not guarantee its accuracy and it may be incomplete or condensed. All opinions and estimates constitute Navellier’s judgment as of the date the report was created and are subject to change without notice. These reports are for informational purposes only and are not a solicitation for the purchase or sale of a security. Any decision to purchase securities mentioned in these reports must take into account existing public information on such securities or any registered prospectus.To the extent permitted by law, neither Navellier & Associates, Inc., nor any of its affiliates, agents, or service providers assumes any liability or responsibility nor owes any duty of care for any consequences of any person acting or refraining to act in reliance on the information contained in this communication or for any decision based on it.
Past performance is no indication of future results. Investment in securities involves significant risk and has the potential for partial or complete loss of funds invested. It should not be assumed that any securities recommendations made by Navellier. in the future will be profitable or equal the performance of securities made in this report. Dividend payments are not guaranteed. The amount of a dividend payment, if any, can vary over time and issuers may reduce dividends paid on securities in the event of a recession or adverse event affecting a specific industry or issuer.
None of the stock information, data, and company information presented herein constitutes a recommendation by Navellier or a solicitation to buy or sell any securities. Any specific securities identified and described do not represent all of the securities purchased, sold, or recommended for advisory clients. The holdings identified do not represent all of the securities purchased, sold, or recommended for advisory clients and the reader should not assume that investments in the securities identified and discussed were or will be profitable.
Information presented is general information that does not take into account your individual circumstances, financial situation, or needs, nor does it present a personalized recommendation to you. Individual stocks presented may not be suitable for every investor. Investment in securities involves significant risk and has the potential for partial or complete loss of funds invested. Investment in fixed income securities has the potential for the investment return and principal value of an investment to fluctuate so that an investor’s holdings, when redeemed, may be worth less than their original cost.
One cannot invest directly in an index. Index is unmanaged and index performance does not reflect deduction of fees, expenses, or taxes. Presentation of Index data does not reflect a belief by Navellier that any stock index constitutes an investment alternative to any Navellier equity strategy or is necessarily comparable to such strategies. Among the most important differences between the Indices and Navellier strategies are that the Navellier equity strategies may (1) incur material management fees, (2) concentrate its investments in relatively few stocks, industries, or sectors, (3) have significantly greater trading activity and related costs, and (4) be significantly more or less volatile than the Indices.
ETF Risk: We may invest in exchange traded funds (“ETFs”) and some of our investment strategies are generally fully invested in ETFs. Like traditional mutual funds, ETFs charge asset-based fees, but they generally do not charge initial sales charges or redemption fees and investors typically pay only customary brokerage fees to buy and sell ETF shares. The fees and costs charged by ETFs held in client accounts will not be deducted from the compensation the client pays Navellier. ETF prices can fluctuate up or down, and a client account could lose money investing in an ETF if the prices of the securities owned by the ETF go down. ETFs are subject to additional risks:
- ETF shares may trade above or below their net asset value;
- An active trading market for an ETF’s shares may not develop or be maintained;
- The value of an ETF may be more volatile than the underlying portfolio of securities the ETF is designed to track;
- The cost of owning shares of the ETF may exceed those a client would incur by directly investing in the underlying securities; and
- Trading of an ETF’s shares may be halted if the listing exchange’s officials deem it appropriate, the shares are delisted from the exchange, or the activation of market-wide “circuit breakers” (which are tied to large decreases in stock prices) halts stock trading generally.
Grader Disclosures: Investment in equity strategies involves substantial risk and has the potential for partial or complete loss of funds invested. The sample portfolio and any accompanying charts are for informational purposes only and are not to be construed as a solicitation to buy or sell any financial instrument and should not be relied upon as the sole factor in an investment making decision. As a matter of normal and important disclosures to you, as a potential investor, please consider the following: The performance presented is not based on any actual securities trading, portfolio, or accounts, and the reported performance of the A, B, C, D, and F portfolios (collectively the “model portfolios”) should be considered mere “paper” or pro forma performance results based on Navellier’s research.
Investors evaluating any of Navellier & Associates, Inc.’s, (or its affiliates’) Investment Products must not use any information presented here, including the performance figures of the model portfolios, in their evaluation of any Navellier Investment Products. Navellier Investment Products include the firm’s mutual funds and managed accounts. The model portfolios, charts, and other information presented do not represent actual funded trades and are not actual funded portfolios. There are material differences between Navellier Investment Products’ portfolios and the model portfolios, research, and performance figures presented here. The model portfolios and the research results (1) may contain stocks or ETFs that are illiquid and difficult to trade; (2) may contain stock or ETF holdings materially different from actual funded Navellier Investment Product portfolios; (3) include the reinvestment of all dividends and other earnings, estimated trading costs, commissions, or management fees; and, (4) may not reflect prices obtained in an actual funded Navellier Investment Product portfolio. For these and other reasons, the reported performances of model portfolios do not reflect the performance results of Navellier’s actually funded and traded Investment Products. In most cases, Navellier’s Investment Products have materially lower performance results than the performances of the model portfolios presented.
This report contains statements that are, or may be considered to be, forward-looking statements. All statements that are not historical facts, including statements about our beliefs or expectations, are “forward-looking statements” within the meaning of The U.S. Private Securities Litigation Reform Act of 1995. These statements may be identified by such forward-looking terminology as “expect,” “estimate,” “plan,” “intend,” “believe,” “anticipate,” “may,” “will,” “should,” “could,” “continue,” “project,” or similar statements or variations of such terms. Our forward-looking statements are based on a series of expectations, assumptions, and projections, are not guarantees of future results or performance, and involve substantial risks and uncertainty as described in Form ADV Part 2A of our filing with the Securities and Exchange Commission (SEC), which is available at www.adviserinfo.sec.gov or by requesting a copy by emailing info@navellier.com. All of our forward-looking statements are as of the date of this report only. We can give no assurance that such expectations or forward-looking statements will prove to be correct. Actual results may differ materially. You are urged to carefully consider all such factors.
FEDERAL TAX ADVICE DISCLAIMER: As required by U.S. Treasury Regulations, you are informed that, to the extent this presentation includes any federal tax advice, the presentation is not written by Navellier to be used, and cannot be used, for the purpose of avoiding federal tax penalties. Navellier does not advise on any income tax requirements or issues. Use of any information presented by Navellier is for general information only and does not represent tax advice either express or implied. You are encouraged to seek professional tax advice for income tax questions and assistance.
IMPORTANT NEWSLETTER DISCLOSURE:The hypothetical performance results for investment newsletters that are authored or edited by Louis Navellier, including Louis Navellier’s Growth Investor, Louis Navellier’s Breakthrough Stocks, Louis Navellier’s Accelerated Profits, and Louis Navellier’s Platinum Club, are not based on any actual securities trading, portfolio, or accounts, and the newsletters’ reported hypothetical performances should be considered mere “paper” or proforma hypothetical performance results and are not actual performance of real world trades. Navellier & Associates, Inc. does not have any relation to or affiliation with the owner of these newsletters. There are material differences between Navellier Investment Products’ portfolios and the InvestorPlace Media, LLC newsletter portfolios authored by Louis Navellier. The InvestorPlace Media, LLC newsletters contain hypothetical performance that do not include transaction costs, advisory fees, or other fees a client might incur if actual investments and trades were being made by an investor. As a result, newsletter performance should not be used to evaluate Navellier Investment services which are separate and different from the newsletters. The owner of the newsletters is InvestorPlace Media, LLC and any questions concerning the newsletters, including any newsletter advertising or hypothetical Newsletter performance claims, (which are calculated solely by Investor Place Media and not Navellier) should be referred to InvestorPlace Media, LLC at (800) 718-8289.
Please note that Navellier & Associates and the Navellier Private Client Group are managed completely independent of the newsletters owned and published by InvestorPlace Media, LLC and written and edited by Louis Navellier, and investment performance of the newsletters should in no way be considered indicative of potential future investment performance for any Navellier & Associates separately managed account portfolio. Potential investors should consult with their financial advisor before investing in any Navellier Investment Product.
Navellier claims compliance with Global Investment Performance Standards (GIPS). To receive a complete list and descriptions of Navellier’s composites and/or a presentation that adheres to the GIPS standards, please contact Navellier or click here. It should not be assumed that any securities recommendations made by Navellier & Associates, Inc. in the future will be profitable or equal the performance of securities made in this report.
FactSet Disclosure: Navellier does not independently calculate the statistical information included in the attached report. The calculation and the information are provided by FactSet, a company not related to Navellier. Although information contained in the report has been obtained from FactSet and is based on sources Navellier believes to be reliable, Navellier does not guarantee its accuracy, and it may be incomplete or condensed. The report and the related FactSet sourced information are provided on an “as is” basis. The user assumes the entire risk of any use made of this information. Investors should consider the report as only a single factor in making their investment decision. The report is for informational purposes only and is not intended as an offer or solicitation for the purchase or sale of a security. FactSet sourced information is the exclusive property of FactSet. Without prior written permission of FactSet, this information may not be reproduced, disseminated or used to create any financial products. All indices are unmanaged and performance of the indices include reinvestment of dividends and interest income, unless otherwise noted, are not illustrative of any particular investment and an investment cannot be made in any index. Past performance is no guarantee of future results.