by Jason Bodner
September 26, 2023
I’m lucky. I don’t get seasick. I once found myself on a 90-foot sailboat in the Gulf of Mexico. In my cabin, as I lay in my berth, I saw a star swing madly from above to below my porthole. This happened all night long as we navigated 8-foot swells. I held myself in bed by anchoring the nightstand and rolling against the waves. But I never became nauseous. It felt like a very long amusement park ride to me.
I told this to a friend once and he said: “I’m getting seasick just thinking about it.” Ironically, that’s true: Studies have shown that people prone to sea-sickness can get sick just by thinking about it.
Many investors might look at recent market volatility and feel seasick. I don’t blame them. Just looking at the broad indexes over the course of the past week, the market is thrashing about like that sloop I was on. The NASDAQ dropped an ugly -3.5% while the small-cap heavy Russell plopped down -3.71%. Yuck.
The good news is that market sickness isn’t a given. It’s not medical and is usually fear-induced. I am here to tell you that everything will be fine, for many data-driven reasons. Let’s begin with a reminder that, despite recent choppy waters, markets are up big time from their lows. In the chart below, we see various index performances over the last week and also since the October 12, 2022 lows:
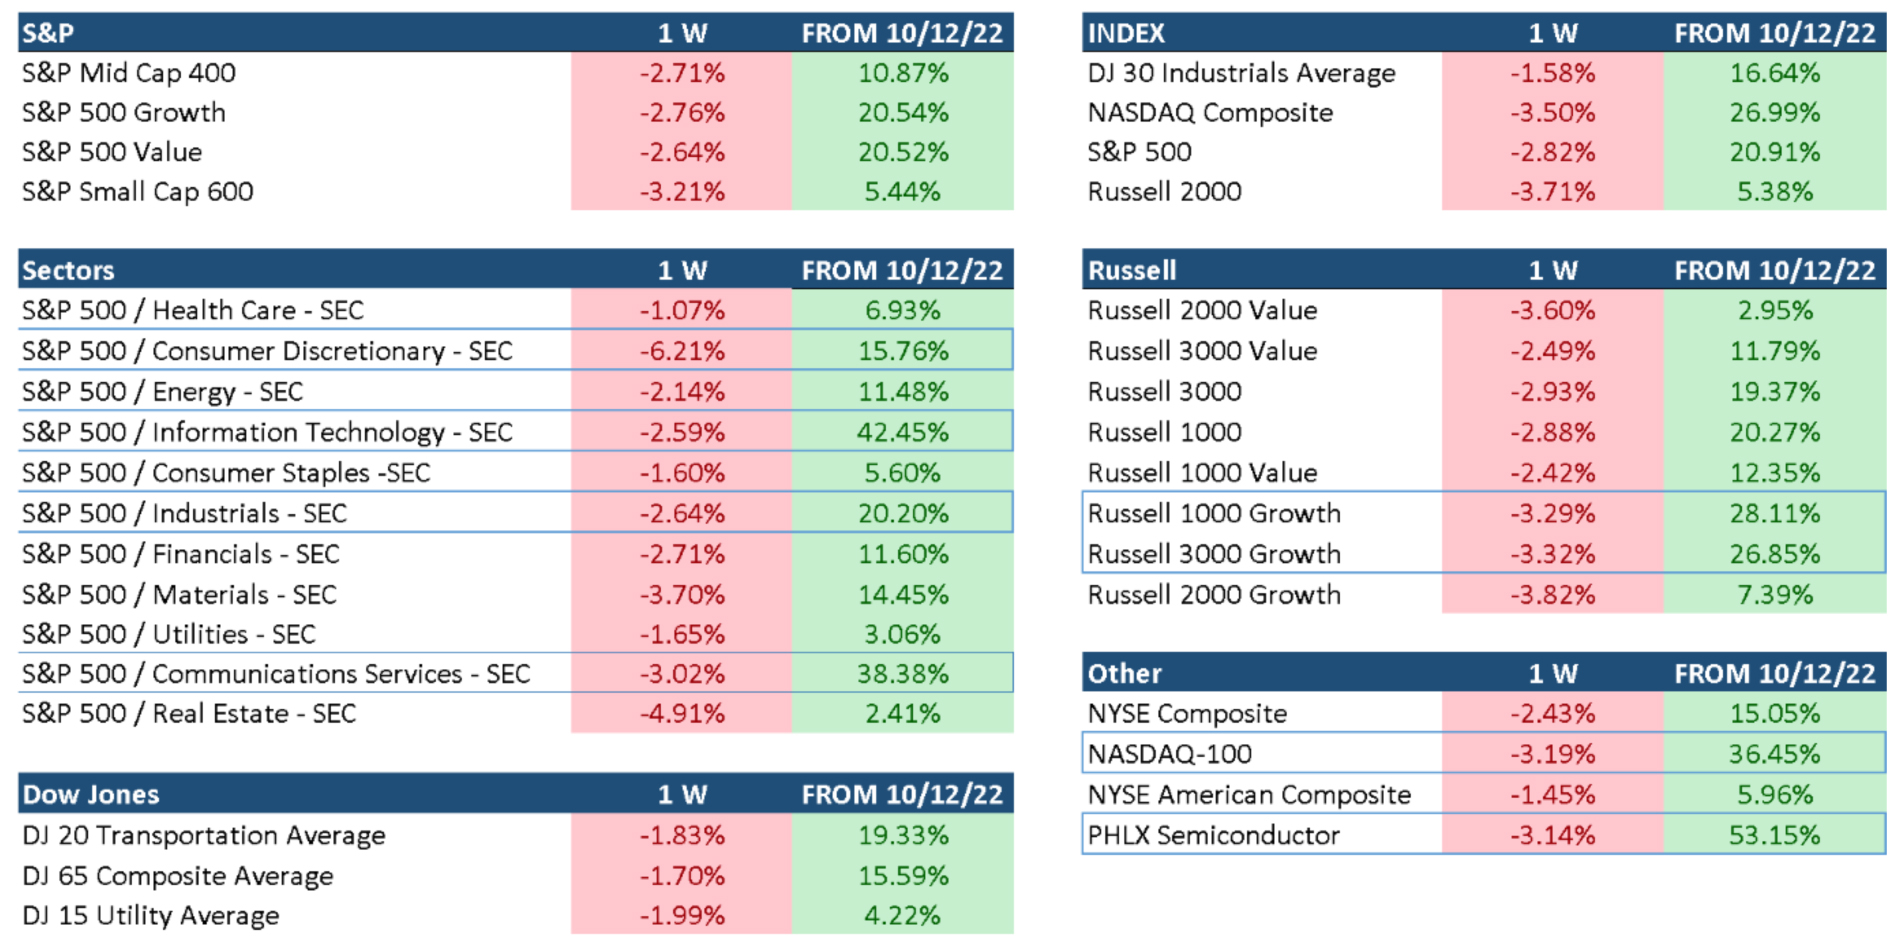
Graphs are for illustrative and discussion purposes only. Please read important disclosures at the end of this commentary.
That, at least, should help contextualize last week’s ugly performance. It’s also important to recall that growth led the way. Technology, Discretionary, and Industrials surged along with the smaller Communications sector. Also notice the NASDAQ 100 and PHLX Semiconductor index have been on fire, along with the growth-heavy Russell indexes. That’s the type of leadership we like to see leading from the depths.
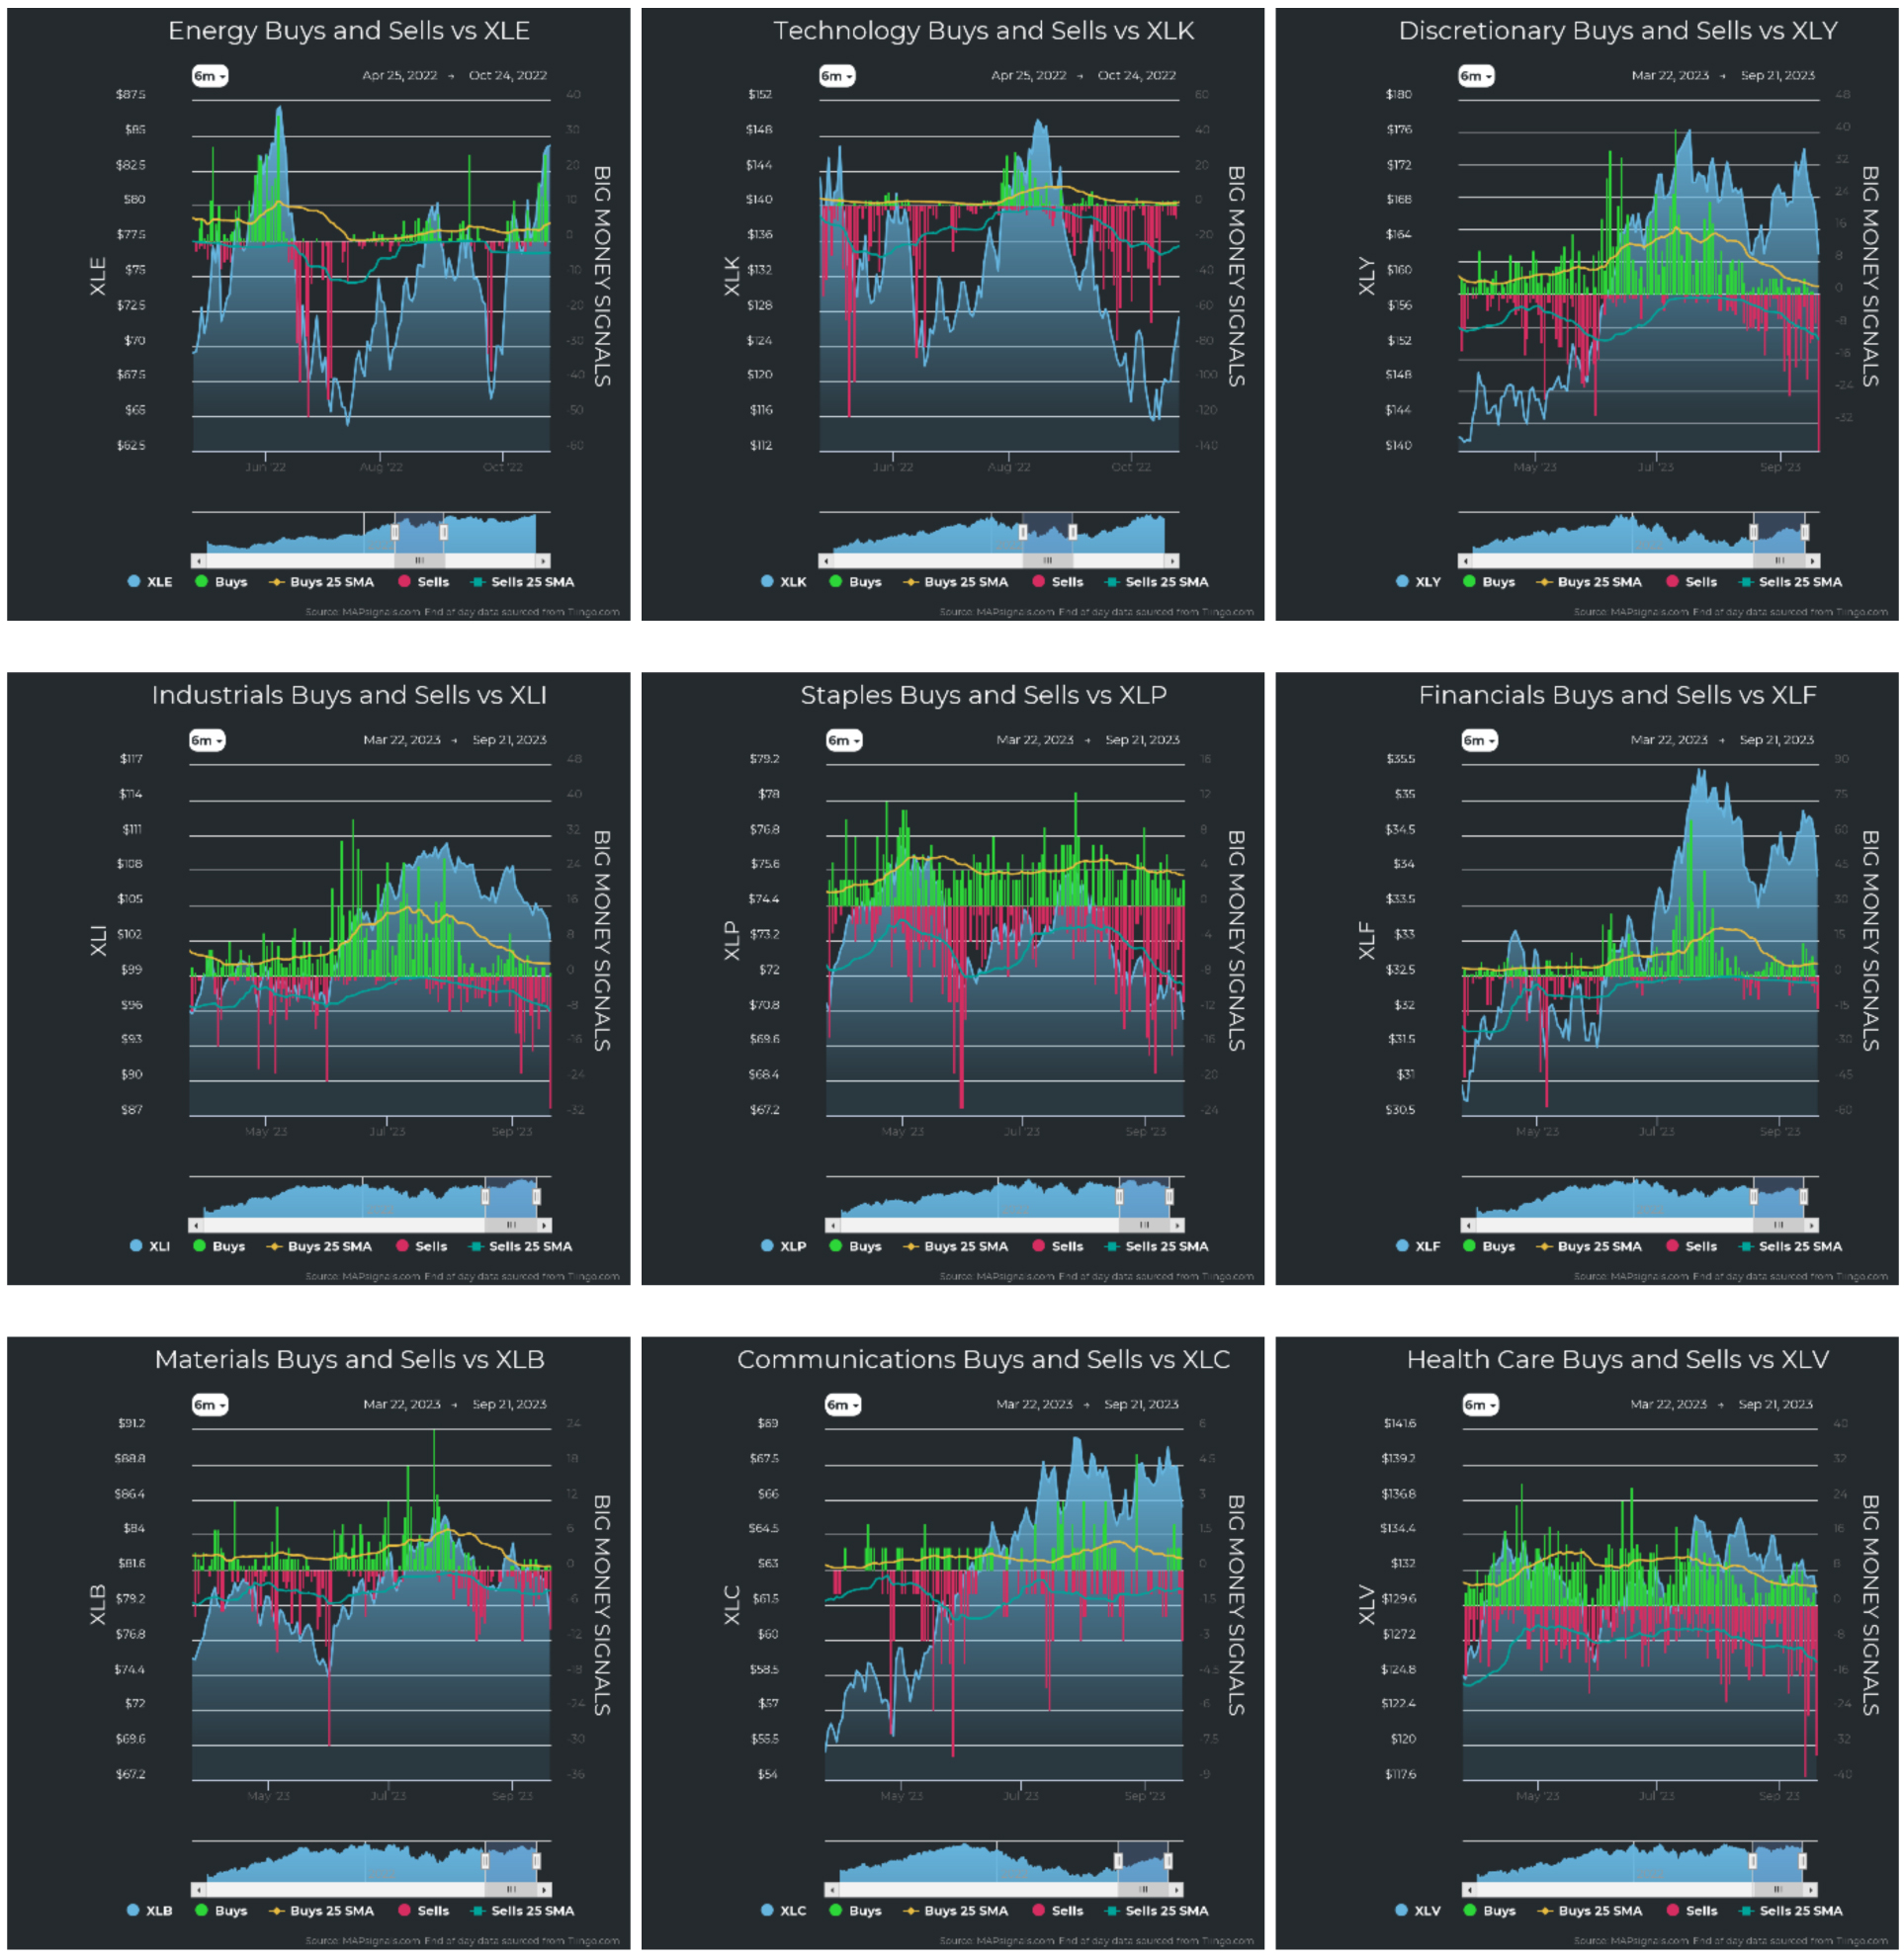
You wouldn’t know it if you only looked at stocks or indexes over the past few weeks, but those exact same leadership sectors have been getting punished for weeks. Below, we see each sector in terms of outsized money flows. Technology, Discretionary and Industrials all saw heavy selling, joined by Staples, Healthcare, and most recently a big spike in Real Estate selling:
Graphs are for illustrative and discussion purposes only. Please read important disclosures at the end of this commentary.
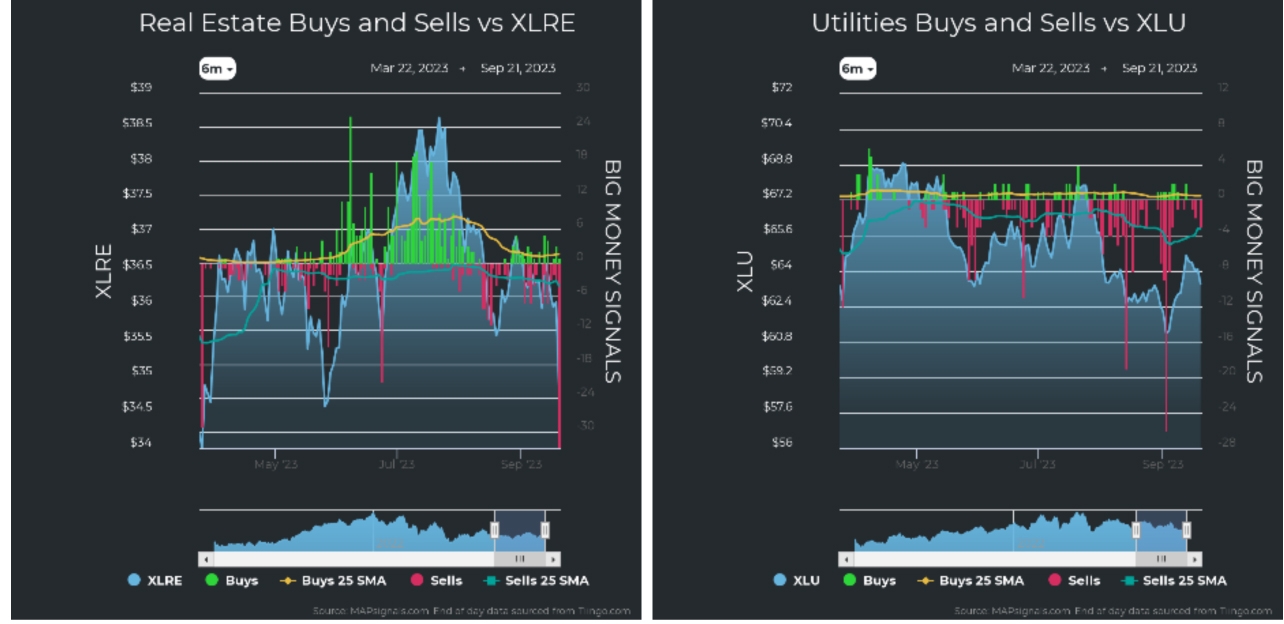
Utilities saw outsized selling, which we previously highlighted as an opportunity. Past instances of extreme sector selling often preface significant price rises. We highlighted this a few weeks ago for Utilities and the sector saw a +4.7% recovery shortly thereafter.
The fact is our data is littered with a strong theme of extreme selling prefacing rises in the overall market, ETFs and sectors. These concepts will be heavily detailed in a forthcoming white paper.
Usually, when capitulation rears its ugly head – it’s the bottom. So, what does that mean for us right now?
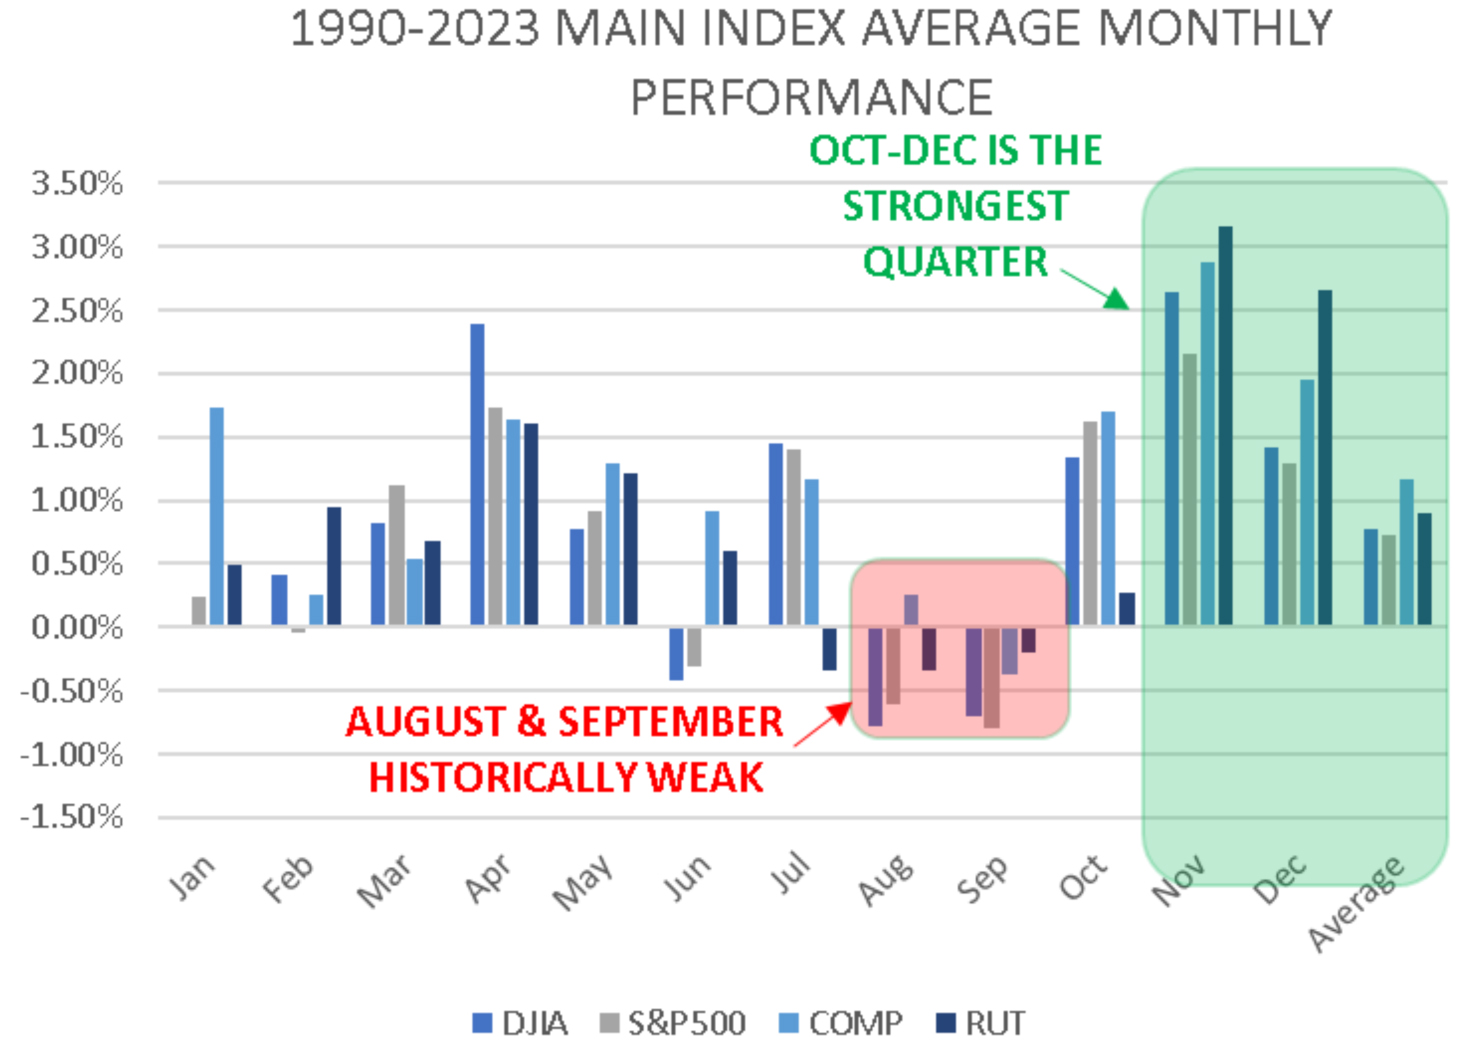
First, as I repeatedly state, August and September are the worst performing market months historically, at least since 1990, and 2023 definitely did not stray from the norm. The flip side is that October through December are the strongest months of the year. Here’s that chart, in case you missed it the first 50 times:
Graphs are for illustrative and discussion purposes only. Please read important disclosures at the end of this commentary.
From that perspective, we’re almost to the Promised Land! Let’s just get through this week… October is but a week away! For now, recent selling pressure in Technology and Discretionary have held those two leaders back enough so that Energy leap-frogged them into first place:
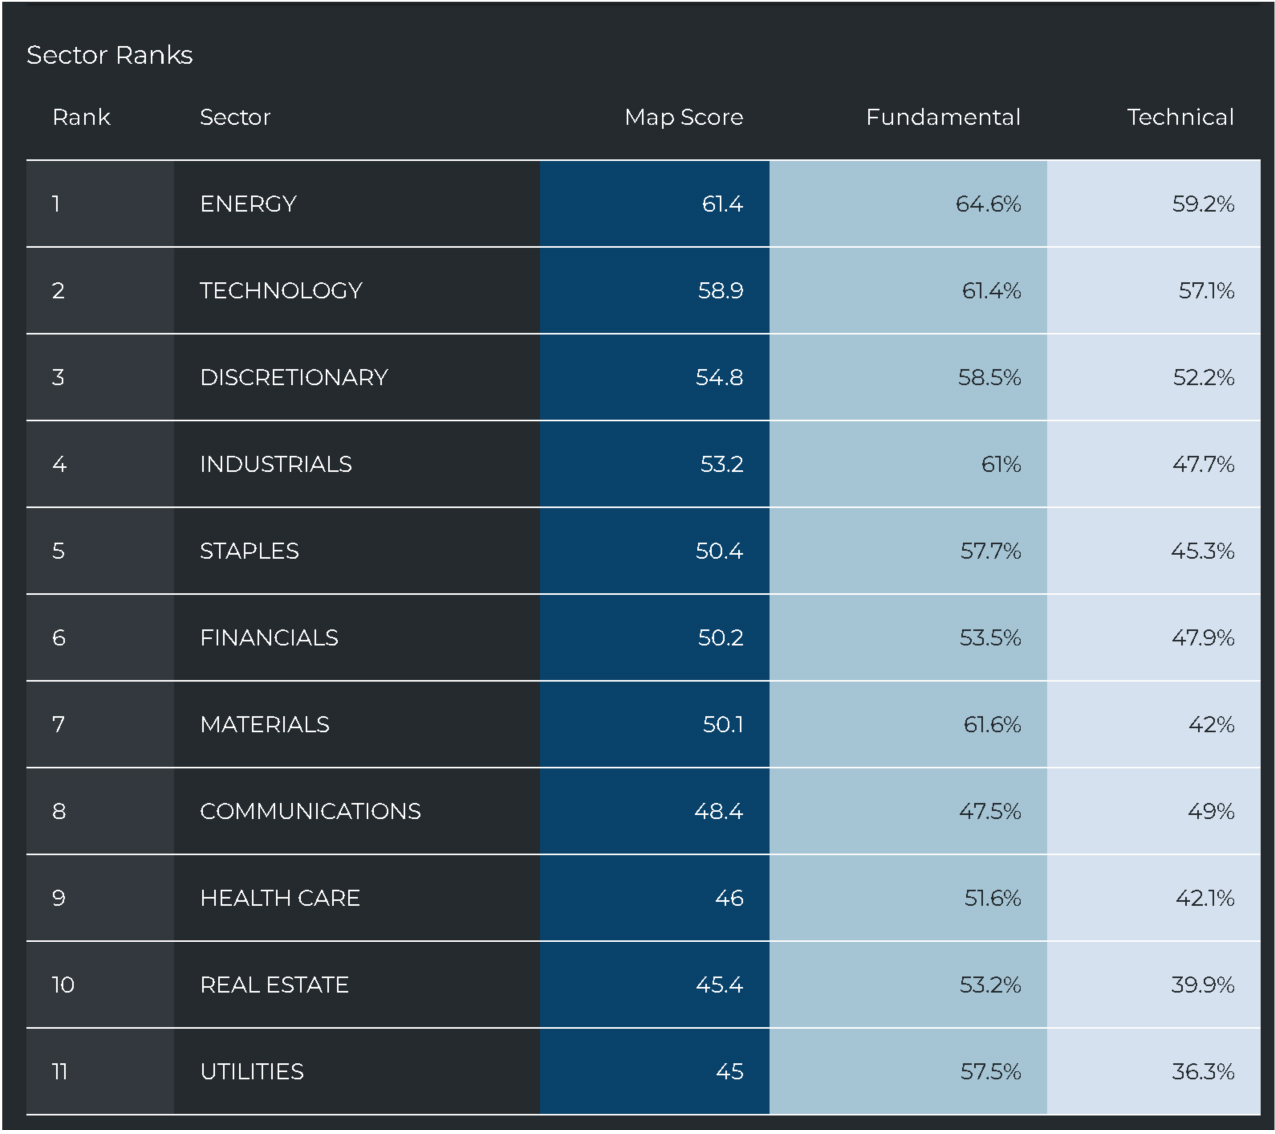
Graphs are for illustrative and discussion purposes only. Please read important disclosures at the end of this commentary.
This makes perfect sense when you revisit the sector charts of outsized money flows. Only one sector has seen unusual buying of late: Energy. A +34% rise in the price of crude oil since June will certainly have that effect on energy stocks. Higher oil prices mean a higher profit margin for oil and gas companies.
So here we are, during the seasonally weakest month of the year, with a ton of negative news headlines swirling around. But let’s be honest with each other: Since when are news headlines positive? If they were, no one would read them. It’s a sad truth that media companies exploit doom and gloom for profit.
Currently, we fear inflation, interest rate hikes, the UAW strike and exploding bond yields. With the threat of higher rates, investors sell bonds in anticipation of higher yields and higher rates. Often, we see bond yields race higher and equities running higher with them. That makes sense: Sell bonds to buy equities.
But now bonds are being sold and equities are facing headwinds. So where is all that money going?
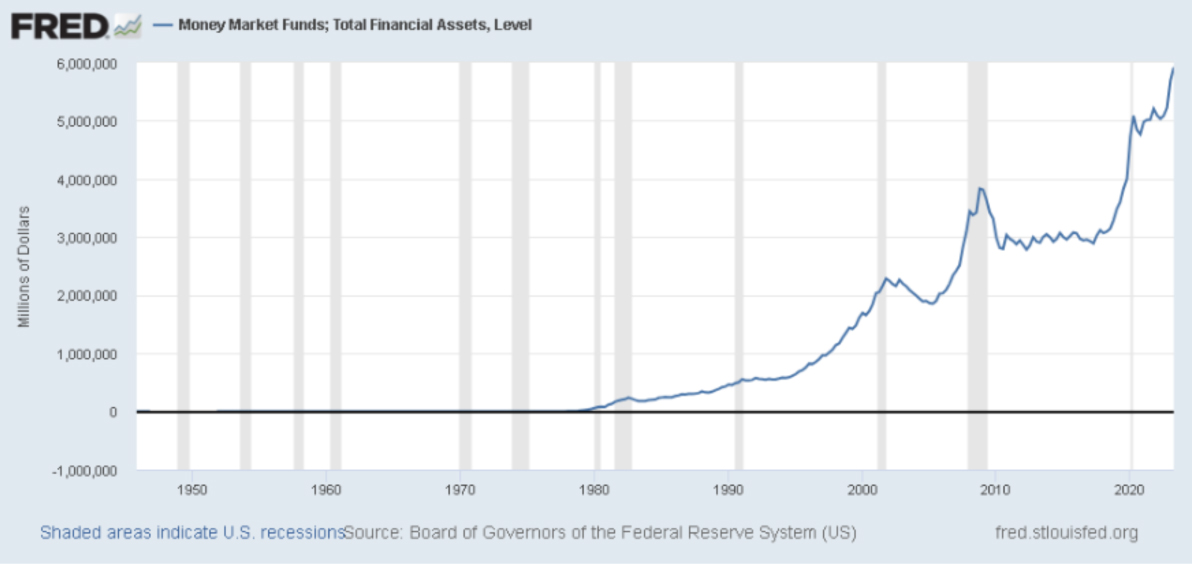
One clue is to look at money market funds. I have long said that there is $5.7 trillion in money market funds. Someone pushed back saying they read that it was only $5 trillion. Well, according to the latest release from the Federal Reserve (FRED, September 9, 2023) the number is actually closer to $6 trillion:
Graphs are for illustrative and discussion purposes only. Please read important disclosures at the end of this commentary.
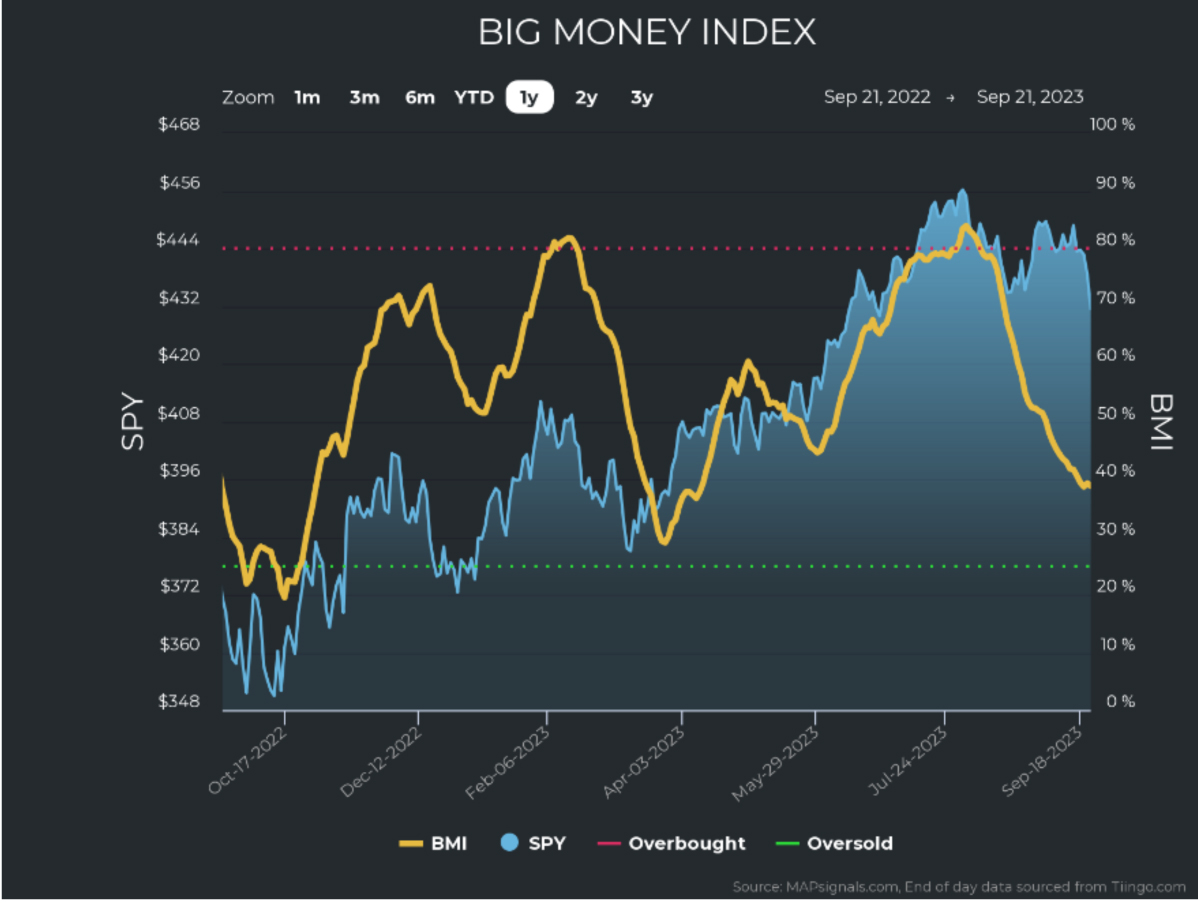
So, we have a seasonally weak month, with both bonds and equities being sold. This sets up a time of potential stock capitulation. And we see compelling reasons to expect it, too. The Big Money Index has been falling steadily and now it sits at 38.8%, inching ever closer towards oversold.
That is quite bullish looking forward three, six, nine and 12 months:
Graphs are for illustrative and discussion purposes only. Please read important disclosures at the end of this commentary.
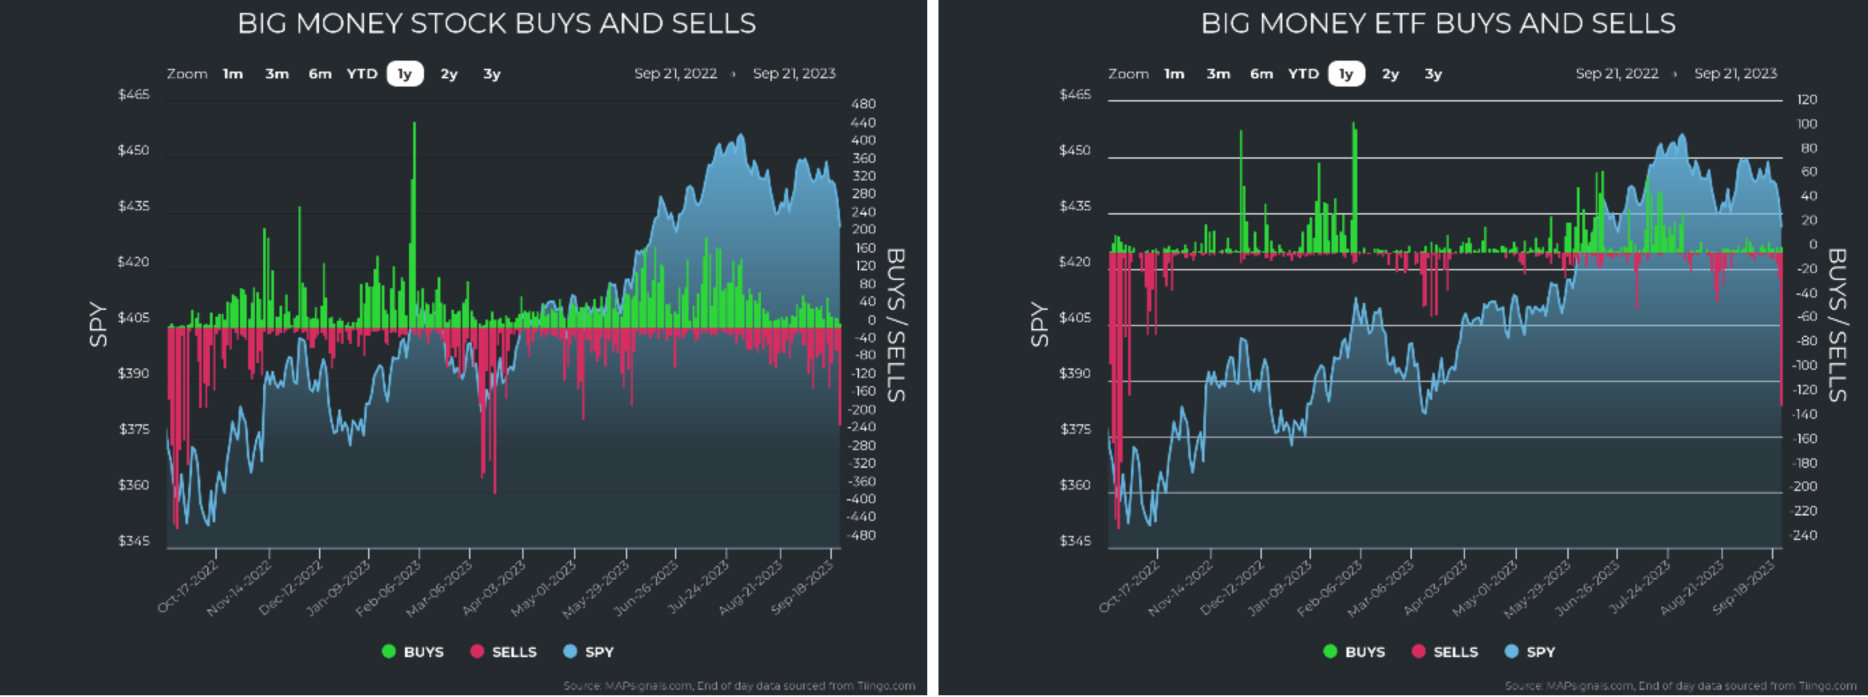
It is possible that capitulation may have already occurred in some market corners. Below, we see heavy selling in stocks and extreme selling in ETFS. That has typically been a strong reversion signal:
Graphs are for illustrative and discussion purposes only. Please read important disclosures at the end of this commentary.
I foresee a strong rally in the fourth quarter, and I believe it will be led by growth-heavy areas currently under pressure. (Think technology, semiconductors, discretionary, and industrials stocks).
For those you who suffer sea-sickness, I hear it sucks, but it’s not mandatory in markets. Keep an eye on the horizon like I did in that rocking ship on the way to Cuba. Navigate through the volatility.
Franklin D. Roosevelt poetically said: “A smooth sea never made a skilled sailor.”
All content above represents the opinion of Jason Bodner of Navellier & Associates, Inc.
Also In This Issue
A Look Ahead by Louis Navellier
The Fed Signals Another Rate Increase in 2023 (and No Cuts!)
Income Mail by Bryan Perry
Rising Bond Yields Stoke the Hunt for Maximum Income
Growth Mail by Gary Alexander
As We Approach $100 Oil (Again), Let’s Recall the 1970s Oil Crises
Global Mail by Ivan Martchev
Target for the Correction in Equities is Still the 200-day Moving Average
Sector Spotlight by Jason Bodner
If Volatility Makes You Seasick, I’ve Got the Right Antidote
View Full Archive
Read Past Issues Here

Jason Bodner
MARKETMAIL EDITOR FOR SECTOR SPOTLIGHT
Jason Bodner writes Sector Spotlight in the weekly Marketmail publication and has authored several white papers for the company. He is also Co-Founder of Macro Analytics for Professionals which produces proprietary equity accumulation/distribution research for its clients. Previously, Mr. Bodner served as Director of European Equity Derivatives for Cantor Fitzgerald Europe in London, then moved to the role of Head of Equity Derivatives North America for the same company in New York. He also served as S.V.P. Equity Derivatives for Jefferies, LLC. He received a B.S. in business administration in 1996, with honors, from Skidmore College as a member of the Periclean Honors Society. All content of “Sector Spotlight” represents the opinion of Jason Bodner
Important Disclosures:
Jason Bodner is a co-founder and co-owner of Mapsignals. Mr. Bodner is an independent contractor who is occasionally hired by Navellier & Associates to write an article and or provide opinions for possible use in articles that appear in Navellier & Associates weekly Market Mail. Mr. Bodner is not employed or affiliated with Louis Navellier, Navellier & Associates, Inc., or any other Navellier owned entity. The opinions and statements made here are those of Mr. Bodner and not necessarily those of any other persons or entities. This is not an endorsement, or solicitation or testimonial or investment advice regarding the BMI Index or any statements or recommendations or analysis in the article or the BMI Index or Mapsignals or its products or strategies.
Although information in these reports has been obtained from and is based upon sources that Navellier believes to be reliable, Navellier does not guarantee its accuracy and it may be incomplete or condensed. All opinions and estimates constitute Navellier’s judgment as of the date the report was created and are subject to change without notice. These reports are for informational purposes only and are not a solicitation for the purchase or sale of a security. Any decision to purchase securities mentioned in these reports must take into account existing public information on such securities or any registered prospectus.To the extent permitted by law, neither Navellier & Associates, Inc., nor any of its affiliates, agents, or service providers assumes any liability or responsibility nor owes any duty of care for any consequences of any person acting or refraining to act in reliance on the information contained in this communication or for any decision based on it.
Past performance is no indication of future results. Investment in securities involves significant risk and has the potential for partial or complete loss of funds invested. It should not be assumed that any securities recommendations made by Navellier. in the future will be profitable or equal the performance of securities made in this report. Dividend payments are not guaranteed. The amount of a dividend payment, if any, can vary over time and issuers may reduce dividends paid on securities in the event of a recession or adverse event affecting a specific industry or issuer.
None of the stock information, data, and company information presented herein constitutes a recommendation by Navellier or a solicitation to buy or sell any securities. Any specific securities identified and described do not represent all of the securities purchased, sold, or recommended for advisory clients. The holdings identified do not represent all of the securities purchased, sold, or recommended for advisory clients and the reader should not assume that investments in the securities identified and discussed were or will be profitable.
Information presented is general information that does not take into account your individual circumstances, financial situation, or needs, nor does it present a personalized recommendation to you. Individual stocks presented may not be suitable for every investor. Investment in securities involves significant risk and has the potential for partial or complete loss of funds invested. Investment in fixed income securities has the potential for the investment return and principal value of an investment to fluctuate so that an investor’s holdings, when redeemed, may be worth less than their original cost.
One cannot invest directly in an index. Index is unmanaged and index performance does not reflect deduction of fees, expenses, or taxes. Presentation of Index data does not reflect a belief by Navellier that any stock index constitutes an investment alternative to any Navellier equity strategy or is necessarily comparable to such strategies. Among the most important differences between the Indices and Navellier strategies are that the Navellier equity strategies may (1) incur material management fees, (2) concentrate its investments in relatively few stocks, industries, or sectors, (3) have significantly greater trading activity and related costs, and (4) be significantly more or less volatile than the Indices.
ETF Risk: We may invest in exchange traded funds (“ETFs”) and some of our investment strategies are generally fully invested in ETFs. Like traditional mutual funds, ETFs charge asset-based fees, but they generally do not charge initial sales charges or redemption fees and investors typically pay only customary brokerage fees to buy and sell ETF shares. The fees and costs charged by ETFs held in client accounts will not be deducted from the compensation the client pays Navellier. ETF prices can fluctuate up or down, and a client account could lose money investing in an ETF if the prices of the securities owned by the ETF go down. ETFs are subject to additional risks:
- ETF shares may trade above or below their net asset value;
- An active trading market for an ETF’s shares may not develop or be maintained;
- The value of an ETF may be more volatile than the underlying portfolio of securities the ETF is designed to track;
- The cost of owning shares of the ETF may exceed those a client would incur by directly investing in the underlying securities; and
- Trading of an ETF’s shares may be halted if the listing exchange’s officials deem it appropriate, the shares are delisted from the exchange, or the activation of market-wide “circuit breakers” (which are tied to large decreases in stock prices) halts stock trading generally.
Grader Disclosures: Investment in equity strategies involves substantial risk and has the potential for partial or complete loss of funds invested. The sample portfolio and any accompanying charts are for informational purposes only and are not to be construed as a solicitation to buy or sell any financial instrument and should not be relied upon as the sole factor in an investment making decision. As a matter of normal and important disclosures to you, as a potential investor, please consider the following: The performance presented is not based on any actual securities trading, portfolio, or accounts, and the reported performance of the A, B, C, D, and F portfolios (collectively the “model portfolios”) should be considered mere “paper” or pro forma performance results based on Navellier’s research.
Investors evaluating any of Navellier & Associates, Inc.’s, (or its affiliates’) Investment Products must not use any information presented here, including the performance figures of the model portfolios, in their evaluation of any Navellier Investment Products. Navellier Investment Products include the firm’s mutual funds and managed accounts. The model portfolios, charts, and other information presented do not represent actual funded trades and are not actual funded portfolios. There are material differences between Navellier Investment Products’ portfolios and the model portfolios, research, and performance figures presented here. The model portfolios and the research results (1) may contain stocks or ETFs that are illiquid and difficult to trade; (2) may contain stock or ETF holdings materially different from actual funded Navellier Investment Product portfolios; (3) include the reinvestment of all dividends and other earnings, estimated trading costs, commissions, or management fees; and, (4) may not reflect prices obtained in an actual funded Navellier Investment Product portfolio. For these and other reasons, the reported performances of model portfolios do not reflect the performance results of Navellier’s actually funded and traded Investment Products. In most cases, Navellier’s Investment Products have materially lower performance results than the performances of the model portfolios presented.
This report contains statements that are, or may be considered to be, forward-looking statements. All statements that are not historical facts, including statements about our beliefs or expectations, are “forward-looking statements” within the meaning of The U.S. Private Securities Litigation Reform Act of 1995. These statements may be identified by such forward-looking terminology as “expect,” “estimate,” “plan,” “intend,” “believe,” “anticipate,” “may,” “will,” “should,” “could,” “continue,” “project,” or similar statements or variations of such terms. Our forward-looking statements are based on a series of expectations, assumptions, and projections, are not guarantees of future results or performance, and involve substantial risks and uncertainty as described in Form ADV Part 2A of our filing with the Securities and Exchange Commission (SEC), which is available at www.adviserinfo.sec.gov or by requesting a copy by emailing info@navellier.com. All of our forward-looking statements are as of the date of this report only. We can give no assurance that such expectations or forward-looking statements will prove to be correct. Actual results may differ materially. You are urged to carefully consider all such factors.
FEDERAL TAX ADVICE DISCLAIMER: As required by U.S. Treasury Regulations, you are informed that, to the extent this presentation includes any federal tax advice, the presentation is not written by Navellier to be used, and cannot be used, for the purpose of avoiding federal tax penalties. Navellier does not advise on any income tax requirements or issues. Use of any information presented by Navellier is for general information only and does not represent tax advice either express or implied. You are encouraged to seek professional tax advice for income tax questions and assistance.
IMPORTANT NEWSLETTER DISCLOSURE:The hypothetical performance results for investment newsletters that are authored or edited by Louis Navellier, including Louis Navellier’s Growth Investor, Louis Navellier’s Breakthrough Stocks, Louis Navellier’s Accelerated Profits, and Louis Navellier’s Platinum Club, are not based on any actual securities trading, portfolio, or accounts, and the newsletters’ reported hypothetical performances should be considered mere “paper” or proforma hypothetical performance results and are not actual performance of real world trades. Navellier & Associates, Inc. does not have any relation to or affiliation with the owner of these newsletters. There are material differences between Navellier Investment Products’ portfolios and the InvestorPlace Media, LLC newsletter portfolios authored by Louis Navellier. The InvestorPlace Media, LLC newsletters contain hypothetical performance that do not include transaction costs, advisory fees, or other fees a client might incur if actual investments and trades were being made by an investor. As a result, newsletter performance should not be used to evaluate Navellier Investment services which are separate and different from the newsletters. The owner of the newsletters is InvestorPlace Media, LLC and any questions concerning the newsletters, including any newsletter advertising or hypothetical Newsletter performance claims, (which are calculated solely by Investor Place Media and not Navellier) should be referred to InvestorPlace Media, LLC at (800) 718-8289.
Please note that Navellier & Associates and the Navellier Private Client Group are managed completely independent of the newsletters owned and published by InvestorPlace Media, LLC and written and edited by Louis Navellier, and investment performance of the newsletters should in no way be considered indicative of potential future investment performance for any Navellier & Associates separately managed account portfolio. Potential investors should consult with their financial advisor before investing in any Navellier Investment Product.
Navellier claims compliance with Global Investment Performance Standards (GIPS). To receive a complete list and descriptions of Navellier’s composites and/or a presentation that adheres to the GIPS standards, please contact Navellier or click here. It should not be assumed that any securities recommendations made by Navellier & Associates, Inc. in the future will be profitable or equal the performance of securities made in this report.
FactSet Disclosure: Navellier does not independently calculate the statistical information included in the attached report. The calculation and the information are provided by FactSet, a company not related to Navellier. Although information contained in the report has been obtained from FactSet and is based on sources Navellier believes to be reliable, Navellier does not guarantee its accuracy, and it may be incomplete or condensed. The report and the related FactSet sourced information are provided on an “as is” basis. The user assumes the entire risk of any use made of this information. Investors should consider the report as only a single factor in making their investment decision. The report is for informational purposes only and is not intended as an offer or solicitation for the purchase or sale of a security. FactSet sourced information is the exclusive property of FactSet. Without prior written permission of FactSet, this information may not be reproduced, disseminated or used to create any financial products. All indices are unmanaged and performance of the indices include reinvestment of dividends and interest income, unless otherwise noted, are not illustrative of any particular investment and an investment cannot be made in any index. Past performance is no guarantee of future results.