by Gary Alexander
September 26, 2023
As I write this over the weekend, Sunday’s sunset marks the start of Yom Kippur, the holiest day on the Jewish calendar. It was on that day 50 years ago (falling on October 6, 1973), that Egyptian and Syrian forces launched a surprise attack against Israel, calculating that the nation would be caught off guard on this “double Sabbath,” since Yom Kippur fell on a Saturday, and most of the nation would be worshipping at synagogue or at home in contemplation. True, the nation was caught off guard, but eventually they reversed the initial Arab land gains before a cease-fire ended the war three weeks later.
In truth, the reversal came from massive U.S. and European arms countering Soviet-supplied Arab arms. Then came the OPEC oil embargo, which is the bigger story we need to recall as oil once again nears $100 per barrel. Before going down that road, let us recall that President Nixon and his freshly minted Secretary of State Henry Kissinger, the first naturalized U.S. citizen in that role, had plenty on their plate:
- On October 10, Vice President Spiro Agnew was forced to resign, pleading “no contest” to income tax evasion. He was fined $10,000 and served three years’ probation.
- On October 12, President Nixon nominated Gerald Ford to replace Agnew as Vice President. In his confirmation hearings, Ford relieved Watergate tensions by saying, “I’m a Ford, not a Lincoln.”
- On October 17, in the middle of this turmoil, the Organization of Petroleum Exporting Countries (OPEC) met in Algiers and suspended all exports to the U.S. and other nations that supported Israel.
- On October 20, in a “Saturday Night Massacre,” President Nixon fired Special Watergate Prosecutor Archibald Cox after firing Attorney General Elliott Richardson and Deputy AG William Ruckelshaus.
In the middle of this political brouhaha, oil prices soared when OPEC suspended oil exports to the U.S. The embargo caused shortages, gas lines, rationing and a four-fold rise in the cost of crude oil by early 1974. President Nixon imposed a “temporary” 55 mph speed limit that lasted over 20 years, until 1995.
Graphs are for illustrative and discussion purposes only. Please read important disclosures at the end of this commentary.
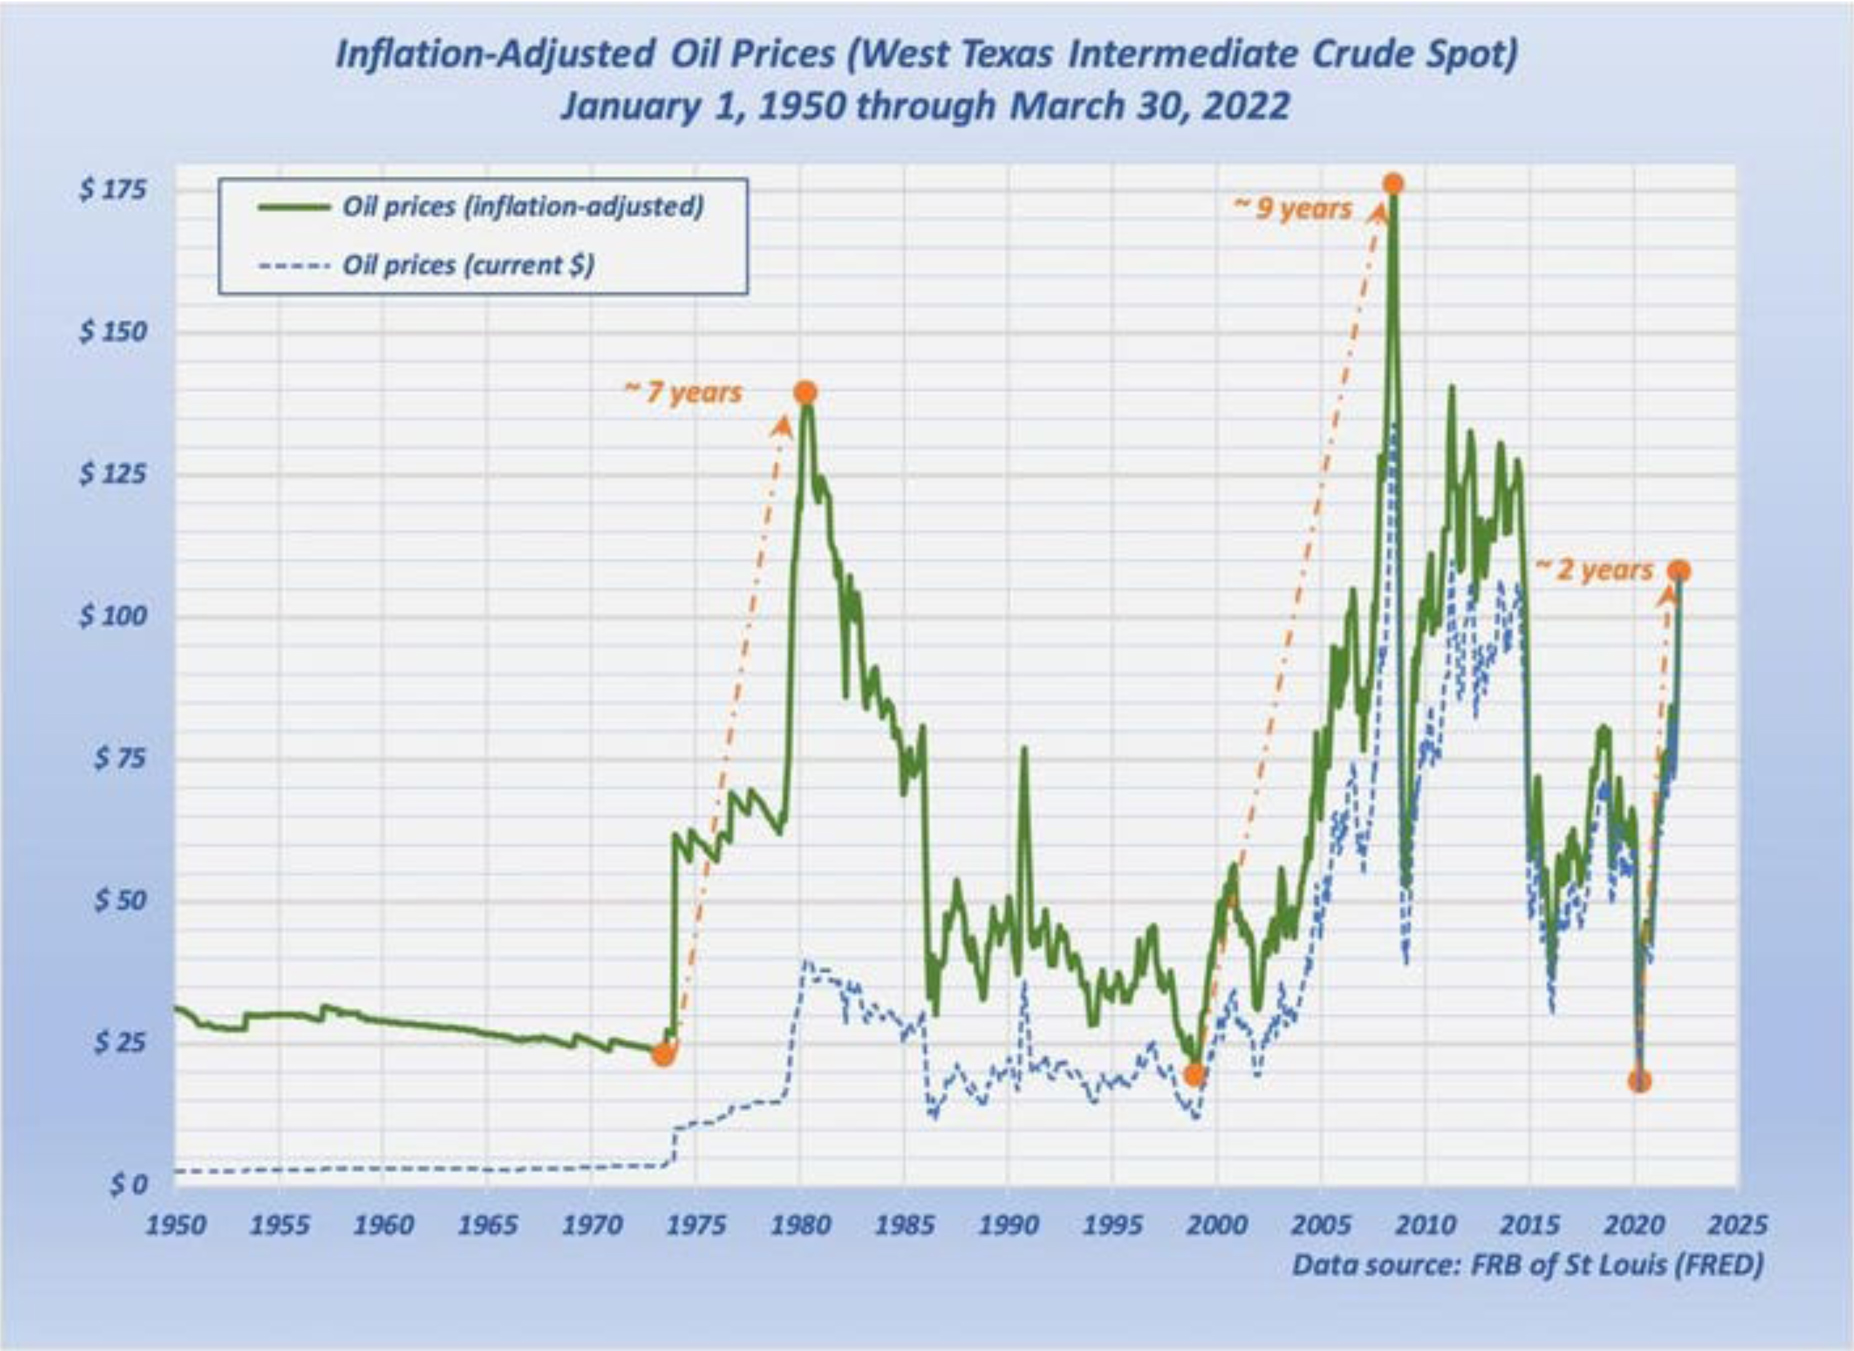
In nominal terms, oil rose from $3 to $12 per barrel – still cheap by today’s standards – but adjusted for inflation, that was something like rising from $20 to $60. The second 1970s oil shock – also man-made – pushed oil prices up to an inflation-adjusted $130 per barrel due to a combination of foreign intransigence by the Ayatollah Khomeini in Iran, and an inept response by President Carter’s new Energy Department.
The Second Oil Crisis – Courtesy of Iran and Carter’s New Energy Department
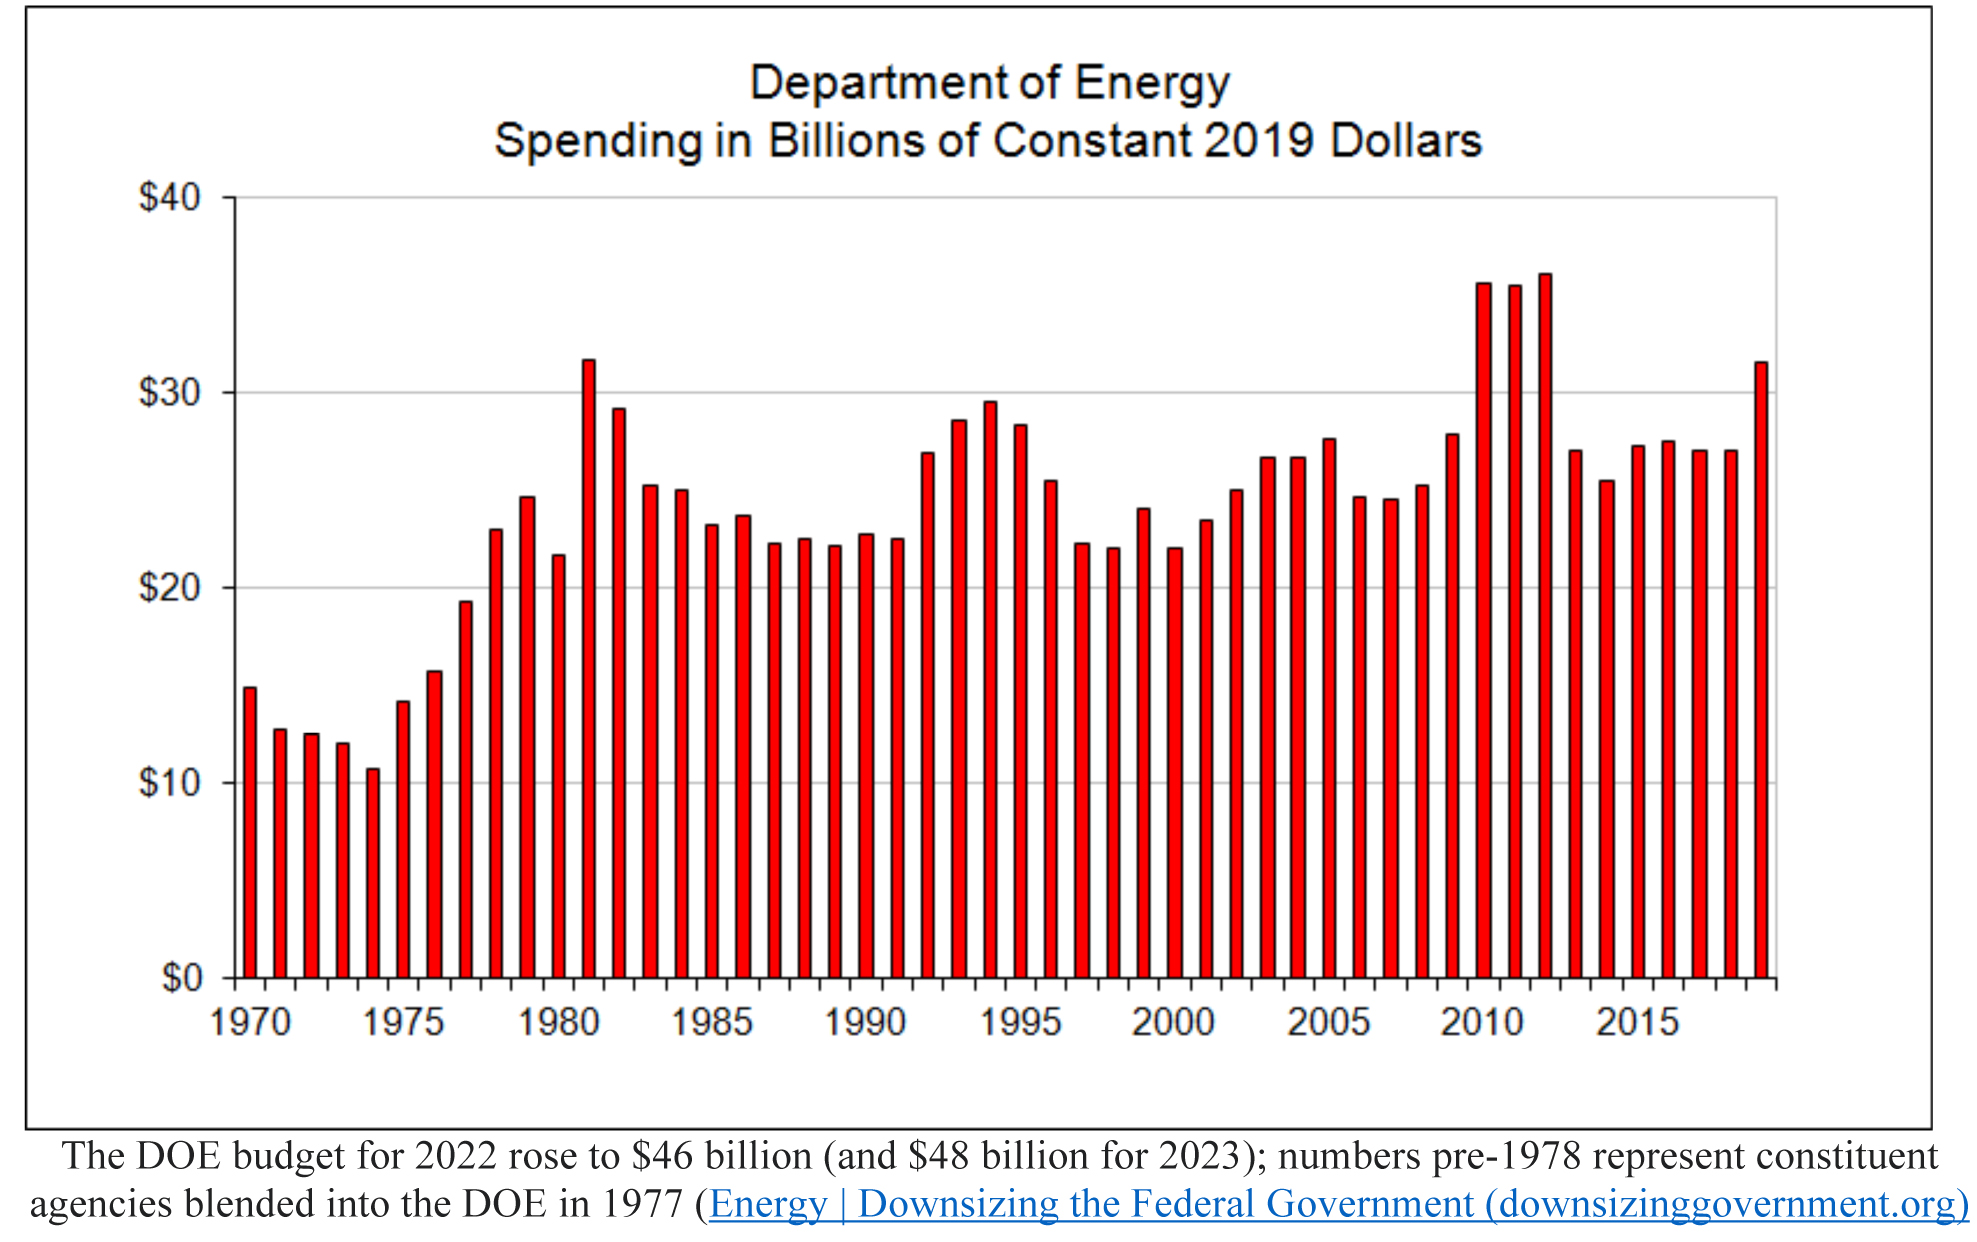
On August 4, 1977, new President Jimmy Carter signed into existence a new Federal Department of Energy (DOE), combining three major agencies and several minor agencies under an Energy Czar.
Therein lies the first problem. A republic of free people is not designed to obey one powerful Czar. Free markets usually distribute products more efficiently than top-down Czars, who tend to create … gas lines.
Soon after our Energy Czar took over, an Ayatollah took power in Iran, and he cut the supply of crude oil to America. Due to spot oil shortages, the President and his Czar thought they could allocate energy more equitably from a central planning committee than by allowing private companies to go where the demand was greatest, so during 1979, crude oil rose from $15 to $40, or from about $60 to $130 in 2019 dollars.
In populous states like California, New York, Pennsylvania, Texas, and New Jersey, consumers could only buy gas every other day, based on whether the last digit of their license plate number was even or odd. (I had a 55-mile commute, each way, each day, so I had to alternate cars and endure gas lines.)
Then, Carter and his Czar decided to regulate oil prices, which, of course, exacerbated the gas shortage. Regulators then ordered refiners to restrict the supply of gasoline to build inventories, which led to even higher prices. According to Investopedia, the Department of Energy then “decided to make a handful of large U.S. refiners sell crude to smaller refiners who could not find a ready supply of oil. Because smaller refiners had limited production capabilities, the decision further delayed gasoline supply.”
Despite this folly, the Department of Energy, to this day, continues to spend tens of billions of dollars per year, with their budget soaring under Biden to $46 billion in 2022 and $48 billion in 2023.
Graphs are for illustrative and discussion purposes only. Please read important disclosures at the end of this commentary.
The 3rd Oil Crisis (2008) and 4th Oil Crisis (2023-24?)
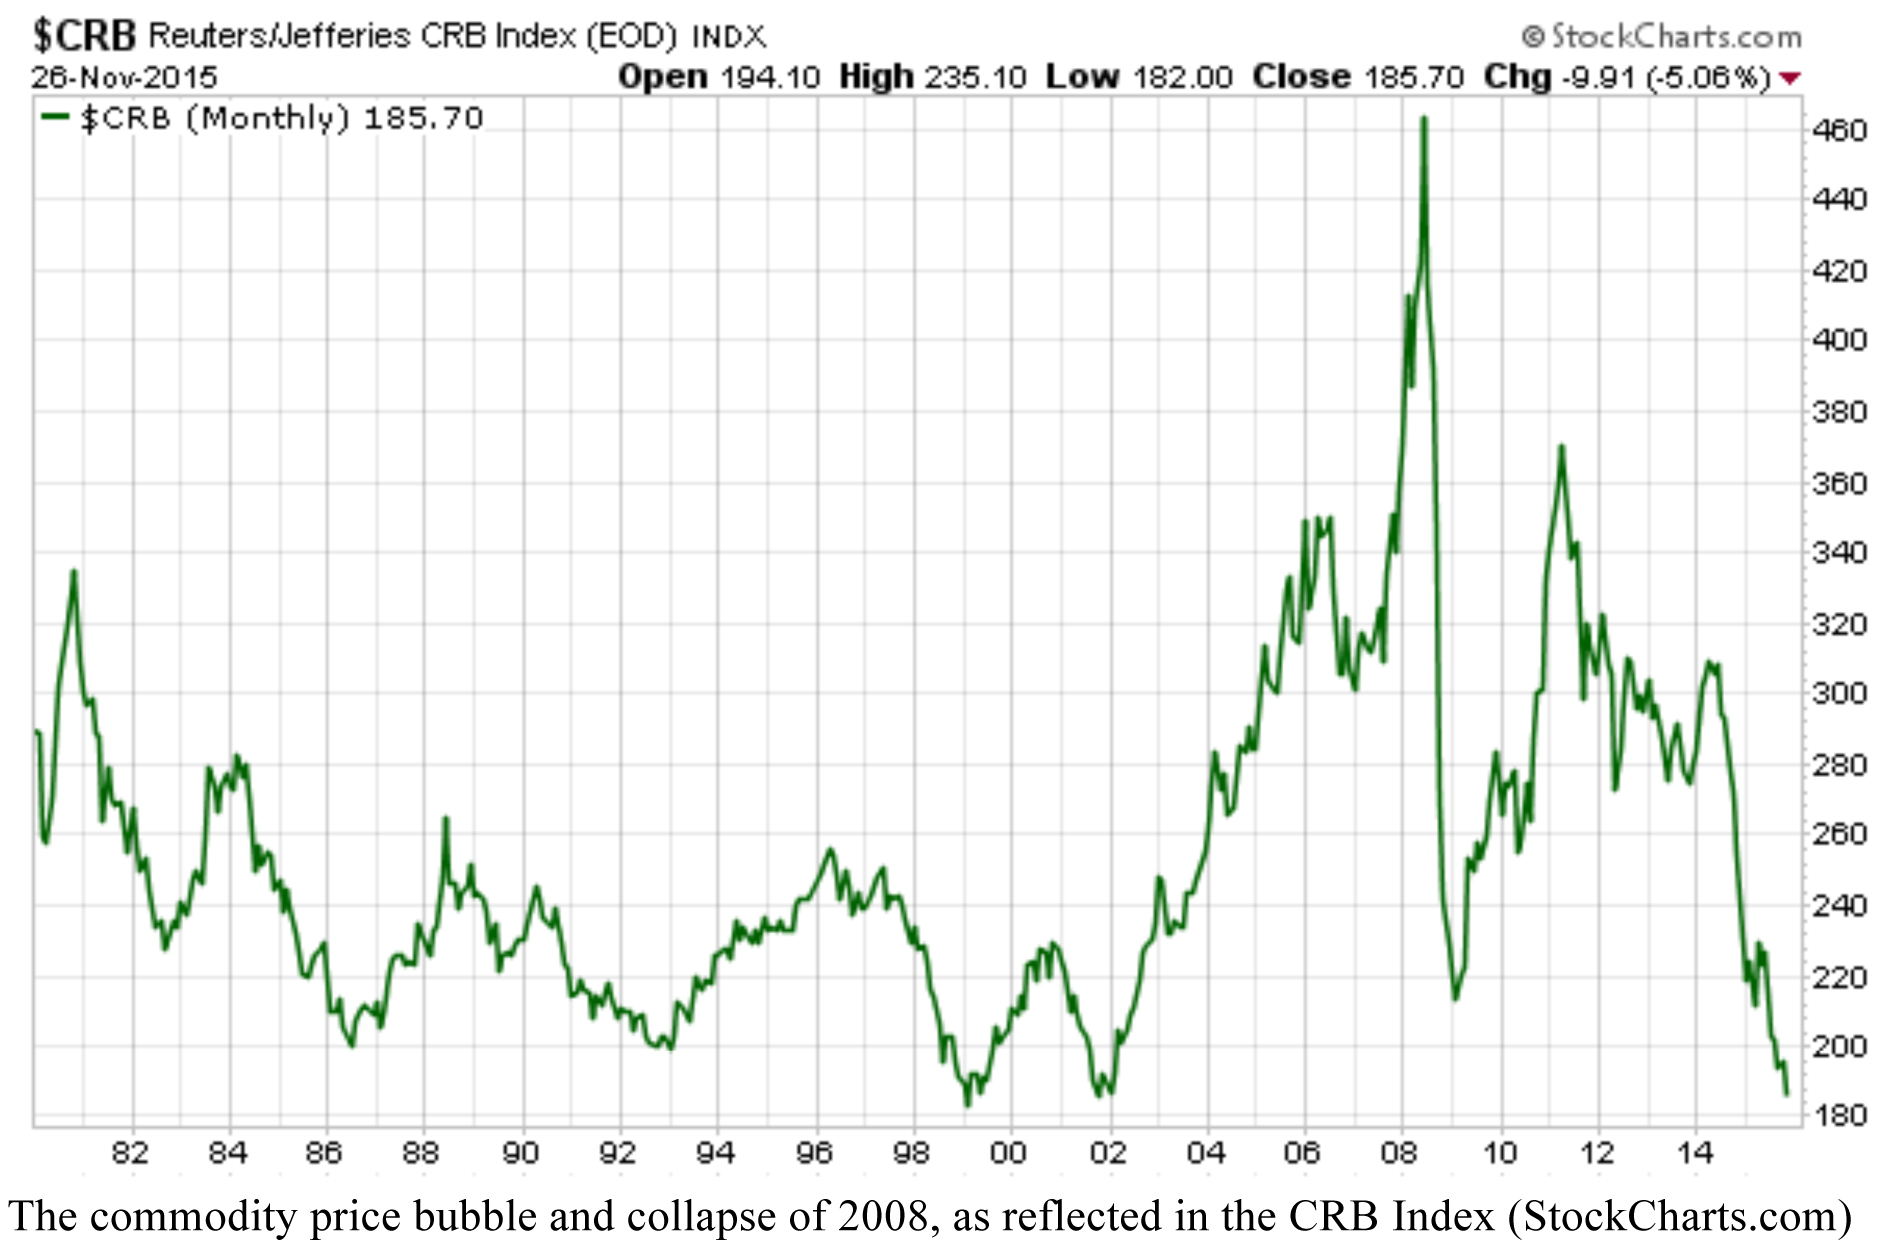
The all-time high for crude oil prices, in both real and nominal terms, came in mid-2008, when prices reached $150 per barrel (or $175 in 2019 dollars). That was a time of a general commodity price bubbles, with silver approaching $50, for a second time, gold soaring to a then-high $1,900, and some agricultural crops at or near record highs due to some June floods, but also due to the global financial crisis that year.
Graphs are for illustrative and discussion purposes only. Please read important disclosures at the end of this commentary.
Crude oil then reached its lowest price in 70 years – in real terms – in April 2020, mostly due to COVID and the lockdown. The closing price on April 30, 2020, was $18.84, but the futures market price one day was -$37 per barrel before the Biden Administration took over and turned our energy independence into renewed dependence on a series of unreliable enemies (Russia, Venezuela, Iran) and OPEC manipulators.
And now we witness West Texas Intermediate crude oil approaching $100 per barrel yet again. At the start of this year, Louis Navellier predicted this would happen, but his “energy bet” went against the grain of most pundits. Now, post-Labor Day, his prediction is coming to pass due mostly to the same reasons why the 1970s energy shocks took place – by offending Mideast oil producers at a time when politicians subverted our domestic energy independence. President Biden not only shut down domestic sources of gas and energy, but he has gone out of his way to offend the Saudi Royal family and other OPEC leaders.
In response to a variety of foreign policy gaffes and insults – and perhaps to impact the 2024 elections – the leaders of Saudi Arabia and Russia announced that they would extend their production cuts through the end of 2023. Goldman Sachs responded by sending a note to their clients on September 7: “Consider a bullish scenario where OPEC+ keeps the 2023 cuts…fully in place through end-2024 and where Saudi Arabia only gradually raises production.” In that scenario, Goldman sees $107 a barrel oil by end-2024.
In addition, The Wall Street Journal confirmed that diesel prices have risen over 40% since May. Since approximately 42% of European vehicles run on diesel, higher prices at the pump there are just beginning.
In America, we have no excuse for energy shortages. It’s a political decision. And, lest you think that petrified dinosaur bones only fuel trucks, planes and cars, here is a short list of petroleum byproducts:
| Asphalt | Glasses | Pacemakers | Soaps |
| Clothing | Golf bags | Phones | Surgical instruments |
| Computer laptops | Hearing Aids | Prosthetics | Toothpaste |
| Diapers | IV Tubes | Shampoo | Toys |
| Fertilizers | MRI machines | Shaving cream | Trashbags |
| (…and hundreds of more commonly used products for business, professional and household use) | |||
Energy-related inflation is generally a politically-caused crisis and can often be solved by an election.
All content above represents the opinion of Gary Alexander of Navellier & Associates, Inc.
Also In This Issue
A Look Ahead by Louis Navellier
The Fed Signals Another Rate Increase in 2023 (and No Cuts!)
Income Mail by Bryan Perry
Rising Bond Yields Stoke the Hunt for Maximum Income
Growth Mail by Gary Alexander
As We Approach $100 Oil (Again), Let’s Recall the 1970s Oil Crises
Global Mail by Ivan Martchev
Target for the Correction in Equities is Still the 200-day Moving Average
Sector Spotlight by Jason Bodner
If Volatility Makes You Seasick, I’ve Got the Right Antidote
View Full Archive
Read Past Issues Here
About The Author

Gary Alexander
SENIOR EDITOR
Gary Alexander has been Senior Writer at Navellier since 2009. He edits Navellier’s weekly Marketmail and writes a weekly Growth Mail column, in which he uses market history to support the case for growth stocks. For the previous 20 years before joining Navellier, he was Senior Executive Editor at InvestorPlace Media (formerly Phillips Publishing), where he worked with several leading investment analysts, including Louis Navellier (since 1997), helping launch Louis Navellier’s Blue Chip Growth and Global Growth newsletters.
Prior to that, Gary edited Wealth Magazine and Gold Newsletter and wrote various investment research reports for Jefferson Financial in New Orleans in the 1980s. He began his financial newsletter career with KCI Communications in 1980, where he served as consulting editor for Personal Finance newsletter while serving as general manager of KCI’s Alexandria House book division. Before that, he covered the economics beat for news magazines. All content of “Growth Mail” represents the opinion of Gary Alexander
Important Disclosures:
Although information in these reports has been obtained from and is based upon sources that Navellier believes to be reliable, Navellier does not guarantee its accuracy and it may be incomplete or condensed. All opinions and estimates constitute Navellier’s judgment as of the date the report was created and are subject to change without notice. These reports are for informational purposes only and are not a solicitation for the purchase or sale of a security. Any decision to purchase securities mentioned in these reports must take into account existing public information on such securities or any registered prospectus.To the extent permitted by law, neither Navellier & Associates, Inc., nor any of its affiliates, agents, or service providers assumes any liability or responsibility nor owes any duty of care for any consequences of any person acting or refraining to act in reliance on the information contained in this communication or for any decision based on it.
Past performance is no indication of future results. Investment in securities involves significant risk and has the potential for partial or complete loss of funds invested. It should not be assumed that any securities recommendations made by Navellier. in the future will be profitable or equal the performance of securities made in this report. Dividend payments are not guaranteed. The amount of a dividend payment, if any, can vary over time and issuers may reduce dividends paid on securities in the event of a recession or adverse event affecting a specific industry or issuer.
None of the stock information, data, and company information presented herein constitutes a recommendation by Navellier or a solicitation to buy or sell any securities. Any specific securities identified and described do not represent all of the securities purchased, sold, or recommended for advisory clients. The holdings identified do not represent all of the securities purchased, sold, or recommended for advisory clients and the reader should not assume that investments in the securities identified and discussed were or will be profitable.
Information presented is general information that does not take into account your individual circumstances, financial situation, or needs, nor does it present a personalized recommendation to you. Individual stocks presented may not be suitable for every investor. Investment in securities involves significant risk and has the potential for partial or complete loss of funds invested. Investment in fixed income securities has the potential for the investment return and principal value of an investment to fluctuate so that an investor’s holdings, when redeemed, may be worth less than their original cost.
One cannot invest directly in an index. Index is unmanaged and index performance does not reflect deduction of fees, expenses, or taxes. Presentation of Index data does not reflect a belief by Navellier that any stock index constitutes an investment alternative to any Navellier equity strategy or is necessarily comparable to such strategies. Among the most important differences between the Indices and Navellier strategies are that the Navellier equity strategies may (1) incur material management fees, (2) concentrate its investments in relatively few stocks, industries, or sectors, (3) have significantly greater trading activity and related costs, and (4) be significantly more or less volatile than the Indices.
ETF Risk: We may invest in exchange traded funds (“ETFs”) and some of our investment strategies are generally fully invested in ETFs. Like traditional mutual funds, ETFs charge asset-based fees, but they generally do not charge initial sales charges or redemption fees and investors typically pay only customary brokerage fees to buy and sell ETF shares. The fees and costs charged by ETFs held in client accounts will not be deducted from the compensation the client pays Navellier. ETF prices can fluctuate up or down, and a client account could lose money investing in an ETF if the prices of the securities owned by the ETF go down. ETFs are subject to additional risks:
- ETF shares may trade above or below their net asset value;
- An active trading market for an ETF’s shares may not develop or be maintained;
- The value of an ETF may be more volatile than the underlying portfolio of securities the ETF is designed to track;
- The cost of owning shares of the ETF may exceed those a client would incur by directly investing in the underlying securities; and
- Trading of an ETF’s shares may be halted if the listing exchange’s officials deem it appropriate, the shares are delisted from the exchange, or the activation of market-wide “circuit breakers” (which are tied to large decreases in stock prices) halts stock trading generally.
Grader Disclosures: Investment in equity strategies involves substantial risk and has the potential for partial or complete loss of funds invested. The sample portfolio and any accompanying charts are for informational purposes only and are not to be construed as a solicitation to buy or sell any financial instrument and should not be relied upon as the sole factor in an investment making decision. As a matter of normal and important disclosures to you, as a potential investor, please consider the following: The performance presented is not based on any actual securities trading, portfolio, or accounts, and the reported performance of the A, B, C, D, and F portfolios (collectively the “model portfolios”) should be considered mere “paper” or pro forma performance results based on Navellier’s research.
Investors evaluating any of Navellier & Associates, Inc.’s, (or its affiliates’) Investment Products must not use any information presented here, including the performance figures of the model portfolios, in their evaluation of any Navellier Investment Products. Navellier Investment Products include the firm’s mutual funds and managed accounts. The model portfolios, charts, and other information presented do not represent actual funded trades and are not actual funded portfolios. There are material differences between Navellier Investment Products’ portfolios and the model portfolios, research, and performance figures presented here. The model portfolios and the research results (1) may contain stocks or ETFs that are illiquid and difficult to trade; (2) may contain stock or ETF holdings materially different from actual funded Navellier Investment Product portfolios; (3) include the reinvestment of all dividends and other earnings, estimated trading costs, commissions, or management fees; and, (4) may not reflect prices obtained in an actual funded Navellier Investment Product portfolio. For these and other reasons, the reported performances of model portfolios do not reflect the performance results of Navellier’s actually funded and traded Investment Products. In most cases, Navellier’s Investment Products have materially lower performance results than the performances of the model portfolios presented.
This report contains statements that are, or may be considered to be, forward-looking statements. All statements that are not historical facts, including statements about our beliefs or expectations, are “forward-looking statements” within the meaning of The U.S. Private Securities Litigation Reform Act of 1995. These statements may be identified by such forward-looking terminology as “expect,” “estimate,” “plan,” “intend,” “believe,” “anticipate,” “may,” “will,” “should,” “could,” “continue,” “project,” or similar statements or variations of such terms. Our forward-looking statements are based on a series of expectations, assumptions, and projections, are not guarantees of future results or performance, and involve substantial risks and uncertainty as described in Form ADV Part 2A of our filing with the Securities and Exchange Commission (SEC), which is available at www.adviserinfo.sec.gov or by requesting a copy by emailing info@navellier.com. All of our forward-looking statements are as of the date of this report only. We can give no assurance that such expectations or forward-looking statements will prove to be correct. Actual results may differ materially. You are urged to carefully consider all such factors.
FEDERAL TAX ADVICE DISCLAIMER: As required by U.S. Treasury Regulations, you are informed that, to the extent this presentation includes any federal tax advice, the presentation is not written by Navellier to be used, and cannot be used, for the purpose of avoiding federal tax penalties. Navellier does not advise on any income tax requirements or issues. Use of any information presented by Navellier is for general information only and does not represent tax advice either express or implied. You are encouraged to seek professional tax advice for income tax questions and assistance.
IMPORTANT NEWSLETTER DISCLOSURE:The hypothetical performance results for investment newsletters that are authored or edited by Louis Navellier, including Louis Navellier’s Growth Investor, Louis Navellier’s Breakthrough Stocks, Louis Navellier’s Accelerated Profits, and Louis Navellier’s Platinum Club, are not based on any actual securities trading, portfolio, or accounts, and the newsletters’ reported hypothetical performances should be considered mere “paper” or proforma hypothetical performance results and are not actual performance of real world trades. Navellier & Associates, Inc. does not have any relation to or affiliation with the owner of these newsletters. There are material differences between Navellier Investment Products’ portfolios and the InvestorPlace Media, LLC newsletter portfolios authored by Louis Navellier. The InvestorPlace Media, LLC newsletters contain hypothetical performance that do not include transaction costs, advisory fees, or other fees a client might incur if actual investments and trades were being made by an investor. As a result, newsletter performance should not be used to evaluate Navellier Investment services which are separate and different from the newsletters. The owner of the newsletters is InvestorPlace Media, LLC and any questions concerning the newsletters, including any newsletter advertising or hypothetical Newsletter performance claims, (which are calculated solely by Investor Place Media and not Navellier) should be referred to InvestorPlace Media, LLC at (800) 718-8289.
Please note that Navellier & Associates and the Navellier Private Client Group are managed completely independent of the newsletters owned and published by InvestorPlace Media, LLC and written and edited by Louis Navellier, and investment performance of the newsletters should in no way be considered indicative of potential future investment performance for any Navellier & Associates separately managed account portfolio. Potential investors should consult with their financial advisor before investing in any Navellier Investment Product.
Navellier claims compliance with Global Investment Performance Standards (GIPS). To receive a complete list and descriptions of Navellier’s composites and/or a presentation that adheres to the GIPS standards, please contact Navellier or click here. It should not be assumed that any securities recommendations made by Navellier & Associates, Inc. in the future will be profitable or equal the performance of securities made in this report.
FactSet Disclosure: Navellier does not independently calculate the statistical information included in the attached report. The calculation and the information are provided by FactSet, a company not related to Navellier. Although information contained in the report has been obtained from FactSet and is based on sources Navellier believes to be reliable, Navellier does not guarantee its accuracy, and it may be incomplete or condensed. The report and the related FactSet sourced information are provided on an “as is” basis. The user assumes the entire risk of any use made of this information. Investors should consider the report as only a single factor in making their investment decision. The report is for informational purposes only and is not intended as an offer or solicitation for the purchase or sale of a security. FactSet sourced information is the exclusive property of FactSet. Without prior written permission of FactSet, this information may not be reproduced, disseminated or used to create any financial products. All indices are unmanaged and performance of the indices include reinvestment of dividends and interest income, unless otherwise noted, are not illustrative of any particular investment and an investment cannot be made in any index. Past performance is no guarantee of future results.