
by Bryan Perry
August 4, 2026
The history of financial markets is littered with catastrophic blow-ups, driven by the same lethal cocktail: extreme leverage, often concentrated on directional bets, creating illiquid positions. When market prices move against a highly leveraged firm, the margin calls often arrive faster than the assets can be sold.
In early 2021, Archegos Capital Management built $100 billion in total market exposure on roughly $20 billion in equity. In March, a secondary stock offering by Viacom-CBS triggered a sharp decline. Prime brokers issued margin calls. When Archegos couldn’t meet capital requirements, banks began racing to liquidate tens of billions of dollars in stock on the open market.
Archegos lost its entire $20 billion in days. Credit Suisse suffered over $5.5 billion in losses, a blow from which they never fully recovered, leading to its collapse and forced rescue by UBS two-years later.
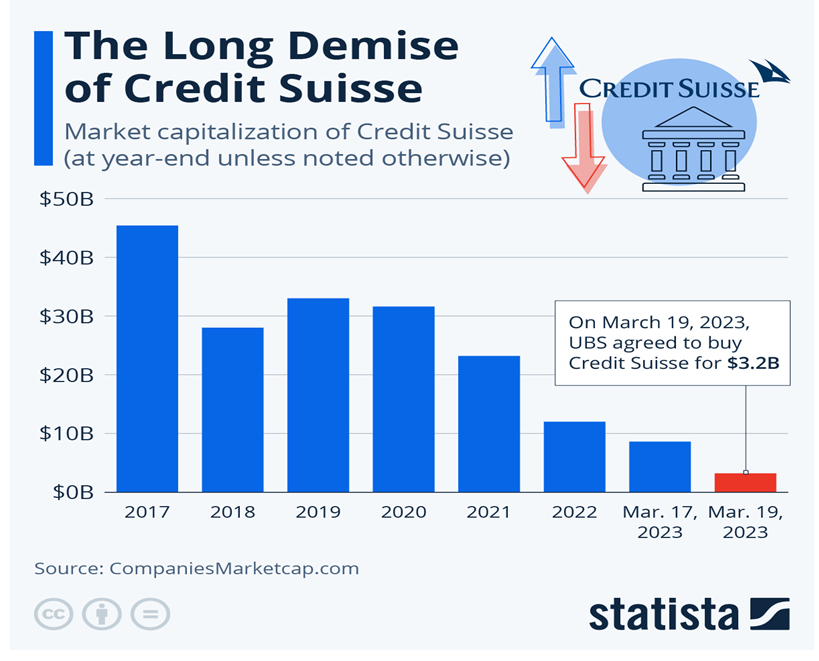
Graphs are for illustrative and discussion purposes only. Please read important disclosures at the end of this commentary.
Most of us saw something like this happen in 1998, when Long-Term Capital Management (LTCM) amassed over $125 billion in balance sheet assets and an estimated $1.25 trillion in total derivative contract exposure based on just $4.7 billion in equity (with leverage ratio exceeding 25:1 to 30:1).
Founded by Salomon Brothers trading legend John Meriwether, along with Nobel Prize-winning economists Myron Scholes and Robert Merton, LTCM operated arbitrage strategies designed to exploit tiny price discrepancies between related fixed-income securities, using extreme leverage.
The blow-up occurred when Russia defaulted on its domestic debt in August 1998, forcing global financial markets to navigate a violent flight to safety. Liquidity evaporated, price spreads widened dramatically, and LTCM’s mathematical risk models collapsed. Facing systemic collapse threatening the global banking sector, the Federal Reserve Bank of New York brokered a $3.65 billion private Wall Street bailout involving 14 major financial institutions to force an orderly liquidation of the fund’s positions.
A decade later, we had to live through the Great Recession, due in large part to a systemic meltdown in a wildly overleveraged subprime mortgage market, spawning movies like “Margin Call” and “The Big Short.” The scene of Stanley Tucci playing the lead risk manager being fired and handing the thumb drive to his junior trader as he gets on the elevator. His short warning was “be careful,” a huge understatement.

The latest sudden collapse of extreme capital is last week’s well-published news of a $20 billion hedge fund, leveraged by 400% blowing up right in the middle of Federal Reserve Chairman Warsh’s press conference triggered a knee-jerk sell-off in the Treasury market, which then rattled the stock market.
Situational Awareness LP, managed by 24-year-old former OpenAI researcher Leopold Aschenbrenner had rapidly grown to manage over $45 billion at its peak in early July 2026, but then it suffered a 67% drawdown, triggering massive margin calls and forced a near-total liquidation of its stock portfolio.

A typical move in this fund would be an aggressively leveraged pair trade (at roughly 4x leverage), such as going long on AI hardware and infrastructure while shorting legacy software incumbents, but both sides of the trade broke simultaneously in July, as core AI hardware holdings fell rapidly – by 40% or more – while the software shorts reversed, delivering a catastrophic blow to the leveraged portfolio.
Prime brokers – the biggest names on Wall Street – issued margin calls on the fund’s public positions. To prevent a chaotic forced market liquidation, Ken Griffin’s Citadel stepped in as a rescue buyer, purchasing the fund’s multi-billion-dollar public equity book in a discounted block transaction.
This is a sign of the times, with leverage rising during spring’s big technology move. As of last week, total FINRA margin debt stood at record absolute levels (around $1.25 trillion to $1.28 trillion).
Whether the market is overleveraged depends on how such leverage is measured: absolute dollar exposure vs. market capitalization. Margin debt as a percentage of total stock market capitalization sits at around 1.8% to 1.9%. This is well within the 50-year historical median range of 1.5% to 2.0%, indicating the total of borrowed money has grown alongside market values rather than drastically outstripping them.
Margin debt relative to U.S. GDP stands at near 4.1%, significantly higher than the long-term median of 1.5%. This tells us investors are taking on aggressive risks relative to the underlying economic output.
While institutional capital remains heavily concentrated in mega-cap tech and AI growth leaders, major hedge funds and multi-manager platforms have rotated into equity market-neutral, quantitative, and low-beta strategies to hedge directional downside. Retail and aggressive momentum traders continue to hold elevated margin debt specifically concentrated in high-beta growth stocks, options, and levered ETFs.
The market isn’t at an unprecedented level of leverage relative to total equity valuations, but it is highly sensitive to unwinding shocks due to near-record absolute debt levels and high concentration in a handful of mega-cap growth leaders. Even if margin-to-market-cap ratios appear benign, high absolute debt reduces the market’s margin for error: When high-multiple growth stocks suffer sudden earnings misses or face rate pressure, leveraged positions face rapid margin calls. Forced selling to cover margin debt can start a feedback loop, turning standard valuation corrections in growth stocks into sharp, volatile sell-offs.
Prime brokers have increasingly altered lending parameters to maintain orderly markets during price shocks. Moving away from traditional end-of-day risk reporting to continuous intraday margin tracking enables prime brokers to detect toxic leverage build-ups as price movements occur, rather than overnight.
Lenders must dynamically scale margin requirements higher on high beta, or crowded, or illiquid assets. Static margin rates give traders cheap borrowing on volatile positions right before market dislocations. Prime brokers must assess a fund’s total aggregate leverage across multiple prime accounts, preventing funds from hiding excessive borrowing by splitting trades across different Wall Street banks.
While domestic economic drivers dominate Wall Street, global capital markets are deeply interconnected through funding currencies, cross-border Treasury holdings and institutional risk models. When leveraged positions in Asia unwind rapidly, the liquidity shock frequently transmits directly to U.S. stocks and fixed income. There is no universal “kill switch” and there is no central regulator with the authority to shut down trading across international stock markets simultaneously. As individual countries and exchanges maintain local emergency mechanisms, global stock trading operates as a decentralized, 24-hour relay race. When systemic selling strikes, stopping it in one jurisdiction just shifts the pressure somewhere else.
While stocks rebounded overnight last week, due to the quick actions taken, delivering a sharp rally induced by big AI-related quarterly results the U.S. market isn’t fully isolated from highly leveraged Asian markets posing a tangible spillover risk to U.S. financial markets.
With Ken Griffin’s Citadel buying out Situational Awareness’s public equities in a block transaction, this prevented a chaotic open-market fire sale. By absorbing the bulk of those concentrated positions off-exchange, Citadel prevented an immediate domino effect across other funds holding identical portfolios.
All content above represents the opinion of Bryan Perry of Navellier & Associates, Inc.
Also In This Issue
A Look Ahead by Louis Navellier
Powerful Earnings Could Override the August “Doldrums”
Income Mail by Bryan Perry
Lowering Leverage Before Leverage Runs Riot…Again
Growth Mail by Gary Alexander
The Worst Midterm Election Reversals – Often Spark the Sharpest Market Recoveries
Global Mail by Ivan Martchev
When Bonds Revolt Against the Fed
Sector Spotlight by Jason Bodner
When Big Bets Explode – On High Leverage – Disaster Often Follows
View Full Archive
Read Past Issues Here

Bryan Perry
SENIOR DIRECTOR
Bryan Perry is a Senior Director with Navellier Private Client Group, advising and facilitating high net worth investors in the pursuit of their financial goals.
Bryan’s financial services career spanning the past three decades includes over 20-years of wealth management experience with Wall Street firms that include Bear Stearns, Lehman Brothers and Paine Webber, working with both retail and institutional clients. Bryan earned a B.A. in Political Science from Virginia Polytechnic Institute & State University and currently holds a Series 65 license. All content of “Income Mail” represents the opinion of Bryan Perry
Important Disclosures:
Although information in these reports has been obtained from and is based upon sources that Navellier believes to be reliable, Navellier does not guarantee its accuracy and it may be incomplete or condensed. All opinions and estimates constitute Navellier’s judgment as of the date the report was created and are subject to change without notice. These reports are for informational purposes only and are not a solicitation for the purchase or sale of a security. Any decision to purchase securities mentioned in these reports must take into account existing public information on such securities or any registered prospectus.To the extent permitted by law, neither Navellier & Associates, Inc., nor any of its affiliates, agents, or service providers assumes any liability or responsibility nor owes any duty of care for any consequences of any person acting or refraining to act in reliance on the information contained in this communication or for any decision based on it.
Past performance is no indication of future results. Investment in securities involves significant risk and has the potential for partial or complete loss of funds invested. It should not be assumed that any securities recommendations made by Navellier. in the future will be profitable or equal the performance of securities made in this report. Dividend payments are not guaranteed. The amount of a dividend payment, if any, can vary over time and issuers may reduce dividends paid on securities in the event of a recession or adverse event affecting a specific industry or issuer.
None of the stock information, data, and company information presented herein constitutes a recommendation by Navellier or a solicitation to buy or sell any securities. Any specific securities identified and described do not represent all of the securities purchased, sold, or recommended for advisory clients. The holdings identified do not represent all of the securities purchased, sold, or recommended for advisory clients and the reader should not assume that investments in the securities identified and discussed were or will be profitable.
Information presented is general information that does not take into account your individual circumstances, financial situation, or needs, nor does it present a personalized recommendation to you. Individual stocks presented may not be suitable for every investor. Investment in securities involves significant risk and has the potential for partial or complete loss of funds invested. Investment in fixed income securities has the potential for the investment return and principal value of an investment to fluctuate so that an investor’s holdings, when redeemed, may be worth less than their original cost.
One cannot invest directly in an index. Index is unmanaged and index performance does not reflect deduction of fees, expenses, or taxes. Presentation of Index data does not reflect a belief by Navellier that any stock index constitutes an investment alternative to any Navellier equity strategy or is necessarily comparable to such strategies. Among the most important differences between the Indices and Navellier strategies are that the Navellier equity strategies may (1) incur material management fees, (2) concentrate its investments in relatively few stocks, industries, or sectors, (3) have significantly greater trading activity and related costs, and (4) be significantly more or less volatile than the Indices.
ETF Risk: We may invest in exchange traded funds (“ETFs”) and some of our investment strategies are generally fully invested in ETFs. Like traditional mutual funds, ETFs charge asset-based fees, but they generally do not charge initial sales charges or redemption fees and investors typically pay only customary brokerage fees to buy and sell ETF shares. The fees and costs charged by ETFs held in client accounts will not be deducted from the compensation the client pays Navellier. ETF prices can fluctuate up or down, and a client account could lose money investing in an ETF if the prices of the securities owned by the ETF go down. ETFs are subject to additional risks:
- ETF shares may trade above or below their net asset value;
- An active trading market for an ETF’s shares may not develop or be maintained;
- The value of an ETF may be more volatile than the underlying portfolio of securities the ETF is designed to track;
- The cost of owning shares of the ETF may exceed those a client would incur by directly investing in the underlying securities; and
- Trading of an ETF’s shares may be halted if the listing exchange’s officials deem it appropriate, the shares are delisted from the exchange, or the activation of market-wide “circuit breakers” (which are tied to large decreases in stock prices) halts stock trading generally.
Grader Disclosures: Investment in equity strategies involves substantial risk and has the potential for partial or complete loss of funds invested. The sample portfolio and any accompanying charts are for informational purposes only and are not to be construed as a solicitation to buy or sell any financial instrument and should not be relied upon as the sole factor in an investment making decision. As a matter of normal and important disclosures to you, as a potential investor, please consider the following: The performance presented is not based on any actual securities trading, portfolio, or accounts, and the reported performance of the A, B, C, D, and F portfolios (collectively the “model portfolios”) should be considered mere “paper” or pro forma performance results based on Navellier’s research.
Investors evaluating any of Navellier & Associates, Inc.’s, (or its affiliates’) Investment Products must not use any information presented here, including the performance figures of the model portfolios, in their evaluation of any Navellier Investment Products. Navellier Investment Products include the firm’s mutual funds and managed accounts. The model portfolios, charts, and other information presented do not represent actual funded trades and are not actual funded portfolios. There are material differences between Navellier Investment Products’ portfolios and the model portfolios, research, and performance figures presented here. The model portfolios and the research results (1) may contain stocks or ETFs that are illiquid and difficult to trade; (2) may contain stock or ETF holdings materially different from actual funded Navellier Investment Product portfolios; (3) include the reinvestment of all dividends and other earnings, estimated trading costs, commissions, or management fees; and, (4) may not reflect prices obtained in an actual funded Navellier Investment Product portfolio. For these and other reasons, the reported performances of model portfolios do not reflect the performance results of Navellier’s actually funded and traded Investment Products. In most cases, Navellier’s Investment Products have materially lower performance results than the performances of the model portfolios presented.
This report contains statements that are, or may be considered to be, forward-looking statements. All statements that are not historical facts, including statements about our beliefs or expectations, are “forward-looking statements” within the meaning of The U.S. Private Securities Litigation Reform Act of 1995. These statements may be identified by such forward-looking terminology as “expect,” “estimate,” “plan,” “intend,” “believe,” “anticipate,” “may,” “will,” “should,” “could,” “continue,” “project,” or similar statements or variations of such terms. Our forward-looking statements are based on a series of expectations, assumptions, and projections, are not guarantees of future results or performance, and involve substantial risks and uncertainty as described in Form ADV Part 2A of our filing with the Securities and Exchange Commission (SEC), which is available at www.adviserinfo.sec.gov or by requesting a copy by emailing info@navellier.com. All of our forward-looking statements are as of the date of this report only. We can give no assurance that such expectations or forward-looking statements will prove to be correct. Actual results may differ materially. You are urged to carefully consider all such factors.
FEDERAL TAX ADVICE DISCLAIMER: As required by U.S. Treasury Regulations, you are informed that, to the extent this presentation includes any federal tax advice, the presentation is not written by Navellier to be used, and cannot be used, for the purpose of avoiding federal tax penalties. Navellier does not advise on any income tax requirements or issues. Use of any information presented by Navellier is for general information only and does not represent tax advice either express or implied. You are encouraged to seek professional tax advice for income tax questions and assistance.
IMPORTANT NEWSLETTER DISCLOSURE:The hypothetical performance results for investment newsletters that are authored or edited by Louis Navellier, including Louis Navellier’s Growth Investor, Louis Navellier’s Breakthrough Stocks, Louis Navellier’s Accelerated Profits, and Louis Navellier’s Platinum Club, are not based on any actual securities trading, portfolio, or accounts, and the newsletters’ reported hypothetical performances should be considered mere “paper” or proforma hypothetical performance results and are not actual performance of real world trades. Navellier & Associates, Inc. does not have any relation to or affiliation with the owner of these newsletters. There are material differences between Navellier Investment Products’ portfolios and the InvestorPlace Media, LLC newsletter portfolios authored by Louis Navellier. The InvestorPlace Media, LLC newsletters contain hypothetical performance that do not include transaction costs, advisory fees, or other fees a client might incur if actual investments and trades were being made by an investor. As a result, newsletter performance should not be used to evaluate Navellier Investment services which are separate and different from the newsletters. The owner of the newsletters is InvestorPlace Media, LLC and any questions concerning the newsletters, including any newsletter advertising or hypothetical Newsletter performance claims, (which are calculated solely by Investor Place Media and not Navellier) should be referred to InvestorPlace Media, LLC at (800) 718-8289.
Please note that Navellier & Associates and the Navellier Private Client Group are managed completely independent of the newsletters owned and published by InvestorPlace Media, LLC and written and edited by Louis Navellier, and investment performance of the newsletters should in no way be considered indicative of potential future investment performance for any Navellier & Associates separately managed account portfolio. Potential investors should consult with their financial advisor before investing in any Navellier Investment Product.
Navellier claims compliance with Global Investment Performance Standards (GIPS). To receive a complete list and descriptions of Navellier’s composites and/or a presentation that adheres to the GIPS standards, please contact Navellier or click here. It should not be assumed that any securities recommendations made by Navellier & Associates, Inc. in the future will be profitable or equal the performance of securities made in this report.
FactSet Disclosure: Navellier does not independently calculate the statistical information included in the attached report. The calculation and the information are provided by FactSet, a company not related to Navellier. Although information contained in the report has been obtained from FactSet and is based on sources Navellier believes to be reliable, Navellier does not guarantee its accuracy, and it may be incomplete or condensed. The report and the related FactSet sourced information are provided on an “as is” basis. The user assumes the entire risk of any use made of this information. Investors should consider the report as only a single factor in making their investment decision. The report is for informational purposes only and is not intended as an offer or solicitation for the purchase or sale of a security. FactSet sourced information is the exclusive property of FactSet. Without prior written permission of FactSet, this information may not be reproduced, disseminated or used to create any financial products. All indices are unmanaged and performance of the indices include reinvestment of dividends and interest income, unless otherwise noted, are not illustrative of any particular investment and an investment cannot be made in any index. Past performance is no guarantee of future results.