by Bryan Perry
August 1, 2023
Rising interest rates, commercial real estate losses, and increased regulatory scrutiny were the buzz phrases facing the regional bank sector in late May and early June, following the collapse of Silicon Valley Bank, Silvergate Bank, Signature Bank, and First Republic. In response to the first failures in late February and March, the Federal Reserve established the Bank Term Funding Program (BTFP) to offer loans of up to one year to eligible depository institutions pledging qualifying assets as collateral.
FRC was closed and sold to JPMorgan Chase & Co. (JPM) on May 1. Since that time, which now seems so long ago, there has not been much in the way of negative bank headlines. After all, the Fed threw the regional bank sector an unlimited line of credit, in which the BTFP authorizes banks to borrow against eligible holdings up to par value rather than market value, a very special arrangement to say the least.
Since bottoming out in early May, the regional bank sector, as measured by the S&P Regional Banking Sector ETF (KRE), has recovered a little more than half its losses from the earlier collapse that took the sector down 46%. But the regionals were already in a protracted downtrend dating back to when the Fed began raising rates in March 2022. Eleven rate hikes later, they are telegraphing that they are not done.
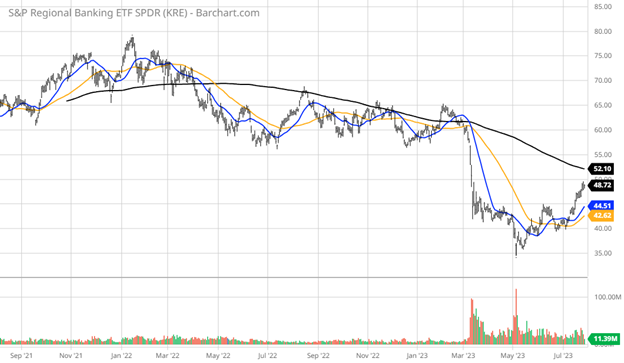
Graphs are for illustrative and discussion purposes only. Please read important disclosures at the end of this commentary.
Despite the rally of late, it stands to reason that many of the forces that triggered the regional banking crises in March are still at work. A further bump in interest rates only puts more downside pressure on valuations of securities held by banks, while continuing to incentivize savers to pull money from their accounts, seeking higher yields elsewhere. The biggest brokerage firms are paying around 5% for money market deposits. Those same investors are buying 6-month T-bills yielding 5.5% as of last Friday, making cash management pretty much a no-brainer. Cash goes where it is best served.
The big elephant in the room – losses on commercial real estate loans – are just beginning to show up as a clear and present danger to bank balance sheets. As such, there is likely to be a tsunami of bank mergers forthcoming. Half the country’s banks will likely be swallowed up by competitors in the next decade, according to Fitch analyst Chris Wolfe. “Some of these banks will survive by being the buyer rather than the target,” said incoming Lazard CEO Peter Orszag. “We could see over time fewer, larger regionals.”
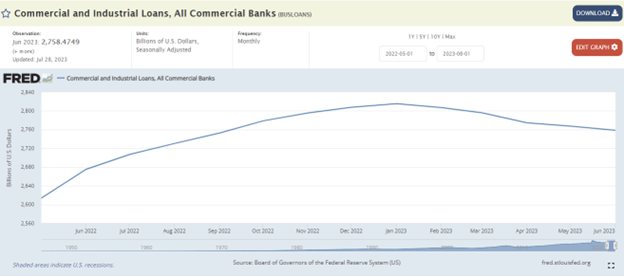
Here are a couple of interesting charts. Even as the Fed has quietly increased M2 money supply since April to facilitate more lending by banks, demand for commercial and industrial loans has weakened.
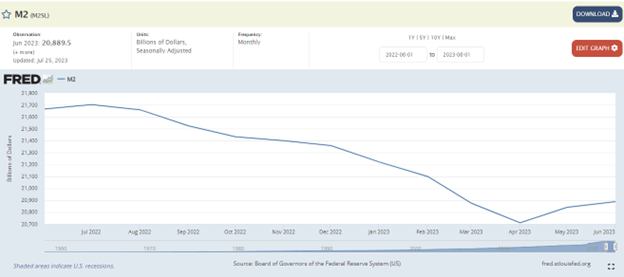
Graphs are for illustrative and discussion purposes only. Please read important disclosures at the end of this commentary.
Commercial and Industrial (C&I) loans are loans made to businesses or corporations, not to individual consumers. These loans can be used for a variety of purposes, including capital expenditures (like buying equipment), and providing working capital for day-to-day operations. They are typically short-term loans with variable interest rates. C&I loans are a key driver of economic growth because they provide small-to-medium sized businesses with the funds they need to expand, invest, and hire, which can stimulate economic activity. They are a major line of business for many banking firms, but as interest rates have risen, it has become more expensive for banks to borrow capital to lend out. This increased cost is typically passed on to businesses in the form of higher interest rates on commercial and industrial loans.
Graphs are for illustrative and discussion purposes only. Please read important disclosures at the end of this commentary.
So, with the cost of capital now the highest it has been in over two years, businesses are more hesitant to take on debt, especially floating rate debt, which in turn will likely show up in depressed earnings growth for banks in upcoming quarters. This downward trend in loan demand is being aggravated by a rising rate of delinquencies on commercial property coupled with defaults and foreclosures on residential properties.
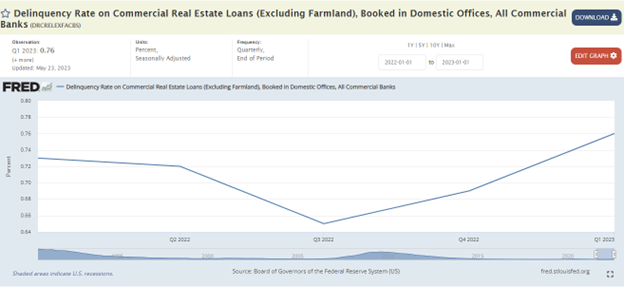
Graphs are for illustrative and discussion purposes only. Please read important disclosures at the end of this commentary.
ATTOM, a leading curator of land, property, and real estate data, released its Q1 2023 U.S. Foreclosure Activity Report, which shows a total of 95,712 U.S. properties with foreclosure filings during the first quarter of 2023, up 6 percent from the previous quarter and up 22 percent from a year ago.
The report also shows a total of 36,617 U.S. properties with foreclosure filings in March 2023, up 20 percent from the previous month and 10 percent from a year ago — the 23rd consecutive month with a year-over-year increase in foreclosure activity. A total of 65,346 U.S. properties started the foreclosure process in Q1 2023, up 3 percent from the previous quarter and up 29 percent from a year ago. (Source: https://www.attomdata.com/news/market-trends/foreclosures/attom-q1-2023-u-s-foreclosure-market-report/)
Bear in mind, these are first-quarter numbers, three rate hikes ago. I would venture to say that when the second-quarter data is released, they will show further deterioration, reflected in future bank sales and earnings forecasts and final quarterly results. In my view, the Fed is in its own self-made bind, fighting an inflation that it failed to address early on, being too relaxed on banks with under $250 million in deposits, and now staring at gas prices hitting an 8-month high with the CRB index trading at a 10-month high.
While the market has indeed broadened out in the number of sectors participating in this summer rally, one might consider how much of a weighting that regional banks should occupy in one’s portfolio.
Navellier & Associates does not own JPMorgan Chase & Co. (JPM) in managed accounts. Bryan Perry does not own JPMorgan Chase & Co. (JPM) personally.
All content above represents the opinion of Bryan Perry of Navellier & Associates, Inc.
Also In This Issue
A Look Ahead by Louis Navellier
Four Key Sectors to Consider Now
Income Mail by Bryan Perry
The Fed’s Latest Rate Increase and Its Impact on Regional Banks
Growth Mail by Gary Alexander
Economics – The Bountiful Science
Global Mail by Ivan Martchev
The Last ZIRP Man Standing
Sector Spotlight by Jason Bodner
To Broadcast the Truth the Loudest… Whisper It
View Full Archive
Read Past Issues Here

Bryan Perry
SENIOR DIRECTOR
Bryan Perry is a Senior Director with Navellier Private Client Group, advising and facilitating high net worth investors in the pursuit of their financial goals.
Bryan’s financial services career spanning the past three decades includes over 20 years of wealth management experience with Wall Street firms that include Bear Stearns, Lehman Brothers and Paine Webber, working with both retail and institutional clients. Bryan earned a B.A. in Political Science from Virginia Polytechnic Institute & State University and currently holds a Series 65 license. All content of “Income Mail” represents the opinion of Bryan Perry
Important Disclosures:
Although information in these reports has been obtained from and is based upon sources that Navellier believes to be reliable, Navellier does not guarantee its accuracy and it may be incomplete or condensed. All opinions and estimates constitute Navellier’s judgment as of the date the report was created and are subject to change without notice. These reports are for informational purposes only and are not a solicitation for the purchase or sale of a security. Any decision to purchase securities mentioned in these reports must take into account existing public information on such securities or any registered prospectus.To the extent permitted by law, neither Navellier & Associates, Inc., nor any of its affiliates, agents, or service providers assumes any liability or responsibility nor owes any duty of care for any consequences of any person acting or refraining to act in reliance on the information contained in this communication or for any decision based on it.
Past performance is no indication of future results. Investment in securities involves significant risk and has the potential for partial or complete loss of funds invested. It should not be assumed that any securities recommendations made by Navellier. in the future will be profitable or equal the performance of securities made in this report. Dividend payments are not guaranteed. The amount of a dividend payment, if any, can vary over time and issuers may reduce dividends paid on securities in the event of a recession or adverse event affecting a specific industry or issuer.
None of the stock information, data, and company information presented herein constitutes a recommendation by Navellier or a solicitation to buy or sell any securities. Any specific securities identified and described do not represent all of the securities purchased, sold, or recommended for advisory clients. The holdings identified do not represent all of the securities purchased, sold, or recommended for advisory clients and the reader should not assume that investments in the securities identified and discussed were or will be profitable.
Information presented is general information that does not take into account your individual circumstances, financial situation, or needs, nor does it present a personalized recommendation to you. Individual stocks presented may not be suitable for every investor. Investment in securities involves significant risk and has the potential for partial or complete loss of funds invested. Investment in fixed income securities has the potential for the investment return and principal value of an investment to fluctuate so that an investor’s holdings, when redeemed, may be worth less than their original cost.
One cannot invest directly in an index. Index is unmanaged and index performance does not reflect deduction of fees, expenses, or taxes. Presentation of Index data does not reflect a belief by Navellier that any stock index constitutes an investment alternative to any Navellier equity strategy or is necessarily comparable to such strategies. Among the most important differences between the Indices and Navellier strategies are that the Navellier equity strategies may (1) incur material management fees, (2) concentrate its investments in relatively few stocks, industries, or sectors, (3) have significantly greater trading activity and related costs, and (4) be significantly more or less volatile than the Indices.
ETF Risk: We may invest in exchange traded funds (“ETFs”) and some of our investment strategies are generally fully invested in ETFs. Like traditional mutual funds, ETFs charge asset-based fees, but they generally do not charge initial sales charges or redemption fees and investors typically pay only customary brokerage fees to buy and sell ETF shares. The fees and costs charged by ETFs held in client accounts will not be deducted from the compensation the client pays Navellier. ETF prices can fluctuate up or down, and a client account could lose money investing in an ETF if the prices of the securities owned by the ETF go down. ETFs are subject to additional risks:
- ETF shares may trade above or below their net asset value;
- An active trading market for an ETF’s shares may not develop or be maintained;
- The value of an ETF may be more volatile than the underlying portfolio of securities the ETF is designed to track;
- The cost of owning shares of the ETF may exceed those a client would incur by directly investing in the underlying securities; and
- Trading of an ETF’s shares may be halted if the listing exchange’s officials deem it appropriate, the shares are delisted from the exchange, or the activation of market-wide “circuit breakers” (which are tied to large decreases in stock prices) halts stock trading generally.
Grader Disclosures: Investment in equity strategies involves substantial risk and has the potential for partial or complete loss of funds invested. The sample portfolio and any accompanying charts are for informational purposes only and are not to be construed as a solicitation to buy or sell any financial instrument and should not be relied upon as the sole factor in an investment making decision. As a matter of normal and important disclosures to you, as a potential investor, please consider the following: The performance presented is not based on any actual securities trading, portfolio, or accounts, and the reported performance of the A, B, C, D, and F portfolios (collectively the “model portfolios”) should be considered mere “paper” or pro forma performance results based on Navellier’s research.
Investors evaluating any of Navellier & Associates, Inc.’s, (or its affiliates’) Investment Products must not use any information presented here, including the performance figures of the model portfolios, in their evaluation of any Navellier Investment Products. Navellier Investment Products include the firm’s mutual funds and managed accounts. The model portfolios, charts, and other information presented do not represent actual funded trades and are not actual funded portfolios. There are material differences between Navellier Investment Products’ portfolios and the model portfolios, research, and performance figures presented here. The model portfolios and the research results (1) may contain stocks or ETFs that are illiquid and difficult to trade; (2) may contain stock or ETF holdings materially different from actual funded Navellier Investment Product portfolios; (3) include the reinvestment of all dividends and other earnings, estimated trading costs, commissions, or management fees; and, (4) may not reflect prices obtained in an actual funded Navellier Investment Product portfolio. For these and other reasons, the reported performances of model portfolios do not reflect the performance results of Navellier’s actually funded and traded Investment Products. In most cases, Navellier’s Investment Products have materially lower performance results than the performances of the model portfolios presented.
This report contains statements that are, or may be considered to be, forward-looking statements. All statements that are not historical facts, including statements about our beliefs or expectations, are “forward-looking statements” within the meaning of The U.S. Private Securities Litigation Reform Act of 1995. These statements may be identified by such forward-looking terminology as “expect,” “estimate,” “plan,” “intend,” “believe,” “anticipate,” “may,” “will,” “should,” “could,” “continue,” “project,” or similar statements or variations of such terms. Our forward-looking statements are based on a series of expectations, assumptions, and projections, are not guarantees of future results or performance, and involve substantial risks and uncertainty as described in Form ADV Part 2A of our filing with the Securities and Exchange Commission (SEC), which is available at www.adviserinfo.sec.gov or by requesting a copy by emailing info@navellier.com. All of our forward-looking statements are as of the date of this report only. We can give no assurance that such expectations or forward-looking statements will prove to be correct. Actual results may differ materially. You are urged to carefully consider all such factors.
FEDERAL TAX ADVICE DISCLAIMER: As required by U.S. Treasury Regulations, you are informed that, to the extent this presentation includes any federal tax advice, the presentation is not written by Navellier to be used, and cannot be used, for the purpose of avoiding federal tax penalties. Navellier does not advise on any income tax requirements or issues. Use of any information presented by Navellier is for general information only and does not represent tax advice either express or implied. You are encouraged to seek professional tax advice for income tax questions and assistance.
IMPORTANT NEWSLETTER DISCLOSURE:The hypothetical performance results for investment newsletters that are authored or edited by Louis Navellier, including Louis Navellier’s Growth Investor, Louis Navellier’s Breakthrough Stocks, Louis Navellier’s Accelerated Profits, and Louis Navellier’s Platinum Club, are not based on any actual securities trading, portfolio, or accounts, and the newsletters’ reported hypothetical performances should be considered mere “paper” or proforma hypothetical performance results and are not actual performance of real world trades. Navellier & Associates, Inc. does not have any relation to or affiliation with the owner of these newsletters. There are material differences between Navellier Investment Products’ portfolios and the InvestorPlace Media, LLC newsletter portfolios authored by Louis Navellier. The InvestorPlace Media, LLC newsletters contain hypothetical performance that do not include transaction costs, advisory fees, or other fees a client might incur if actual investments and trades were being made by an investor. As a result, newsletter performance should not be used to evaluate Navellier Investment services which are separate and different from the newsletters. The owner of the newsletters is InvestorPlace Media, LLC and any questions concerning the newsletters, including any newsletter advertising or hypothetical Newsletter performance claims, (which are calculated solely by Investor Place Media and not Navellier) should be referred to InvestorPlace Media, LLC at (800) 718-8289.
Please note that Navellier & Associates and the Navellier Private Client Group are managed completely independent of the newsletters owned and published by InvestorPlace Media, LLC and written and edited by Louis Navellier, and investment performance of the newsletters should in no way be considered indicative of potential future investment performance for any Navellier & Associates separately managed account portfolio. Potential investors should consult with their financial advisor before investing in any Navellier Investment Product.
Navellier claims compliance with Global Investment Performance Standards (GIPS). To receive a complete list and descriptions of Navellier’s composites and/or a presentation that adheres to the GIPS standards, please contact Navellier or click here. It should not be assumed that any securities recommendations made by Navellier & Associates, Inc. in the future will be profitable or equal the performance of securities made in this report.
FactSet Disclosure: Navellier does not independently calculate the statistical information included in the attached report. The calculation and the information are provided by FactSet, a company not related to Navellier. Although information contained in the report has been obtained from FactSet and is based on sources Navellier believes to be reliable, Navellier does not guarantee its accuracy, and it may be incomplete or condensed. The report and the related FactSet sourced information are provided on an “as is” basis. The user assumes the entire risk of any use made of this information. Investors should consider the report as only a single factor in making their investment decision. The report is for informational purposes only and is not intended as an offer or solicitation for the purchase or sale of a security. FactSet sourced information is the exclusive property of FactSet. Without prior written permission of FactSet, this information may not be reproduced, disseminated or used to create any financial products. All indices are unmanaged and performance of the indices include reinvestment of dividends and interest income, unless otherwise noted, are not illustrative of any particular investment and an investment cannot be made in any index. Past performance is no guarantee of future results.