by Jason Bodner
July 25, 2023
I’m a ‘70’s kid, which means I’m nostalgic about 80’s movies. One of my favorites was WarGames (1983), with Matthew Broderick. There was a poignant scene (hopefully I’m not giving anything away if you haven’t seen the 40-year-old movie) which snaps things into focus. Joshua – the war-simulating supercomputer – has a sentient AI moment and says to Dr. Stephen Falken (based on Stephen Hawking):
“The only winning move is not to play.”
Translated to market-speak: “Sometimes the winning play is to do nothing.” Sit still. Don’t trade.
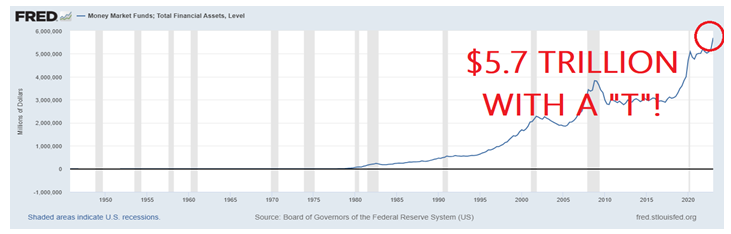
That’s where we are right now. The market has been rising in what seems like an “unbelievable” way, to many spectators. In hindsight, we can now see it was better to be invested. But instead, we know that the record amounts of cash on the sidelines back in May actually grew larger! According to Federal Reserve data (at FRED.org), cash in money markets grew from just over $5 trillion in Q3’22 to $5.7T in Q2’23.
That’s a lot of dollars sitting in mothballs – the highest on record, in fact.
Graphs are for illustrative and discussion purposes only. Please read important disclosures at the end of this commentary.
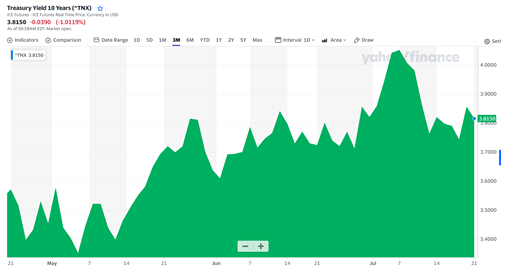
This huge market rally happened without new cash. The S&P 500 rallied 29% since last October’s lows as idle cash grew by $700 billion. The investing masses were waiting for the inflation war to be over and for a recession to strike, or rates to stop rising. And now, with market interest rates falling from over 4% in early July to 3.8% lately, the Fed is unlikely to raise rates further in future FOMC meetings.
Graphs are for illustrative and discussion purposes only. Please read important disclosures at the end of this commentary.
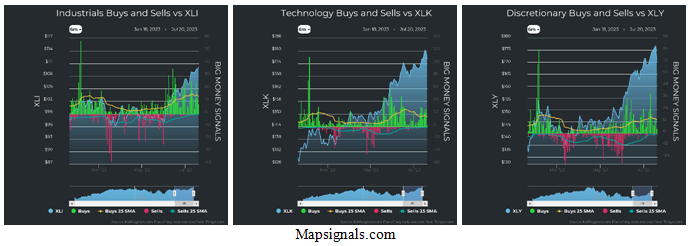
These trends are now being reflected in the sectors that have been benefiting since the latest market lows. We have seen an immense rise in tech, discretionary, and industrials stocks. These are the growth sectors that we want to see leading a bull market surge. Just look at those sectors since October:
Graphs are for illustrative and discussion purposes only. Please read important disclosures at the end of this commentary.
It seems like the smart money folks knew ahead of time that this year would deliver a solution to vicious inflation. The Consumer Price Index – the major yardstick for inflation – fell from a peak of 9.2% in June 2022 to 3% in June 2023, according to the latest readings. The Fed’s goal is 2%. We are almost there.
When we see reassuring language from the Fed that seems to imply that “the coast is clear,” like the lifeguard yelling, “Everyone back in the pool!” after a lightning scare, that’s when we’ll likely see the money market chart start dropping. And when it does, what do you think will happen to the stock market?
It will likely go up – much more than we have witnessed in the past few months.
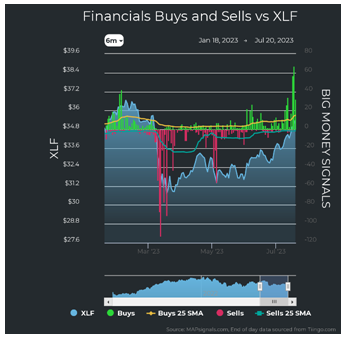
And we are already seeing signs in other sectors. Financials just recently saw immense buying:
Graphs are for illustrative and discussion purposes only. Please read important disclosures at the end of this commentary.
Our studies have shown that buying like this often precedes big rises in the sector. Mapsignals.com research says: “XLF jumps 9.1% 3-months after such a buying spree (33% of the financials universe on a single day). Wait a year and the forward average ramps to 28.9% with a 100% positive hit rate!”
We are also seeing buying in other sectors. Energy and Materials stocks recently are getting bought up:
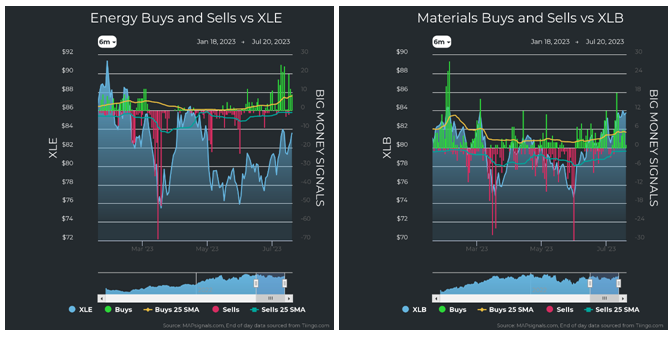
Graphs are for illustrative and discussion purposes only. Please read important disclosures at the end of this commentary.
Even Real Estate stocks have been under accumulation:
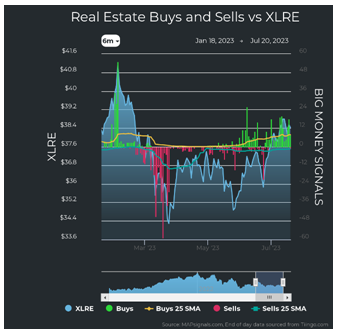
Graphs are for illustrative and discussion purposes only. Please read important disclosures at the end of this commentary.
This leaves Health Care, Utilities, and Communications. They haven’t been sold much, but they haven’t seen material buying either. And that’s fine. The growth areas are undisputedly leading the market higher. We can see that not just in the charts, but also in the sector index returns.
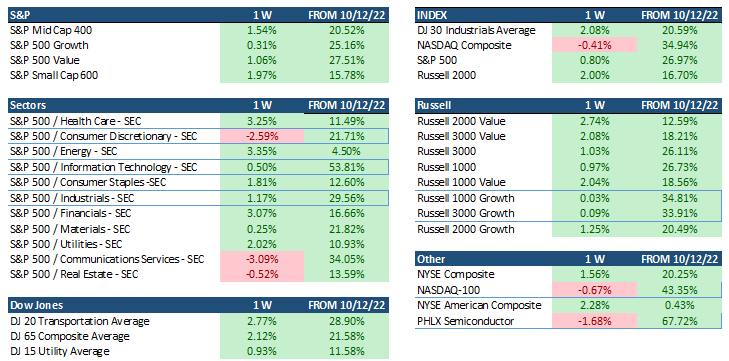
In the table below, I map returns since last October’s lows to show just how intense this rally has been:
Graphs are for illustrative and discussion purposes only. Please read important disclosures at the end of this commentary.
I took the liberty of highlighting the most powerful sectors. As you can see – they are growth sectors: PHLX Semiconductors (+67.7%), S&P 500: Info-Tech (+53.8%), and the NASDAQ 100 (+43.35%).
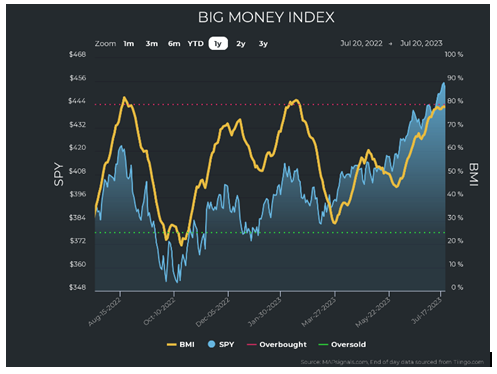
Tech has clearly led the way. This is interesting because it was the sector that sustained the heaviest damage during 2022. The takeaway is that although tech may feel “lofty” now (which it is), that doesn’t mean it can’t rise much farther. That fact is echoed in the Big Money Index (BMI).
As we can see in the chart below, the BMI has been steadily on the rise towards becoming overbought:
Graphs are for illustrative and discussion purposes only. Please read important disclosures at the end of this commentary.
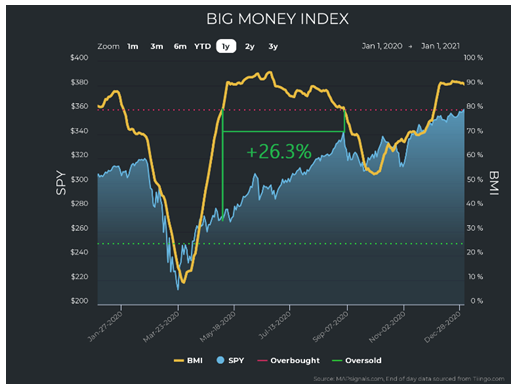
But do not fear an overbought BMI. It can stay overbought for a long time. Back in 2020, from April through the summer, the BMI remained overbought for 84 trading days. We must pay attention to when it starts falling from overbought. That’s the telltale sign that volatility is near. We are not there yet.
So, I’d say the winning move is to do nothing right now, if you’re fully invested. People eager to take profits might miss out on significantly more upside. That extended overbought period in 2020 shows why. If profit hungry investors sold at the first sign of overbought – they missed out on huge gains of 26%:
Graphs are for illustrative and discussion purposes only. Please read important disclosures at the end of this commentary.
The key is that money is flowing into the market, lifting stocks. Let it continue until there are signs that it won’t. For now, there are no such signs. Right now, the winning move is to do nothing, based on the data.
There will, of course, be volatility and unexpected down days. We saw that last week. Disappointing earnings and a pending NASDAQ rebalance of big tech stocks this week is causing some turbulence in tech stocks this week. But don’t get stuck on news stories too much. Remember the March “regional banking crisis”? It’s funny, no one really talks about it any longer, even though it was THE talk back then. The XLF has rallied roughly 17% since then. And only now are we seeing big buying in financials.
The moral of the story is, “Don’t get swept up in the story of the moment.” Instead, focus on the data and what it tells us, which now is: Big money is moving into stocks – and it’s only just begun.
There are still bushels of cash on the sidelines (the largest amount on record) and growth sectors continue to power the market higher. It’s not time to sit it out. Rallies have a habit of happening before anyone realizes they are happening. This one seems like no exception – as no one really expected it. (Well, nobody expected this rally, except us and a few others, as an oversold BMI dictated a rise was coming).
As Joshua, the computer in WarGames (1983), might have said to investors: “Shall we play a game?”
All content above represents the opinion of Jason Bodner of Navellier & Associates, Inc.
Also In This Issue
A Look Ahead by Louis Navellier
China is “Losing its Mojo” Under Dictator-for-Life, Xi Jinping
Income Mail by Bryan Perry
A Rally in The Energy Sector Is Taking Shape
Growth Mail by Gary Alexander
Huge Boomer Assets Should Fuel More Market Growth
Global Mail by Ivan Martchev
The Broad Market Finds its Pulse
Sector Spotlight by Jason Bodner
Record Cash on Sidelines Says Millions Missed this Rally
View Full Archive
Read Past Issues Here

Jason Bodner
MARKETMAIL EDITOR FOR SECTOR SPOTLIGHT
Jason Bodner writes Sector Spotlight in the weekly Marketmail publication and has authored several white papers for the company. He is also Co-Founder of Macro Analytics for Professionals which produces proprietary equity accumulation/distribution research for its clients. Previously, Mr. Bodner served as Director of European Equity Derivatives for Cantor Fitzgerald Europe in London, then moved to the role of Head of Equity Derivatives North America for the same company in New York. He also served as S.V.P. Equity Derivatives for Jefferies, LLC. He received a B.S. in business administration in 1996, with honors, from Skidmore College as a member of the Periclean Honors Society. All content of “Sector Spotlight” represents the opinion of Jason Bodner
Important Disclosures:
Jason Bodner is a co-founder and co-owner of Mapsignals. Mr. Bodner is an independent contractor who is occasionally hired by Navellier & Associates to write an article and or provide opinions for possible use in articles that appear in Navellier & Associates weekly Market Mail. Mr. Bodner is not employed or affiliated with Louis Navellier, Navellier & Associates, Inc., or any other Navellier owned entity. The opinions and statements made here are those of Mr. Bodner and not necessarily those of any other persons or entities. This is not an endorsement, or solicitation or testimonial or investment advice regarding the BMI Index or any statements or recommendations or analysis in the article or the BMI Index or Mapsignals or its products or strategies.
Although information in these reports has been obtained from and is based upon sources that Navellier believes to be reliable, Navellier does not guarantee its accuracy and it may be incomplete or condensed. All opinions and estimates constitute Navellier’s judgment as of the date the report was created and are subject to change without notice. These reports are for informational purposes only and are not a solicitation for the purchase or sale of a security. Any decision to purchase securities mentioned in these reports must take into account existing public information on such securities or any registered prospectus.To the extent permitted by law, neither Navellier & Associates, Inc., nor any of its affiliates, agents, or service providers assumes any liability or responsibility nor owes any duty of care for any consequences of any person acting or refraining to act in reliance on the information contained in this communication or for any decision based on it.
Past performance is no indication of future results. Investment in securities involves significant risk and has the potential for partial or complete loss of funds invested. It should not be assumed that any securities recommendations made by Navellier. in the future will be profitable or equal the performance of securities made in this report. Dividend payments are not guaranteed. The amount of a dividend payment, if any, can vary over time and issuers may reduce dividends paid on securities in the event of a recession or adverse event affecting a specific industry or issuer.
None of the stock information, data, and company information presented herein constitutes a recommendation by Navellier or a solicitation to buy or sell any securities. Any specific securities identified and described do not represent all of the securities purchased, sold, or recommended for advisory clients. The holdings identified do not represent all of the securities purchased, sold, or recommended for advisory clients and the reader should not assume that investments in the securities identified and discussed were or will be profitable.
Information presented is general information that does not take into account your individual circumstances, financial situation, or needs, nor does it present a personalized recommendation to you. Individual stocks presented may not be suitable for every investor. Investment in securities involves significant risk and has the potential for partial or complete loss of funds invested. Investment in fixed income securities has the potential for the investment return and principal value of an investment to fluctuate so that an investor’s holdings, when redeemed, may be worth less than their original cost.
One cannot invest directly in an index. Index is unmanaged and index performance does not reflect deduction of fees, expenses, or taxes. Presentation of Index data does not reflect a belief by Navellier that any stock index constitutes an investment alternative to any Navellier equity strategy or is necessarily comparable to such strategies. Among the most important differences between the Indices and Navellier strategies are that the Navellier equity strategies may (1) incur material management fees, (2) concentrate its investments in relatively few stocks, industries, or sectors, (3) have significantly greater trading activity and related costs, and (4) be significantly more or less volatile than the Indices.
ETF Risk: We may invest in exchange traded funds (“ETFs”) and some of our investment strategies are generally fully invested in ETFs. Like traditional mutual funds, ETFs charge asset-based fees, but they generally do not charge initial sales charges or redemption fees and investors typically pay only customary brokerage fees to buy and sell ETF shares. The fees and costs charged by ETFs held in client accounts will not be deducted from the compensation the client pays Navellier. ETF prices can fluctuate up or down, and a client account could lose money investing in an ETF if the prices of the securities owned by the ETF go down. ETFs are subject to additional risks:
- ETF shares may trade above or below their net asset value;
- An active trading market for an ETF’s shares may not develop or be maintained;
- The value of an ETF may be more volatile than the underlying portfolio of securities the ETF is designed to track;
- The cost of owning shares of the ETF may exceed those a client would incur by directly investing in the underlying securities; and
- Trading of an ETF’s shares may be halted if the listing exchange’s officials deem it appropriate, the shares are delisted from the exchange, or the activation of market-wide “circuit breakers” (which are tied to large decreases in stock prices) halts stock trading generally.
Grader Disclosures: Investment in equity strategies involves substantial risk and has the potential for partial or complete loss of funds invested. The sample portfolio and any accompanying charts are for informational purposes only and are not to be construed as a solicitation to buy or sell any financial instrument and should not be relied upon as the sole factor in an investment making decision. As a matter of normal and important disclosures to you, as a potential investor, please consider the following: The performance presented is not based on any actual securities trading, portfolio, or accounts, and the reported performance of the A, B, C, D, and F portfolios (collectively the “model portfolios”) should be considered mere “paper” or pro forma performance results based on Navellier’s research.
Investors evaluating any of Navellier & Associates, Inc.’s, (or its affiliates’) Investment Products must not use any information presented here, including the performance figures of the model portfolios, in their evaluation of any Navellier Investment Products. Navellier Investment Products include the firm’s mutual funds and managed accounts. The model portfolios, charts, and other information presented do not represent actual funded trades and are not actual funded portfolios. There are material differences between Navellier Investment Products’ portfolios and the model portfolios, research, and performance figures presented here. The model portfolios and the research results (1) may contain stocks or ETFs that are illiquid and difficult to trade; (2) may contain stock or ETF holdings materially different from actual funded Navellier Investment Product portfolios; (3) include the reinvestment of all dividends and other earnings, estimated trading costs, commissions, or management fees; and, (4) may not reflect prices obtained in an actual funded Navellier Investment Product portfolio. For these and other reasons, the reported performances of model portfolios do not reflect the performance results of Navellier’s actually funded and traded Investment Products. In most cases, Navellier’s Investment Products have materially lower performance results than the performances of the model portfolios presented.
This report contains statements that are, or may be considered to be, forward-looking statements. All statements that are not historical facts, including statements about our beliefs or expectations, are “forward-looking statements” within the meaning of The U.S. Private Securities Litigation Reform Act of 1995. These statements may be identified by such forward-looking terminology as “expect,” “estimate,” “plan,” “intend,” “believe,” “anticipate,” “may,” “will,” “should,” “could,” “continue,” “project,” or similar statements or variations of such terms. Our forward-looking statements are based on a series of expectations, assumptions, and projections, are not guarantees of future results or performance, and involve substantial risks and uncertainty as described in Form ADV Part 2A of our filing with the Securities and Exchange Commission (SEC), which is available at www.adviserinfo.sec.gov or by requesting a copy by emailing info@navellier.com. All of our forward-looking statements are as of the date of this report only. We can give no assurance that such expectations or forward-looking statements will prove to be correct. Actual results may differ materially. You are urged to carefully consider all such factors.
FEDERAL TAX ADVICE DISCLAIMER: As required by U.S. Treasury Regulations, you are informed that, to the extent this presentation includes any federal tax advice, the presentation is not written by Navellier to be used, and cannot be used, for the purpose of avoiding federal tax penalties. Navellier does not advise on any income tax requirements or issues. Use of any information presented by Navellier is for general information only and does not represent tax advice either express or implied. You are encouraged to seek professional tax advice for income tax questions and assistance.
IMPORTANT NEWSLETTER DISCLOSURE:The hypothetical performance results for investment newsletters that are authored or edited by Louis Navellier, including Louis Navellier’s Growth Investor, Louis Navellier’s Breakthrough Stocks, Louis Navellier’s Accelerated Profits, and Louis Navellier’s Platinum Club, are not based on any actual securities trading, portfolio, or accounts, and the newsletters’ reported hypothetical performances should be considered mere “paper” or proforma hypothetical performance results and are not actual performance of real world trades. Navellier & Associates, Inc. does not have any relation to or affiliation with the owner of these newsletters. There are material differences between Navellier Investment Products’ portfolios and the InvestorPlace Media, LLC newsletter portfolios authored by Louis Navellier. The InvestorPlace Media, LLC newsletters contain hypothetical performance that do not include transaction costs, advisory fees, or other fees a client might incur if actual investments and trades were being made by an investor. As a result, newsletter performance should not be used to evaluate Navellier Investment services which are separate and different from the newsletters. The owner of the newsletters is InvestorPlace Media, LLC and any questions concerning the newsletters, including any newsletter advertising or hypothetical Newsletter performance claims, (which are calculated solely by Investor Place Media and not Navellier) should be referred to InvestorPlace Media, LLC at (800) 718-8289.
Please note that Navellier & Associates and the Navellier Private Client Group are managed completely independent of the newsletters owned and published by InvestorPlace Media, LLC and written and edited by Louis Navellier, and investment performance of the newsletters should in no way be considered indicative of potential future investment performance for any Navellier & Associates separately managed account portfolio. Potential investors should consult with their financial advisor before investing in any Navellier Investment Product.
Navellier claims compliance with Global Investment Performance Standards (GIPS). To receive a complete list and descriptions of Navellier’s composites and/or a presentation that adheres to the GIPS standards, please contact Navellier or click here. It should not be assumed that any securities recommendations made by Navellier & Associates, Inc. in the future will be profitable or equal the performance of securities made in this report.
FactSet Disclosure: Navellier does not independently calculate the statistical information included in the attached report. The calculation and the information are provided by FactSet, a company not related to Navellier. Although information contained in the report has been obtained from FactSet and is based on sources Navellier believes to be reliable, Navellier does not guarantee its accuracy, and it may be incomplete or condensed. The report and the related FactSet sourced information are provided on an “as is” basis. The user assumes the entire risk of any use made of this information. Investors should consider the report as only a single factor in making their investment decision. The report is for informational purposes only and is not intended as an offer or solicitation for the purchase or sale of a security. FactSet sourced information is the exclusive property of FactSet. Without prior written permission of FactSet, this information may not be reproduced, disseminated or used to create any financial products. All indices are unmanaged and performance of the indices include reinvestment of dividends and interest income, unless otherwise noted, are not illustrative of any particular investment and an investment cannot be made in any index. Past performance is no guarantee of future results.