by Gary Alexander
June 27, 2023
We’ve seen a pretty good June in market indexes this month – until the dawn of summer last week:

Unfortunately, today’s date, June 27, plus June 26-29, has seen the beginning of some terrible times on Wall Street, mostly long ago. First, on June 27, 1857, The New York Herald foresaw dark days ahead.
“What can be the end of all this but another general collapse like that of 1837, only upon a much grander scale? Government spoilation, public defaulters, paper bubbles of all descriptions, a general scramble for Western lands and town and city sites, millions of dollars, made or borrowed, expended in fine houses and gaudy furniture; hundreds of thousands in silly rivalries of fashionable parvenus, in silks, laces, diamonds and every variety of costly frippery are only a few among the many crying evils of the day.”
– Editorial by James Gordon Bennett, founder and publisher of The New York Herald, June 27, 1857
My, these editors loved to sling purple prose in those days, but the financial press has always loved spinning scary scenarios, spawning an army of Doomsday prophets. In 1857, with the new, widespread use of the telegraph (the Internet of the day), the panic of dropping stock prices spread faster than ever, and when the gold-bearing steamer S.S. Central America sank in a September hurricane off the Carolina coast, the promised salvation of a major gold shipment drove many New York banks into bankruptcy – but The Stock Trader’s Almanac says the market rose 14.3% in 1858 and +160% from 1858 to 1864.
Moving along in this day in history:
On June 27, 1893, the Panic of 1893 began, when silver fell from 92-cents to 77-cents in one week. The proximate cause was the abandonment of silver coinage by India, a pro-silver nation. The U.S. silver dollar sank on world markets to 60-cents. The #1 subject in the minds of traders was the possible repeal of the Sherman Silver Purchase Law of 1890, forcing an unrealistic silver gold ratio of 16-to-1 ounces of gold, in a bi-metallic standard. This was unsustainable, so America entered a deep Depression in 1894. (However, the new Dow Jones index soared under McKinley’s Gold Bugs, rising 73.6%, 1896 to 1900.)
On June 29, 1906, the passage of the Hepburn Act empowered the Interstate Commerce Commission (ICC) to investigate and set railroad rates. President Roosevelt, in signing the Act, called it a major victory against the “malefactors of great wealth.” When a President calls business leaders “malefactors,” stocks tend to fall. The Dow Jones Industrial Index fell 48.5% from January 1, 1906, to November 11, 1907. However, the Dow industrials then rose by a sparking 46.6% in 1908, and another +15% in 1909.
On June 28, 1914, The Great War was launched when Serbian nationalist Gavrilo Princip fatally shot Archduke Franz Ferdinand, heir to the Austro-Hungarian empire, in Sarajevo, Bosnia. Soon, all European markets were closed from the end of July for the length of the war, and the seeds of the next World War were sewn exactly five years later, on June 28, 1919, with signing of the Treaty of Versailles, laying crippling reparations on Germany. U.S. President Woodrow Wilson won a Nobel Peace Prize for his efforts there, but British economist John Maynard Keynes accurately predicted (in “The Economic Consequences of the Peace,” 1919) that seeking vengeance at Versailles would lead to war, not peace.

Graphs are for illustrative and discussion purposes only. Please read important disclosures at the end of this commentary.
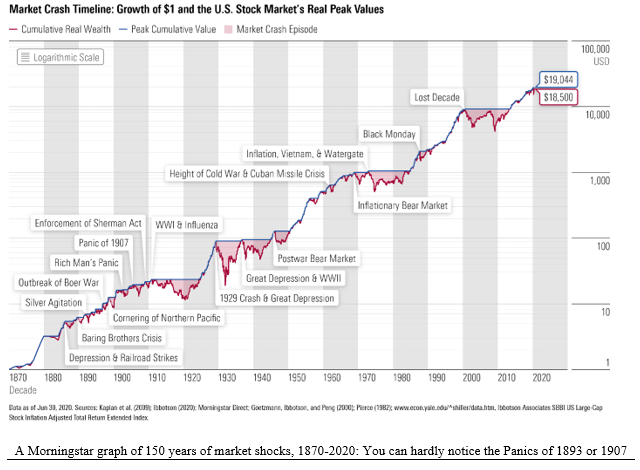
A Morningstar graph of 150 years of market shocks, 1870-2020: You can hardly notice the Panics of 1893 or 1907
Graphs are for illustrative and discussion purposes only. Please read important disclosures at the end of this commentary.
What was not noticeable at the time – only in hindsight – is that these early summer swoons provided a slingshot forward in the fall, or the next year. The Panics of 1893 and 1907 are small blips in history, and in World War I the Dow more than doubled from June 30, 1914 (at 52) to November 21, 1916 (at 110).
All of these previous panics came under the gold standard, before the Federal Reserve found its footing, but this final week in June also brought some memorable market dips and recoveries in more recent years:
Mid-Year Corrections Since 1940 Also Recovered Rapidly
In an eerie echo of what’s happening in Russia this week, on June 29, 1941 – 22 years after Versailles, Hitler broke his Non-Aggression Pact with Stalin and sent German divisions toward Leningrad, Moscow, and Kiev (Ukraine). The initial invasion came on June 22, but on this date, Riga, Latvia fell. (The Dow fell in late 1941, but the Dow rose from a low of 92.92 on April 28, 1942, to 212.50 on May 29, 1946.)
On Monday, June 26, 1950, the Dow fell by a staggering 10.44 points (-4.7%), to 213.91, the largest one-day drop since 1937, and the worst decline we would see until 1962 (below). The cause was the start of the Korean War on June 25. On June 29, President Truman declared a naval blockade. For the week of June 26-30, the Dow fell 15.24 points (-6.8%), to 209.11, the worst weekly drop since the 1930s, but what happened next? The market soared during the Korean War years, before Ike ended the hostilities in 1953.

On June 26, 1962, the Dow fell to 535.76, mercifully reaching the end of a steep, six-month 36% bear market (part of the “U.S. Steel sell-off”), but it was also the start of an 11-month (+51%) bull market.
On June 26, 1974, Bankhaus Herstatt, one of Germany’s largest private banks, collapsed—the first major bank failure since Western currencies began to float in 1973. On June 30, the famous beach scene from Steven Spielberg’s hit movie, “Jaws,” was filmed. A crowd of 400 screaming, panic-stricken extras in bathing suits ran from the surf – over and over again – until they were panicked enough to suit Spielberg. I like to imagine that those 400 extras might have been stock traders, because the 1974 bear market began in earnest that day. The Dow fell from 806 on July 1 to 584 on October 4th (down 27.5% in the quarter).
What next? From late 1974 to September 1976, the S&P 500 rose 73% and the Dow rose by over 75%.
So, when the market gets you down, read history for perspective. Then, today’s news won’t look so bad.
Next week, on America’s 247th birthday, I want to share some insights from some superb documentaries about American history I have been evaluating for the Anthem Film Festival for the upcoming Freedom Fest, to be held in Memphis, July 12-15. Louis Navellier will speak there as part of two high-level global investment panels, along with Steve Forbes, Mark Skousen, John Mauldin, Alex Green, and others. I will miss this Freedom Fest for the first time since its founding, but I am still one of the senior judges for the Film Festival and will bring you highlights of some of the best films with investment angles next week.
All content above represents the opinion of Gary Alexander of Navellier & Associates, Inc.
Also In This Issue
A Look Ahead by Louis Navellier
The Impact on Russia’s Energy Markets After Last Week’s Coup Attempt
Income Mail by Bryan Perry
The Wagner Rebellion Against Putin is a Very Bullish Event
Growth Mail by Gary Alexander
June Usually Springs Forward…Until Summer Begins
Global Mail by Ivan Martchev
The Fed Skip May Actually Be a Stop
Sector Spotlight by Jason Bodner
All Roads Lead to Profits…in Time
View Full Archive
Read Past Issues Here
About The Author

Gary Alexander
SENIOR EDITOR
Gary Alexander has been Senior Writer at Navellier since 2009. He edits Navellier’s weekly Marketmail and writes a weekly Growth Mail column, in which he uses market history to support the case for growth stocks. For the previous 20 years before joining Navellier, he was Senior Executive Editor at InvestorPlace Media (formerly Phillips Publishing), where he worked with several leading investment analysts, including Louis Navellier (since 1997), helping launch Louis Navellier’s Blue Chip Growth and Global Growth newsletters.
Prior to that, Gary edited Wealth Magazine and Gold Newsletter and wrote various investment research reports for Jefferson Financial in New Orleans in the 1980s. He began his financial newsletter career with KCI Communications in 1980, where he served as consulting editor for Personal Finance newsletter while serving as general manager of KCI’s Alexandria House book division. Before that, he covered the economics beat for news magazines. All content of “Growth Mail” represents the opinion of Gary Alexander
Important Disclosures:
Although information in these reports has been obtained from and is based upon sources that Navellier believes to be reliable, Navellier does not guarantee its accuracy and it may be incomplete or condensed. All opinions and estimates constitute Navellier’s judgment as of the date the report was created and are subject to change without notice. These reports are for informational purposes only and are not a solicitation for the purchase or sale of a security. Any decision to purchase securities mentioned in these reports must take into account existing public information on such securities or any registered prospectus.To the extent permitted by law, neither Navellier & Associates, Inc., nor any of its affiliates, agents, or service providers assumes any liability or responsibility nor owes any duty of care for any consequences of any person acting or refraining to act in reliance on the information contained in this communication or for any decision based on it.
Past performance is no indication of future results. Investment in securities involves significant risk and has the potential for partial or complete loss of funds invested. It should not be assumed that any securities recommendations made by Navellier. in the future will be profitable or equal the performance of securities made in this report. Dividend payments are not guaranteed. The amount of a dividend payment, if any, can vary over time and issuers may reduce dividends paid on securities in the event of a recession or adverse event affecting a specific industry or issuer.
None of the stock information, data, and company information presented herein constitutes a recommendation by Navellier or a solicitation to buy or sell any securities. Any specific securities identified and described do not represent all of the securities purchased, sold, or recommended for advisory clients. The holdings identified do not represent all of the securities purchased, sold, or recommended for advisory clients and the reader should not assume that investments in the securities identified and discussed were or will be profitable.
Information presented is general information that does not take into account your individual circumstances, financial situation, or needs, nor does it present a personalized recommendation to you. Individual stocks presented may not be suitable for every investor. Investment in securities involves significant risk and has the potential for partial or complete loss of funds invested. Investment in fixed income securities has the potential for the investment return and principal value of an investment to fluctuate so that an investor’s holdings, when redeemed, may be worth less than their original cost.
One cannot invest directly in an index. Index is unmanaged and index performance does not reflect deduction of fees, expenses, or taxes. Presentation of Index data does not reflect a belief by Navellier that any stock index constitutes an investment alternative to any Navellier equity strategy or is necessarily comparable to such strategies. Among the most important differences between the Indices and Navellier strategies are that the Navellier equity strategies may (1) incur material management fees, (2) concentrate its investments in relatively few stocks, industries, or sectors, (3) have significantly greater trading activity and related costs, and (4) be significantly more or less volatile than the Indices.
ETF Risk: We may invest in exchange traded funds (“ETFs”) and some of our investment strategies are generally fully invested in ETFs. Like traditional mutual funds, ETFs charge asset-based fees, but they generally do not charge initial sales charges or redemption fees and investors typically pay only customary brokerage fees to buy and sell ETF shares. The fees and costs charged by ETFs held in client accounts will not be deducted from the compensation the client pays Navellier. ETF prices can fluctuate up or down, and a client account could lose money investing in an ETF if the prices of the securities owned by the ETF go down. ETFs are subject to additional risks:
- ETF shares may trade above or below their net asset value;
- An active trading market for an ETF’s shares may not develop or be maintained;
- The value of an ETF may be more volatile than the underlying portfolio of securities the ETF is designed to track;
- The cost of owning shares of the ETF may exceed those a client would incur by directly investing in the underlying securities; and
- Trading of an ETF’s shares may be halted if the listing exchange’s officials deem it appropriate, the shares are delisted from the exchange, or the activation of market-wide “circuit breakers” (which are tied to large decreases in stock prices) halts stock trading generally.
Grader Disclosures: Investment in equity strategies involves substantial risk and has the potential for partial or complete loss of funds invested. The sample portfolio and any accompanying charts are for informational purposes only and are not to be construed as a solicitation to buy or sell any financial instrument and should not be relied upon as the sole factor in an investment making decision. As a matter of normal and important disclosures to you, as a potential investor, please consider the following: The performance presented is not based on any actual securities trading, portfolio, or accounts, and the reported performance of the A, B, C, D, and F portfolios (collectively the “model portfolios”) should be considered mere “paper” or pro forma performance results based on Navellier’s research.
Investors evaluating any of Navellier & Associates, Inc.’s, (or its affiliates’) Investment Products must not use any information presented here, including the performance figures of the model portfolios, in their evaluation of any Navellier Investment Products. Navellier Investment Products include the firm’s mutual funds and managed accounts. The model portfolios, charts, and other information presented do not represent actual funded trades and are not actual funded portfolios. There are material differences between Navellier Investment Products’ portfolios and the model portfolios, research, and performance figures presented here. The model portfolios and the research results (1) may contain stocks or ETFs that are illiquid and difficult to trade; (2) may contain stock or ETF holdings materially different from actual funded Navellier Investment Product portfolios; (3) include the reinvestment of all dividends and other earnings, estimated trading costs, commissions, or management fees; and, (4) may not reflect prices obtained in an actual funded Navellier Investment Product portfolio. For these and other reasons, the reported performances of model portfolios do not reflect the performance results of Navellier’s actually funded and traded Investment Products. In most cases, Navellier’s Investment Products have materially lower performance results than the performances of the model portfolios presented.
This report contains statements that are, or may be considered to be, forward-looking statements. All statements that are not historical facts, including statements about our beliefs or expectations, are “forward-looking statements” within the meaning of The U.S. Private Securities Litigation Reform Act of 1995. These statements may be identified by such forward-looking terminology as “expect,” “estimate,” “plan,” “intend,” “believe,” “anticipate,” “may,” “will,” “should,” “could,” “continue,” “project,” or similar statements or variations of such terms. Our forward-looking statements are based on a series of expectations, assumptions, and projections, are not guarantees of future results or performance, and involve substantial risks and uncertainty as described in Form ADV Part 2A of our filing with the Securities and Exchange Commission (SEC), which is available at www.adviserinfo.sec.gov or by requesting a copy by emailing info@navellier.com. All of our forward-looking statements are as of the date of this report only. We can give no assurance that such expectations or forward-looking statements will prove to be correct. Actual results may differ materially. You are urged to carefully consider all such factors.
FEDERAL TAX ADVICE DISCLAIMER: As required by U.S. Treasury Regulations, you are informed that, to the extent this presentation includes any federal tax advice, the presentation is not written by Navellier to be used, and cannot be used, for the purpose of avoiding federal tax penalties. Navellier does not advise on any income tax requirements or issues. Use of any information presented by Navellier is for general information only and does not represent tax advice either express or implied. You are encouraged to seek professional tax advice for income tax questions and assistance.
IMPORTANT NEWSLETTER DISCLOSURE:The hypothetical performance results for investment newsletters that are authored or edited by Louis Navellier, including Louis Navellier’s Growth Investor, Louis Navellier’s Breakthrough Stocks, Louis Navellier’s Accelerated Profits, and Louis Navellier’s Platinum Club, are not based on any actual securities trading, portfolio, or accounts, and the newsletters’ reported hypothetical performances should be considered mere “paper” or proforma hypothetical performance results and are not actual performance of real world trades. Navellier & Associates, Inc. does not have any relation to or affiliation with the owner of these newsletters. There are material differences between Navellier Investment Products’ portfolios and the InvestorPlace Media, LLC newsletter portfolios authored by Louis Navellier. The InvestorPlace Media, LLC newsletters contain hypothetical performance that do not include transaction costs, advisory fees, or other fees a client might incur if actual investments and trades were being made by an investor. As a result, newsletter performance should not be used to evaluate Navellier Investment services which are separate and different from the newsletters. The owner of the newsletters is InvestorPlace Media, LLC and any questions concerning the newsletters, including any newsletter advertising or hypothetical Newsletter performance claims, (which are calculated solely by Investor Place Media and not Navellier) should be referred to InvestorPlace Media, LLC at (800) 718-8289.
Please note that Navellier & Associates and the Navellier Private Client Group are managed completely independent of the newsletters owned and published by InvestorPlace Media, LLC and written and edited by Louis Navellier, and investment performance of the newsletters should in no way be considered indicative of potential future investment performance for any Navellier & Associates separately managed account portfolio. Potential investors should consult with their financial advisor before investing in any Navellier Investment Product.
Navellier claims compliance with Global Investment Performance Standards (GIPS). To receive a complete list and descriptions of Navellier’s composites and/or a presentation that adheres to the GIPS standards, please contact Navellier or click here. It should not be assumed that any securities recommendations made by Navellier & Associates, Inc. in the future will be profitable or equal the performance of securities made in this report.
FactSet Disclosure: Navellier does not independently calculate the statistical information included in the attached report. The calculation and the information are provided by FactSet, a company not related to Navellier. Although information contained in the report has been obtained from FactSet and is based on sources Navellier believes to be reliable, Navellier does not guarantee its accuracy, and it may be incomplete or condensed. The report and the related FactSet sourced information are provided on an “as is” basis. The user assumes the entire risk of any use made of this information. Investors should consider the report as only a single factor in making their investment decision. The report is for informational purposes only and is not intended as an offer or solicitation for the purchase or sale of a security. FactSet sourced information is the exclusive property of FactSet. Without prior written permission of FactSet, this information may not be reproduced, disseminated or used to create any financial products. All indices are unmanaged and performance of the indices include reinvestment of dividends and interest income, unless otherwise noted, are not illustrative of any particular investment and an investment cannot be made in any index. Past performance is no guarantee of future results.